Randomized Controlled Trial
. 2025 Apr 30;22(1):101.
doi: 10.1186/s12984-025-01636-6.

Activity-based recovery training with spinal cord epidural stimulation improves standing performance in cervical spinal cord injury

Affiliations
Randomized Controlled Trial

Activity-based recovery training with spinal cord epidural stimulation improves standing performance in cervical spinal cord injury

Claudia A Angeli et al. J Neuroeng Rehabil. .

Abstract

Background: Individuals with a clinically complete spinal cord injury are unable to stand independently without external assistance. Studies have shown the combination of spinal cord epidural stimulation (scES) targeted for standing with activity-based recovery training (ABRT) can promote independence of standing in individuals with spinal cord injury. This cohort study aimed to assess the effects of stand-ABRT with scES in individuals with cervical chronic spinal cord injury. We evaluated the ability of these individuals to stand independently from physical assistance across multiple sessions.

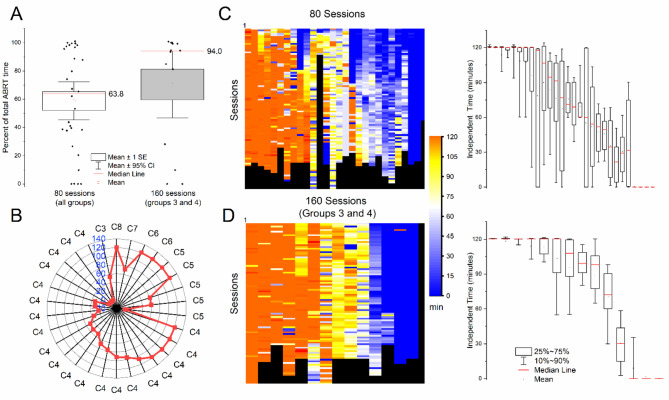
Methods: Thirty individuals participated in this study, all unable to stand independently at the start of the intervention. Individuals were participating in a randomized clinical trial and received stand-ABRT in addition to targeted cardiovascular scES or voluntary scES. During the standing intervention, participants were asked to stand 2 h a day, 5 days a week for 80 sessions (Groups 1 and 2) or 160 sessions (Groups 3 and 4).

Results: A total of 3,524 training days were considered for analysis. Group 1 had 507 days, group 2 with 578 days, and 1152 and 1269 days for groups 3 and 4 respectively. 71% of sessions reached the two-hour standing goal. All individuals achieved outcomes of lower limb independent extension with spinal cord epidural stimulation, with a wide range throughout a training day. Sixteen participants achieved unassisted hip extension while maintaining unassisted bilateral knee and trunk extension. Participants receiving initial voluntary scES training performed better in unassisted bilateral knee and trunk extension than those receiving initial cardiovascular scES. The lower-limb standing activation pattern changes were consistent with the greater standing independence observed by all groups.

Conclusions: Individuals with chronic cervical spinal cord injury were able to achieve various levels of extension without manual assistance during standing with balance assist following stand-ABRT with scES. These results provide evidence that scES modulates network excitability of the injured spinal cord to allow for the integration of afferent and supraspinal descending input to promote standing in individuals with spinal cord injury.

Trial registration: The study was registered on Clinical Trials.gov (NCT03364660) prior to subject enrollment.

Keywords: Cervical spinal cord injury; Epidural spinal stimulation; Independence; Rehabilitation; Standing.


Conflict of interest statement

Declarations. Ethics approval and consent to participate: The Institutional Review Boad of the University of Louisville approved the study protocol (16–0179 and approved on 10/19/2017). All participants provided written informed consent according to the Declaration of Helsinki. Consent for publication: Research participants involved in the videos and images provided additional consent for publication. Competing interests: The authors declare no competing interests.

Figures

Fig. 1
Fig. 1
Randomized clinical trial design. Following implantation individuals were randomized into one of four groups. Group 1 received CV-scES for 80 sessions followed by 80 sessions of CV-scES and Stand-ABRT with Stand-scES. Group 2 received Vol-scES for 80 sessions followed by 80 sessions of Vol-scES and Stand-ABRT with Stand-scES. Group 3 received CV-scES and Stand-ABRT with Stand-scES for 80 sessions and repeated the same intervention for an additional 80 sessions. Group 4 received Vol-scES and Stand-ABRT with Stand-scES for 80 sessions and repeated the same intervention for an additional 80 sessions
Fig. 2
Fig. 2
Incidence of inability to reach two-hour weight-bearing target. (A) Reported or measured rationale for ending the standing session prior to 2-hr target. (B) Box Plots including individual data for sessions that did not reach the 2-hr target
Fig. 3
Fig. 3
Trunk Independence Levels during Standing. (A) Percent of total Standing time across all sessions with trunk independence for the first and second standing intervention. Box plots are mean +/- 1 standard deviation, lines represent 95% confidence interval. Median line is red. (B) Radial graph showing relationship between neurological level of injury and median trunk independence minutes across sessions. Inter-circles are 20 min intervals from 0–120 min. (C) Color map (left) shows the trunk independence time during each training session (rows) across participants (columns) for the two-hour intervention during their initial standing intervention (80 sessions). Top row indicates the first session. Box plot (right) representing trunk independence time for each participant. Median is represented in red. (D) Color map (left) shows the trunk independence time during each training session (rows) across participants (columns) for the two-hour intervention during their second standing intervention (Groups 3 and 4). Top row indicates the first session of the second standing intervention. Box plot (right) representing trunk independence time for each participant. Median is represented in red
Fig. 4
Fig. 4
Lower-extremity Independence Levels during Standing. (A) Percent of total Standing time across all sessions with left knee (gray), right knee (blue) or bilateral (pink) independence. Each line is a participant during their initial standing intervention (80 sessions). (B) Percent of total Standing time across all sessions with left knee (gray), right knee (blue) or bilateral (pink) independence. Each line is a participant during their second standing intervention (Groups 3 and 4). (C) EMG features in time and frequency domains collected during standing pre and post intervention. EMG features values were averaged among participants and among all assessed muscles. Values are expressed as median + mean absolute deviation. Differences were tested by Wilcoxon test * p < 0.05. (D) EMG features in time and frequency domains collected during standing post intervention 1 and post intervention 2 for groups 3 and 4. EMG features values were averaged among participants and among all assessed muscles. Values are expressed as median + mean absolute deviation. (E) Color map (top) shows the bilateral independence time during each training session (rows) across participants (columns) for the two-hour intervention during their initial standing intervention (80 sessions). Top row indicates the first session. Box plot (bottom) representing bilateral independence time for each participant. Median is represented in red. (F) Color map (top) shows the bilateral independence time during each training session (rows) across participants (columns) for the two-hour intervention during their second standing intervention (Groups 3 and 4). Top row indicates the first session of the second standing intervention. Box plot (bottom) representing bilateral independence time for each participant. Median is represented in red
Fig. 5
Fig. 5
Representative standing activation patterns pre and post intervention. EMG collected from participant A123 (left lower limb) prior to any intervention (Pre-Intervention) and after 80 sessions of stand training with epidural stimulation (Stand-scES) combined with epidural stimulation for cardiovascular function (Group 3; Post-Intervention 1). The participant required manual assistance at both knees Pre-Intervention, while independent knees extension was achieved Post-Intervention 1. Trunk and hips were manually assisted for all standing bouts reported. The two representative activation patterns per time point were collected within the longest standing bout considered for analysis, 4 min apart at Pre-Intervention and 8 min apart at Post-Intervention 1. Baseline EMG collected during sitting without scES is also shown (to the left of standing panels). Note the more variable EMG and vertical ground reaction force (Force) pattern at Pre-intervention when manual assistance at the knees was required. GL, gluteus maximus; MH, medial hamstring; RF: rectus femoris; VL, vastus lateralis; TA, tibialis anterior; SOL, soleus
Fig. 6
Fig. 6
Standing without manual assistance. (A) Photograph of individual (B41) standing with independent trunk, hips and bilateral knees using a walker for balance assist. (B) Maximum independent minutes standing with independent trunk, hips and bilateral knees during single session. Each data point is a participant (n = 16). Individuals above the 40-minute line are shown in plot C (n = 8). (C) Box plot showing session time standing with independent trunk, hips and bilateral knees for individual participants. Group 2 (Vol-scES): blue dashed, Group 3 (CV-scES + Stand-scES): red fill, Group 4 (Vol-scES + Stand-scES): blue fill. Box plots are mean +/- 1 standard deviation, lines represent 95% confidence interval
Fig. 7
Fig. 7
Group comparisons of knee independence during standing. (A) Top: left, right and bilateral knee independence comparison for Group 1 (CV) and Group 2 (Voluntary). Bottom: EMG features in time and frequency domains collected during standing post intervention 1 vs. post intervention 2. Values were averaged among participants and among all assessed muscles. Values are expressed as median + MAD. (B) Top: left, right and bilateral knee independence comparison for Group 1 (CV) and Group 3 (CV-Stand). The graph compared the initial 80 sessions of standing (intervention 2 for group 1; and intervention 1 for group 3). Bottom: EMG features in time and frequency domains collected during standing pre vs. post intervention 1 for Group 3 and post intervention 1 vs. post intervention 2 for Group (1) (C) Top: left, right and bilateral knee independence comparison for Group 2 (Voluntary) and Group 4 (Voluntary-Stand). The graph compared the initial 80 sessions of standing (intervention 2 for group 2; and intervention 1 for group 4). Bottom: EMG features in time and frequency domains collected during standing pre vs. post intervention 1 for Group 4 and post intervention 1 vs. post intervention 2 for Group (2) Differences assessed by Wilcoxon test * p < 0.05. (D) Top: left, right and bilateral knee independence comparison between intervention 1 and intervention 2 for Group 3 (CV-stand). Bottom: EMG features in time and frequency domains collected during standing pre vs. post intervention 1 vs. post intervention 2. (E) Top: left, right and bilateral knee independence comparison between intervention 1 and intervention 2 for Group 4 (Voluntary-stand). Bottom: EMG features in time and frequency domains collected during standing pre vs. post intervention 1 vs. post intervention 2. (F) Box plot comparing trunk independence across groups and interventions. Box plots are mean +/- 1 standard deviation, lines represent 95% confidence interval

References

    1. Singh R, Rohilla RK, Saini G, Kaur K. Longitudinal study of body composition in spinal cord injury patients. Indian J Orthop [Internet]. 2014;48(2):168–77. Available from: https://www.ncbi.nlm.nih.gov/pubmed/24741139 - PMC - PubMed
    1. Castro MJ, Apple DF Jr., Staron RS, Campos GE, Dudley GA. Influence of complete spinal cord injury on skeletal muscle within 6 mo of injury. JApplPhysiol. 1999;86(1):350–8. - PubMed
    1. Cragg JJ, Noonan VK, Krassioukov A, Borisoff J. Cardiovascular disease and spinal cord injury: results from a national population health survey. Neurology. 2013/07/26. 2013;81(8):723–8. - PMC - PubMed
    1. Cragg JJ, Noonan VK, Dvorak M, Krassioukov A, Mancini GB, Borisoff JF. Spinal cord injury and type 2 diabetes: Results from a population health survey. Neurology [Internet]. 2013; Available from: http://www.ncbi.nlm.nih.gov/pubmed/24153440 - PMC - PubMed
    1. Gorgey AS, Khalil RE, Carter W, Ballance B, Gill R, Khan R et al. Effects of two different paradigms of electrical stimulation exercise on cardio-metabolic risk factors after spinal cord injury. A randomized clinical trial. Front Neurol. 2023;14(September). - PMC - PubMed

Publication types

Associated data