

Comparative evaluation of methods for isolating extracellular vesicles from ICC cell culture supernatants: Insights into proteomic and glycomic analysis
- PMID: 40301937
- PMCID: PMC12042569
- DOI: 10.1186/s12964-025-02207-x
Comparative evaluation of methods for isolating extracellular vesicles from ICC cell culture supernatants: Insights into proteomic and glycomic analysis
Abstract
Background: Extracellular vesicles (EVs) are nanoscale structures involved in intercellular communication and play a key role in cancer pathology. Intrahepatic cholangiocarcinoma (ICC) is a highly invasive malignancy marked by abnormal sialylated glycosylation. Analyzing proteins and glycans in EVs provides insights into ICC molecular subtyping and mechanisms. Optimizing EV isolation methods for ICC-derived EVs enables comprehensive proteomic and glycomic analysis.
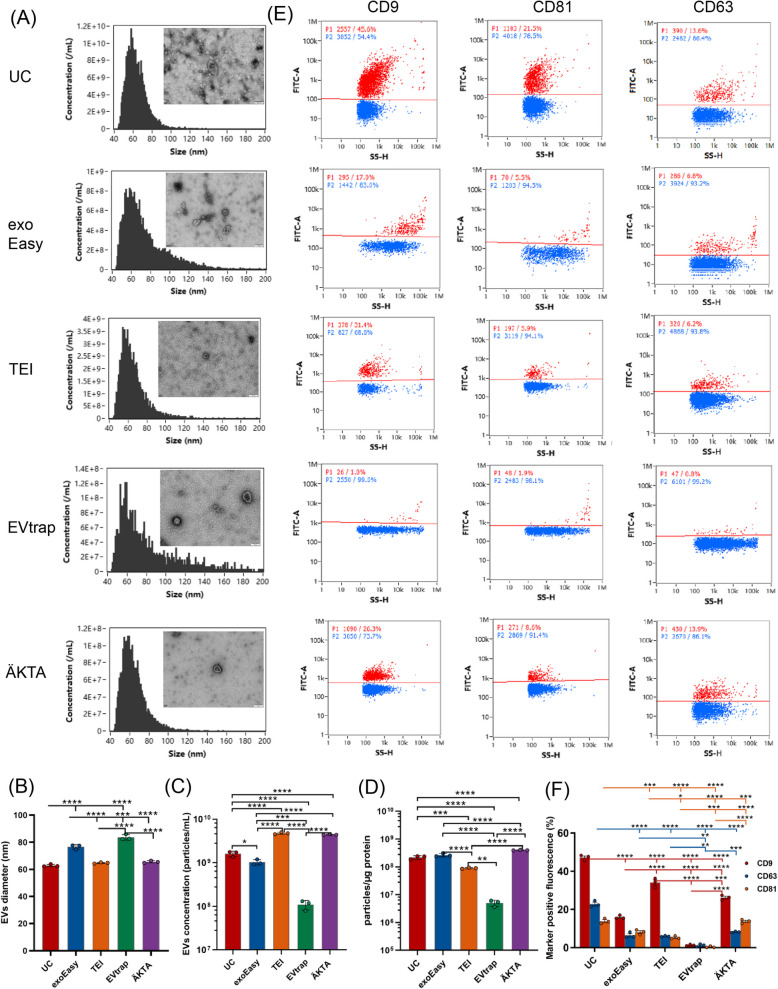
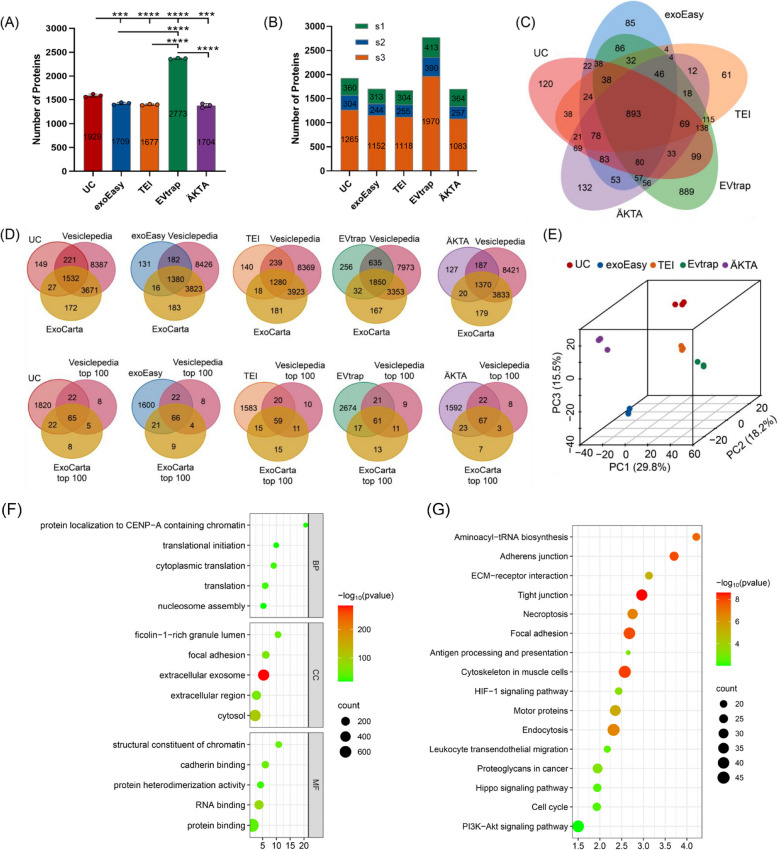
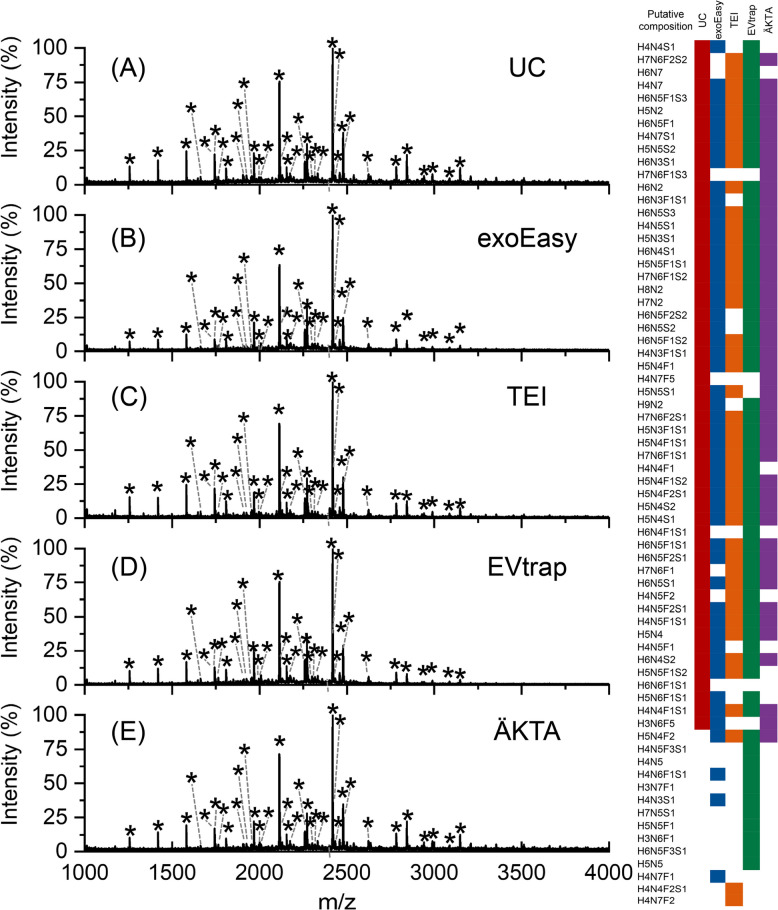
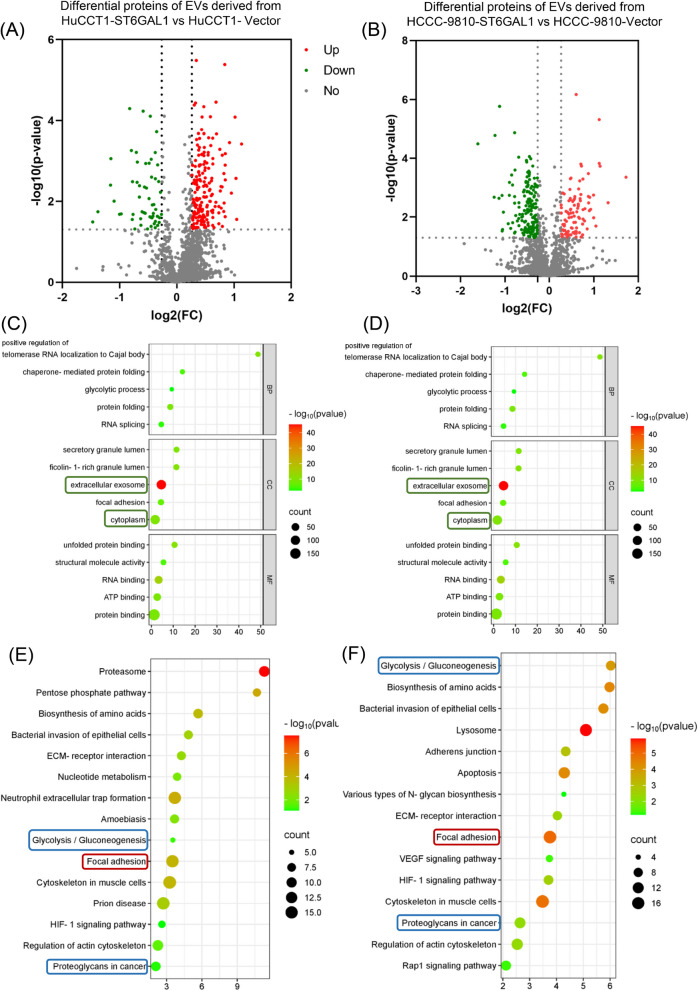
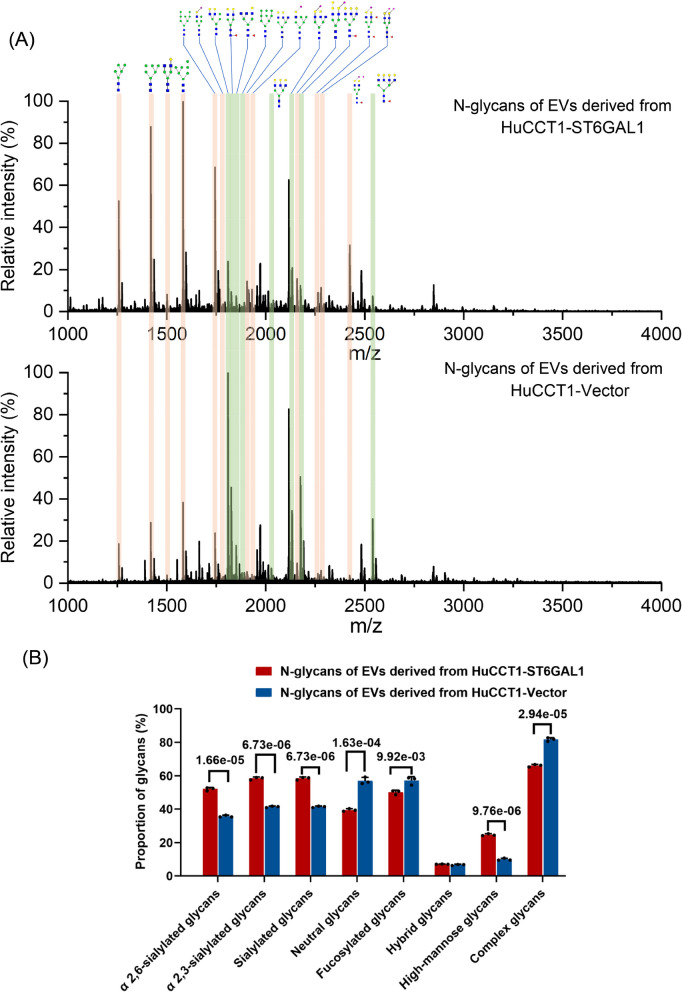
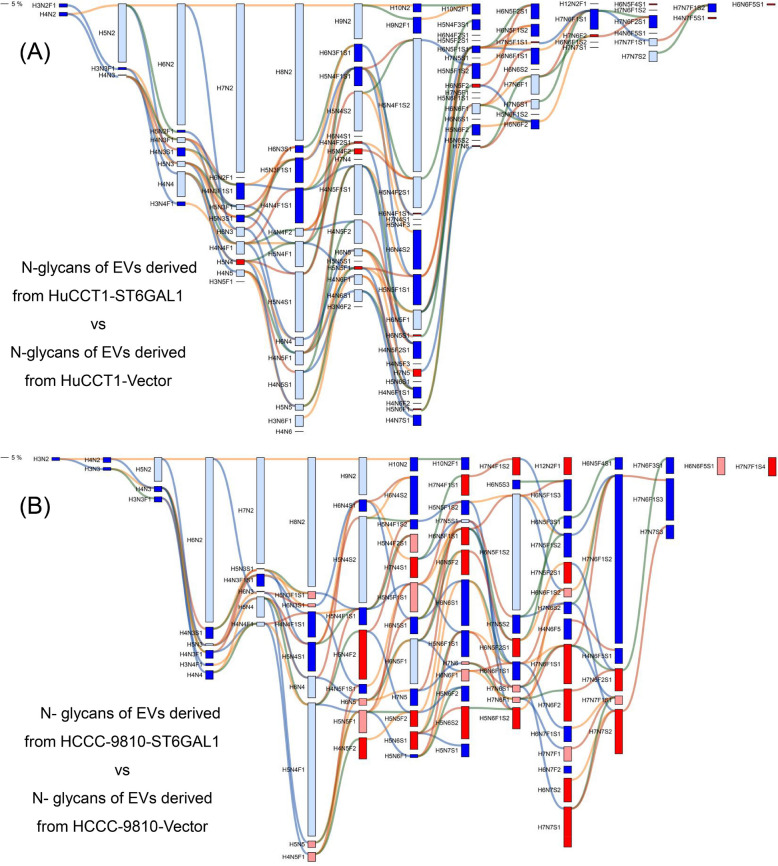
Methods: We systematically evaluated five EV isolation methods-Ultracentrifugation (UC), exoEasy, Total Exosome Isolation (TEI), EVtrap, and ÄKTA-by analyzing the biophysical properties, proteomic profiles, and glycomic structures of EVs. Subsequently, we applied TMT-based quantitative proteome and light/heavy methylamine labeling for the quantification of sialylated N-glycan linkage isomers to investigate alterations in proteins and N-glycans within EVs secreted by HuCCT1 and HCCC-9810 cells with overexpressing ST6 β‑galactoside α2,6‑sialyltransferase 1 (ST6GAL1).
Results: By evaluating the biophysical properties, proteome, and N-glycome of EVs extracted using five different methods, UC was identified as the optimal approach for this study, as it offered a balance between operational complexity, cost-effectiveness, and the preservation of EVs activity. In this study, a total of 1,928 high-confidence proteins and over 84 high-confidence glycans were quantified. EVs secreted by HuCCT1 and HCCC-9810 cells overexpressing ST6GAL1 exhibited consistent upregulation of 16 proteins, consistent downregulation of 10 proteins, as well as consistent upregulation of 3 glycans and consistent downregulation of 3 glycans.
Conclusions: Quantitative proteomic and glycomic analysis of ICC-derived EVs revealed that ST6GAL1 overexpression led to significant alterations in proteins involved in cancer cell adhesion and glycosylation pathways, along with specific changes in N-glycan structures. Notably, these modifications extended beyond α2,6-sialylation, suggesting that interactions between glycosyltransferases and glycans may drive these alterations.
Keywords: Cell culture supernatants; Extracellular vesicles; N-glycome; Proteome.
© 2025. The Author(s).
Conflict of interest statement
Declarations. Competing interests: The authors declare no competing interests.
Figures


Similar articles
-
Hypoxia-Induced Adaptations of N-Glycomes and Proteomes in Breast Cancer Cells and Their Secreted Extracellular Vesicles.Int J Mol Sci. 2024 Sep 23;25(18):10216. doi: 10.3390/ijms251810216. Int J Mol Sci. 2024. PMID: 39337702 Free PMC article.
-
Liver membrane proteome glycosylation changes in mice bearing an extra-hepatic tumor.Mol Cell Proteomics. 2011 Sep;10(9):M900538MCP200. doi: 10.1074/mcp.M900538-MCP200. Epub 2010 Feb 18. Mol Cell Proteomics. 2011. PMID: 20167946 Free PMC article.
-
Comprehensive review of MS-based studies on N-glycoproteome and N-glycome of extracellular vesicles.Proteomics. 2024 Jun;24(11):e2300065. doi: 10.1002/pmic.202300065. Epub 2023 Jul 20. Proteomics. 2024. PMID: 37474487 Review.
-
Glycosylation on extracellular vesicles and its detection strategy: Paving the way for clinical use.Int J Biol Macromol. 2025 Mar;295:139714. doi: 10.1016/j.ijbiomac.2025.139714. Epub 2025 Jan 9. Int J Biol Macromol. 2025. PMID: 39798737 Review.
-
N-glycome inheritance from cells to extracellular vesicles in B16 melanomas.FEBS Lett. 2019 May;593(9):942-951. doi: 10.1002/1873-3468.13377. Epub 2019 Apr 11. FEBS Lett. 2019. PMID: 30943309 Free PMC article.
References
-
- Moris D, Palta M, Kim C, et al. Advances in the treatment of intrahepatic cholangiocarcinoma: An overview of the current and future therapeutic landscape for clinicians. CA Cancer J Clin. 2022;73(2):198–222. - PubMed
-
- Banales JM, Cardinale V, Carpino G, et al. Current knowledge and future perspectives consensus statement from the european network for the study of cholangiocarcinoma (ENS-CCA)[J]. Nat Rev Gastroenterol Hepatol. 2016;13:261–80. - PubMed
-
- Liu ZH, Lian BF, Dong QZ, et al. Whole-exome mutational and transcriptional landscapes of combined hepatocellular cholangiocarcinoma and intrahepatic cholangiocarcinoma reveal molecular diversity. Biochim Biophys Acta Mol Basis Dis . 2018;1864(6):2360–8. - PubMed
Publication types
MeSH terms
Substances
Grants and funding
LinkOut - more resources
Full Text Sources
