. 2025 Apr 29;44(1):134.
doi: 10.1186/s13046-025-03376-w.

Red blood cell-tumor cell interactions promote tumor cell progression

Affiliations

Red blood cell-tumor cell interactions promote tumor cell progression

Thais Pereira-Veiga et al. J Exp Clin Cancer Res. .

Abstract

A critical step in the metastatic cascade is the survival of circulating tumor cells (CTCs) within the bloodstream. Although interactions between CTCs and various hematopoietic cells have been described, the role of red blood cells (RBCs) remains underexplored. This study investigated the interactions between tumor cells and RBCs from breast and lung cancer patients, revealing significant phenotypic and functional changes in tumor cells, unlike interactions with RBCs from healthy donors. Tumor cell and patient-derived RBC co-cultures increased tumor cell attachment and induced morphological changes. RBC-primed tumor cells showed increased adhesion, disruption of the endothelial barrier, and invasiveness, both in vitro and in vivo. Global proteome changes, including actin remodeling and VASP accumulation at cell edges, promote directional migration. RBCs from patients with metastatic breast cancer also upregulate PAK4, enhancing migration and epithelial-mesenchymal transition, whereas PAK4 inhibition reduces these effects. Clinically, a higher red blood cell distribution width (RDW) in patients with metastasis is associated with increased CTC counts and poor outcomes. This study highlights the previously unrecognized role of RBCs in promoting metastatic behavior in cancer cells and suggests potential therapeutic targets, such as PAK4, to counteract these effects.

Keywords: Actin remodeling; Breast cancer; Circulating tumor cells; Liquid biopsy; Lung cancer; Red blood cells (RBCs).


Conflict of interest statement

Declarations. Ethics approval and consent to participate: All patients and HD patients provided written informed consent. The study was conducted according to the guidelines of the Declaration of Helsinki and approved by the Ethics Committee of Galicia (2015/772) and by the Ärztekammer of Hamburg (PV-5392). Consent for publication: Not applicable. Competing interests: The authors declare no competing interests.

Figures
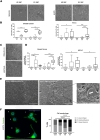
Fig. 1
Fig. 1
RBCs and tumor cells interact in suspension. (A) Exemplary pictures depicting the interaction between RBCs (from healthy donors (HD) and metastatic patients (M1)) and tumor cells (MDA-MB-231 and H1975), showing a ring of RBCs from M1 patients attaching to a tumor cell, or no interaction for RBCs from HD (marked with a white arrow). (B) Boxplots showing the percentage of tumor cells (MCF7, MDA-MB-231, H1975, and A549) interacting with RBCs from HD, M0 or M1 patients (n = 15 per group, except MCF7 M1: n = 4, 30 cells quantified/sample, triplicates). (C) Exemplary pictures depicting the change of morphology and adhesion of tumor cells (MDA-MB-231 and H1975) under ultra-low attachment conditions. (D) Percentage of cells showing changes in morphology when MCF7, MDA-MB-231, H1975 or A549 are co-cultured with RBCs from M0 or M1 cancer patients compared to HD (n = 10–15 per group, except MCF7 M1: n = 4, 30 cells quantified/sample, triplicates). (E) Representative images after 11 h of co-culture with H1975 and RBCs from either a HD or a M1 NSCLC patient from the time-lapse. The white arrow indicates the formation of lamellipodia-like structures. (F) Representative immunofluorescence images of morphological changes visualized by Alexa-fluor488-phalloidin staining of H1975 cells primed with RBCs (left panel) and quantification of type of morphological changes (right panel) (n = 5 per group, triplicates). * P < 0.05, ** P < 0.01, *** P < 0.001
Fig. 2
Fig. 2
Functional evaluation of tumor cells after RBCs contact. (A) Boxplots showing tumor cell transwell migration following priming (direct interaction) with RBCs from healthy donors (HD), M0, or M1 patients for breast cancer (MDA-MB-231, left panel) and non-small cell lung cancer (NSCLC) cells (H1975, right panel), or non-primed control (Ctrl) cells (n = 5 per group, triplicates). (B) Boxplot illustrating tumor cell transwell migration when RBCs from HD or M1 are placed in the bottom well (indirect interaction) for MDA-MB-231 (left panel) and H1975 (right panel), compared to non-primed control cells (Ctrl) (n = 5 per group, triplicates). (C) Representative images of MDA-MB-231 cells observed in the migrated fraction from the indirect transwell assay, showing cells without RBC priming (Ctrl) in the upper panel and cells primed with M1 RBCs in the bottom panel, with the latter displaying notable morphological changes (D) Absorbance values reflecting the adhesion to collagen I by MDA-MB-231 after priming with RBCs from HD, M0 or M1 (n= 5 per group, triplicates). A negative control condition without priming with RBCs was included (Ctrl, n= 5). (E) Boxplots representing the MDA-MB-231 and H1975 cell counts (primed with RBCs from HD, M1 or non-primed tumor cells (n=5 per group, triplicates)) that adhered to endothelial cells (HUVEC). (F) Electric Cell-substrate Impedance Sensing (ECIS) assay results indicate a greater disruption of the endothelial barrier function when H1975 cells are primed with RBCs from M1 NSCLC patients (red line) compared to HD (green line), unprimed H1975 cells (blue line), or medium without cells (black line) (n=3 per group, duplicates)(left panel). Boxplot of the normalized transendothelial resistance (TER) of H1975 cells primed with HD or M1 RBCs and unprimed cells (Ctrl) (right panel). (G) Representative images of tumor cell dissemination in the tail region of the zebrafish embryos injected with either MDA-MB-231 or H1975 cancer cell lines primed with RBCs from metastatic patients or HD, at 1 day post injection (dpi) (ntotal = 75 embryos per group, triplicates; survival MDA-MB-231 HD = 94, M1 = 75; survival H1975 HD = 162, M1 = 176). The main images are a superposition of a fluorescence image and a bright field image of the same embryo. Quantification of disseminated tumor cells on the zebrafish embryo's tails at 1dpi. * P < 0.05, ** P < 0.01, *** P < 0.001
Fig. 3
Fig. 3
Transcriptomic and functional analysis of MDA-MB-231 cells primed with RBCs or non-primed. (A) Heatmap showing results of the hierarchical clustering analysis of the significantly differentially expressed genes in MDA-MB-231 primed with RBCs from either HD (green) or M1 patients (purple) (n= 3 per group). (B) Volcano plot for the differentially expressed genes between HD and M1 samples. (C) Gene ontology analysis of the differentially expressed genes displaying the biological processes altered on MDA-MB-231 after co-cultivation with RBCs. (D) PAK4, VIM and PLS3 gene expression was analyzed by RT-qPCR, from MDA-MB-231 samples co-cultured with HD, M0 or M1 RBCs. Samples were relativized to B2M and normalized to Δct from negative control (non-primed cells, Ctrl) (n= 14 per group, triplicates). (E) A representative immunofluorescence image (left panel) highlights vimentin expression (in red) in MDA-MB-231 cells primed with M1 RBCs, with polarized regions marked by white arrows. Boxplot showing the percentage of polarized MDA-MB-231 cells in each group: Crtl(n=4) or after priming with RBCs from HD and M1 patients (n=6, each) (right panel). (F) Graph representing migration of MDA-MB-231 co-cultured with metastatic breast cancer RBCs or without RBCs in the presence or absence of PAK4 inhibitor (PAKi, LCH-7749944) (n= 5 per group, duplicates). (G) Graph representing adhesion to collagen I of MDA-MB-231 primed with metastatic breast cancer RBCs or without RBCs in the presence or absence of PAK4i (n= 5 per group, triplicates). * P < 0.05, ** P < 0.01, *** P < 0.001
Fig. 4
Fig. 4
Proteomic analysis of tumor cells primed with RBCs from cancer patients, HD and non-primed (Ctrl). (A) Hierarchical clustering based on Pearson correlation of ANOVA-significant proteins of H1975 cell primed with RBCs from HD, M0 and M1 patients (n = 5 per group, quadruplicates). (B) Volcano plot for the differentially abundant proteins between M1 and HD samples. (C) Bar plot representing the quantification of the fluorescence intensity in H1975 cells stained with anti-K5 and anti-E-cadherin, post-priming with RBCs from HD or metastatic patients (n = 30 cells quantified/group, n = 3). (D) Gene ontology analysis of the differentially expressed proteins showing the biological processes affected on H1975 cells after priming with RBCs. (E) Hierarchical clustering of the differential abundance of the proteins from the dataset involved in migration of lung cancer cell lines, between H1975 cells primed either with HD or M1 RBCs (FDR < 0.05, Fold-change > 2). (F) Barplots representing the quantification of western blots for the proteins Cofilin, p-Cofilin, VASP, Arp2, FSCN1, Cortactin and Gelsoline in H1975 primed with RBCs from HD or metastatic patients as well as non-primed cells (Ctrl) (n = 3–4 per group). (G) Representative images of H1975 cells and MDA-MB-231 cells, stained for the protein VASP after priming with RBCs. The white arrows indicate the accumulation of VASP on the cellular protrusions (left panel). Quantification of the ratio of VASP-fluorescence intensity in protrusions/cytoplasm on H1975 and MDA-MB-231 cells stained with VASP after being primed with RBCs from HD or metastatic RBCs, as well as non-primed cells (n = 30 cells quantified/group, n = 3) (right panel). * P < 0.05, ** P < 0.01, *** P < 0.001
Fig. 5
Fig. 5
RBC interaction with CTCs. (A) Boxplot showing the association between RDW status and CTC count, determined by CellSearch® from 7.5 mL blood of metastatic breast cancer patients (n= 55). (B) Kaplan–Meier plots of PFS and OS for high (black) or low (grey) RDW values (cut-off = 14.5) in breast cancer patients (median PFS: 6.38 vs 10.29 months, P = 0.04; median OS: 22.9 vs 27.8 months, P = 0.04) (C) Kaplan–Meier plots of PFS and OS for patients with combined high RDW and ≥ 1 CTC (RDW HIGH_CTC+, black) or not (grey) (RDW cut-off = 14.5) (median PFS: 5.56 vs 10.01 months, P = 0.022; median OS: 21.8 vs 27.8 months, P = 0.017) (D) Kaplan–Meier plots of PFS and OS for breast cancer patients with a combination of high RDW and ≥ 5 CTC (RDW HIGH_≥ 5 CTC, black) or not (grey) (RDW cut-off = 14.5) (median PFS: 9.73 vs 5.08 months, P = 0.017; median OS: 29.1 vs 14.9 months, P = 0.0047) (E) Kaplan–Meier plot of OS for high (black) or low (grey) RDW values (cut-off = 14.5) in NSCLC patients (median OS: 5.7 vs 15 months, P = 0.028) (F) Kaplan–Meier plot of OS for NSCLC patients with a combination of high RDW and ≥ 5 CTC (RDW HIGH_≥ 5 CTC, black) or not (grey) (RDW cut-off = 14.5) (median OS: 3.65 vs 10.81 months, P = 0.00009) (G) Representative bright field microscope images of CTCs from a metastatic breast cancer patient in ex vivo culture, with attached RBCs. (H) Representative confocal microscopy images of immunofluorescence characterization of CTCs from a metastatic breast cancer patient after 10 days of culture. Staining used anti-human epithelial markers (EpCAM, E-cadherin, PanCK, green), anti-CD45 (red), and DAPI (blue). RBCs attached to CTCs are indicated with orange arrows. *P < 0.05

References

    1. Mani K, Deng D, Lin C, Wang M, Hsu ML, Zaorsky NG. Causes of death among people living with metastatic cancer. Nat Commun. 2024;15(1):1519. - PMC - PubMed
    1. Pereira-Veiga T, Schneegans S, Pantel K, Wikman H. Circulating tumor cell-blood cell crosstalk: biology and clinical relevance. Cell Rep. 2022;40(9):111298. - PubMed
    1. Lam LKM, Murphy S, Kokkinaki D, Venosa A, Sherrill-Mix S, Casu C, et al. DNA binding to TLR9 expressed by red blood cells promotes innate immune activation and anemia. Sci Transl Med. 2021;13(616):eabj1008. - PMC - PubMed
    1. Kontidou E, Collado A, Pernow J, Zhou Z. Erythrocyte-Derived MicroRNAs: emerging players in cardiovascular and metabolic disease. Arterioscler Thromb Vasc Biol. 2023;43(5):628–36. - PubMed
    1. Wojsiat J, Laskowska-Kaszub K, Mietelska-Porowska A, Wojda U. Search for Alzheimer’s disease biomarkers in blood cells: hypotheses-driven approach. Biomark Med. 2017;11(10):917–31. - PubMed

MeSH terms

Substances