. 2025 Apr 29;20(1):58.
doi: 10.1186/s13062-025-00649-4.

Identification of M2 macrophage-related genes associated with diffuse large B-cell lymphoma via bioinformatics and machine learning approaches

Affiliations

Identification of M2 macrophage-related genes associated with diffuse large B-cell lymphoma via bioinformatics and machine learning approaches

Jiayi Zhang et al. Biol Direct. .

Abstract

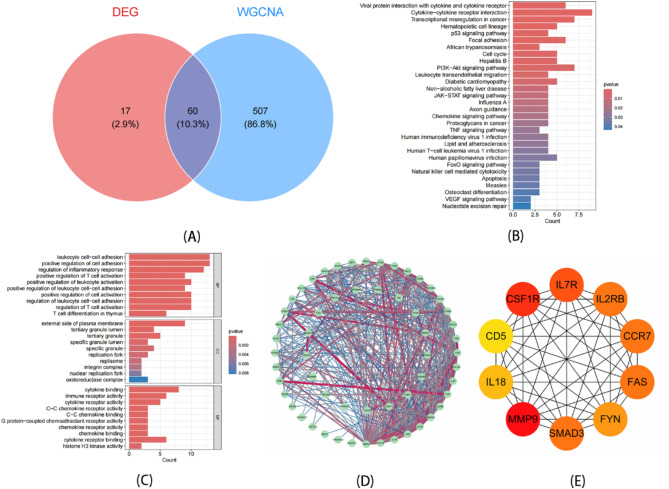
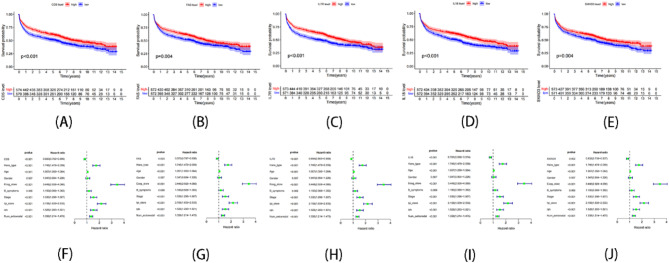
M2 macrophages play a crucial role in the initiation and progression of various tumors, including diffuse large B-cell lymphoma (DLBCL). However, the characterization of M2 macrophage-related genes in DLBCL remains incomplete. In this study, we downloaded DLBCL-related datasets from the Gene Expression Omnibus (GEO) database and identified 77 differentially expressed genes (DEGs) between the control group and the treat group. We assessed the immune cell infiltration using CIBERSORT analysis and identified modules associated with M2 macrophages through weighted gene co-expression network analysis (WGCNA). Using the Least Absolute Shrinkage and Selection Operator (LASSO), Support Vector Machine Recursive Feature Elimination (SVM-RFE), and Random Forest (RF) algorithms, we screened for seven potential diagnostic biomarkers with strong diagnostic capabilities: SMAD3, IL7R, IL18, FAS, CD5, CCR7, and CSF1R. Subsequently, the constructed logistic regression model and nomogram demonstrated robust predictive performance. We further investigated the expression levels, prognostic values, and biological functions of these biomarkers. The results showed that SMAD3, IL7R, IL18, FAS and CD5 were associated with the survival of DLBCL patients and could be used as markers to predict the prognosis of DLBCL. Our study introduces a novel diagnostic strategy and provides new insights into the potential mechanisms underlying DLBCL. However, further validation of the practical value of these genes in DLBCL diagnosis is warranted before clinical application.

Keywords: Bioinformatics; Diffuse large B-cell lymphoma; Immune infiltration; M2 macrophages.


Conflict of interest statement

Declarations. Competing interests: The authors declare no competing interests.

Figures

Fig. 1
Fig. 1
Principal component analysis (PCA) showing patterns of gene expression across datasets and differential gene expression analysis. (A) The distribution of the four datasets before batch effect was removed. (B) Removed all confounding factors from the corrected samples. (C) A heatmap illustrating the expression patterns of DEGs across the samples. (D) Volcanic plots for differentially expressed genes. Red and blue dots denote significantly upregulated and downregulated genes, respectively, while black dots indicate non-significant genes
Fig. 2
Fig. 2
Immune Infiltration Analysis. (A) The bar chart displays immune cell infiltration results of 22 immune cells in two groups. (B) The group comparison chart illustrates differences in the abundance of immune cell infiltration in two groups. (C) The correlation matrix of immune cell proportions
Fig. 3
Fig. 3
Identification of related modules. (A) Scale Independence and average connectivity in integrated dataset. (B) Cluster dendrogram in integrated dataset. (C) Heatmap of correlation between modules and important immune cells in integrated dataset. (D)Scatter plot showing the relationship between the associated genes of M2 macrophages and the module members of MEturquoise
Fig. 4
Fig. 4
Identification of ten hub genes. (A) Wayne diagram showing the 60 potential genes shared by DEGs and MEturquoise modules. (B) Barplot chart of GO analyses of potential genes. (C) Barplot chart of KEGG analyses of potential genes. (D) Cytoscape visualization showing the network diagram of protein-protein interactions. (E) Network diagram of hub gene junctions generated by cytoHubba plugin
Fig. 5
Fig. 5
Identification of diagnostic genes. (A and B) The LASSO logistic regression algorithm was utilized, with penalty parameter tuning performed through 10-fold cross-validation, leading to the selection of 9 genes associated with DLBCL characteristics. (C and D) The SVW-RFE algorithm was applied to determine the optimal combination of feature genes and ultimately identifying 10 genes (maximum accuracy = 0.871, minimum RMSE = 0.129) as the optimal feature set. (E and F) The RF algorithm determined 8 genes as the best feature genes
Fig. 6
Fig. 6
Expression of the 7 signature genes in DLBCL dataset. (A) Wayne diagram showing the 7 signature genes shared by LASSO、SVW-RFE and RF. (B) Chromosome location map of the 7 signature genes. (C) The expression levels of the 7 signature genes in control and treat samples
Fig. 7
Fig. 7
Logistic regression model and nomogram model of DLBCL patients were constructed based on 7 signature genes. (A) The AUC of the logistic regression model for identifying DLBCL samples is shown. (B) The ROC curves for the 7 signature genes are displayed. (C) A nomogram model combined with based on 7 signature genes was constructed to predict the risk of DLBCL patients. (D) The calibration curve of the nomogram tests the predictive performance of the model
Fig. 8
Fig. 8
Survival analysis and independent prognostic analysis for individual genes: Kaplan-Meier curve of CD5 (A), FAS (B), IL7R (C) IL18(D) and SMAD3 (E). The univariate Cox regression analyses of CD5 (F), FAS (G), IL7R (H), IL18(I) and SMAD3 (J)
Fig. 9
Fig. 9
The relative pathways between M2 macrophage infiltration and DLBCL. (A) The pathways enriched in the high-expression group of M2 macrophages. (B) The pathways enriched in the low-expression group of M2 macrophages. (C) The results of GSVA

References

    1. Shao R, Liu C, Xue R, Deng X, Liu L, Song C, et al. Tumor-derived Exosomal ENO2 modulates polarization of Tumor-associated macrophages through reprogramming Glycolysis to promote progression of diffuse large B-cell lymphoma. Int J Biol Sci. 2024;20(3):848–863. - PMC - PubMed
    1. Jia Z, Zhang J, Li Z, Ai L. Identification of ferroptosis-related genes associated with diffuse large B-cell lymphoma via bioinformatics and machine learning approaches. Int J Biol Macromol. 2024;282. - PubMed
    1. Feugier P, Van Hoof A, Sebban C, Solal-Celigny P, Bouabdallah R, Fermé C, et al. Long-Term results of the R-CHOP study in the treatment of elderly patients with diffuse large B-Cell lymphoma: A study by the groupe d’etude des lymphomes de L’Adulte. J Clin Oncol. 2005;23(18):4117–4126. - PubMed
    1. Pfreundschuh M, Trümper L, Österborg A, Pettengell R, Trneny M, Imrie K, et al. CHOP-like chemotherapy plus rituximab versus CHOP-like chemotherapy alone in young patients with good-prognosis diffuse large-B-cell lymphoma: a randomised controlled trial by the MabThera international trial (MInT) group. Lancet Oncol. 2006;7(5):379–391. - PubMed
    1. Pfreundschuh M, Schubert J, Ziepert M, Schmits R, Mohren M, Lengfelder E, et al. Six versus eight cycles of bi-weekly CHOP-14 with or without rituximab in elderly patients with aggressive CD20 + B-cell lymphomas: a randomised controlled trial (RICOVER-60). Lancet Oncol. 2008;9(2):105–116. - PubMed

MeSH terms

Substances

LinkOut - more resources