. 2025 Jun;246(6):2506-2521.
doi: 10.1111/nph.70143. Epub 2025 Apr 29.

Strong scale-dependent relationships between fine-root function and soil properties uncovered with spatially coupled sampling

Affiliations

Strong scale-dependent relationships between fine-root function and soil properties uncovered with spatially coupled sampling

Caroline Dallstream et al. New Phytol. 2025 Jun.

Abstract

Substantial fine-root trait variation is found at fine spatial scales but rarely linked to edaphic variation. We assessed the spatial scales of variation in fine-root traits and adjacent soils using a spatially coupled, nested sampling scheme along a fertility gradient in a seasonally dry tropical forest tree, Handroanthus ochraceus. We examined relationships among fine-root traits and identified edaphic drivers of fine-root function. We collected fine-root samples at three scales: multiple samples within individual trees (separated by > 1 m), among trees in a site (3-60 m) and across three sites (15-60 km). We quantified physiological, symbiotic, morphological, chemical and architectural traits, and paired soil physical and chemical properties. Fine-root traits and soils often varied most at fine spatial scales. Root arbuscular mycorrhizal colonization and phosphomonoesterase activity were coordinated and driven by coarse-scale heterogeneity in bulk density, magnesium and phosphate. The trade-off between large diameter and high specific root length, respiration rate and nitrogen concentration was driven by fine-scale heterogeneity in ammonium. The role of base cations was notable, with nitrogen and phosphorus being less influential than expected. Intraspecific fine-root responses to edaphic properties can occur at multiple spatial scales simultaneously and be detected when variation in both is properly captured and spatially matched.

Se observa una variación sustancial en los rasgos de las raíces finas a escalas espaciales reducidas, aunque rara vez esta se asocia con propiedades edáficas. Evaluamos las escalas espaciales de variación en los rasgos de las raíces finas y en los suelos adyacentes mediante un diseño de muestreo anidado y espacialmente acoplado, a lo largo de un gradiente de fertilidad en un árbol de bosques tropicales estacionalmente secos, Handroanthus ochraceus. Analizamos las relaciones entre los rasgos de las raíces finas e identificamos los factores edáficos que impulsan su funcionamiento. Se recolectaron muestras de raíces finas en tres escalas: múltiples muestras dentro de árboles individuales (separadas por >1 m), entre árboles dentro de un mismo sitio (3–60 m) y entre tres sitios diferentes (15–60 km). Se cuantificaron rasgos fisiológicos, simbióticos, morfológicos, químicos y arquitectónicos, junto con propiedades físicas y químicas del suelo emparejadas. Los rasgos de las raíces finas y las propiedades del suelo variaron con mayor frecuencia a escalas espaciales finas. La colonización micorrícica arbuscular de las raíces y la actividad fosfomonoesterasa estuvieron coordinadas y fueron impulsadas por la heterogeneidad a gran escala de la densidad aparente, el magnesio y el fosfato. A escala fina, el intercambio entre un mayor diámetro radicular y una elevada longitud específica de raíz, junto con la tasa de respiración y la concentración de nitrógeno, estuvo influenciado por la heterogeneidad del amonio. El papel de los cationes base fue destacado, mientras que el nitrógeno y el fósforo resultaron ser menos influyentes de lo esperado. Las respuestas intraespecíficas de las raíces finas a las propiedades edáficas pueden ocurrir simultáneamente en múltiples escalas espaciales, y ser detectadas cuando la variación en ambas dimensiones se captura adecuadamente y se empareja espacialmente.

Keywords: arbuscular mycorrhiza; magnesium; phosphatase; plant–soil interactions; root physiology; root traits; tree; tropics.


Conflict of interest statement

None declared.

Figures

Fig. 1
Fig. 1
Conceptual representation of heterogeneity in a soil property that extensive root systems could encounter. Soil properties can be relatively homogeneous, or heterogeneity can be patterned as gradients, patches or combinations of both (shown here) at various spatial scales. Colors represent the relative values of a single soil resource or physical characteristic from low (light) to high (dark).
Fig. 2
Fig. 2
Representation of the nested sampling scheme employed: the three sites were distributed along a gradient of nutrient availability shown by principal component analysis of soil variables (Fig. 5a), and 10 trees of Handroanthus ochraceus were sampled per site, with three fine‐root samples per tree (n = 30 trees, n = 90 fine roots). Fine‐root sample sizes are indicated, as are the distances between sites, trees and fine roots. The color of text corresponds to fine‐root and soil sampling scales (i.e. soils were collected adjacent to fine‐root samples but pooled to the tree level for analyses; n = 30 soil samples).
Fig. 3
Fig. 3
Proportion of total variance explained by each nested sampling scale for raw soil variables (a, n = 30) and fine‐root traits of Handroanthus ochraceus (b, n = 90). Soil variables and fine‐root traits are arranged by descending order of coefficients of variation (CV%) written above each column. The lowest sampling scale includes sampling error. The white dashed lines represents half of the total variance for soils and thirds of the total variance for fine roots. AM%, root arbuscular mycorrhizal colonization intensity; Bulk, soil bulk density; Ca, soil calcium cations; D, root diameter; GWC, soil gravimetric water content; K, soil potassium cations; Mg, soil magnesium cations; N%, root N concentration; N%, soil total N; NH4, soil ammonium‐N; NO3, soil nitrate‐N; PME, root potential acid phosphomonoesterase activity rate; PO4, soil orthophosphate‐P; RBI, root branching intensity; RESP, root respiration rate; RTD, root tissue density; SRL, specific root length.
Fig. 4
Fig. 4
Variation in fine‐root traits across spatial scales for Handroanthus ochraceus. Within sites, line segments represent the range of trait values (n = 3) for each tree (n = 10) arranged by minimum trait value within sites (n = 3). Site mean trait values (± SD) are represented by colored shapes at the bottom of each plot. Plots are arranged from left to right, top to bottom, by descending order of coefficients of variation. AM%, root arbuscular mycorrhizal colonization intensity; D, root diameter; N%, root N concentration; PME, root potential acid phosphomonoesterase activity rate; RBI, root branching intensity; RESP, root respiration rate; RTD, root tissue density; SRL, specific root length.
Fig. 5
Fig. 5
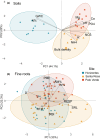
Principal coordinate analyses of soil variables (n = 30) and fine‐root traits of Handroanthus ochraceus (n = 90). Shaded ellipses represent 95% confidence intervals. (a) Soils were primarily distinguished by Ca, NO3, PO4, N% and GWC (PC1, 44%); secondarily distinguished by bulk density and GWC (PC2, 22%); and tertiarily distinguished by Mg, NH4, pH and K (11.2%, not shown). Ca, soil calcium cations; GWC, soil gravimetric water content; K, soil potassium cations; Mg, soil magnesium cations; N%, soil total N; NH4, soil ammonium‐N; NO3, soil nitrate‐N; PO4, soil orthophosphate‐P. (b) Fine roots were primarily distinguished by SRL, RESP, D (PC1, 33%); secondarily distinguished by PME, AM%, N%, RBI (PC2, 22%); and tertiarily distinguished by RTD and RBI (19%, not shown). AM%, root arbuscular mycorrhizal colonization intensity; D, root diameter; N%, root N concentration; PME, root potential acid phosphomonoesterase activity rate; RBI, root branching intensity; RESP, root respiration rate; RTD, root tissue density; SRL, specific root length.
Fig. 6
Fig. 6
Intrinsic relationships between fine‐root (a) specific root length and respiration rate, (b) tissue density and branching intensity, (c) arbuscular mycorrhizal colonization and phosphomonoesterase activity and (d) root nitrogen concentration and arbuscular mycorrhizal colonization for Handroanthus ochraceus with fitted linear models in black and 95% confidence intervals in gray (n = 30). Only significant relationships based on ANOVA tests with a Bonferroni‐corrected significance threshold are shown (P < 0.00625). AM%, root arbuscular mycorrhizal colonization intensity; N%, root N concentration; PME, root potential acid phosphomonoesterase activity rate; RBI, root branching intensity; RTD, root tissue density.
Fig. 7
Fig. 7
Redundancy analysis showing all significant edaphic influences on fine‐root traits of Handroanthus ochraceus, averaged to the tree level and colored by site (scaling = 2, n = 30). The first axis of the redundancy analysis (RDA1) shows that AM% and PME positively respond to soil Mg and PO4 and negatively respond to bulk density (P < 0.05). To a lesser degree, RDA2 shows that D positively responds to soil NH4, whereas SRL, RESP and N% respond negatively (P < 0.05). RTD and RBI were not included. AM%, root arbuscular mycorrhizal colonization intensity; D, root diameter; Mg, soil magnesium cations; N%, root N concentration; NH4, soil ammonium‐N; PME, root potential acid phosphomonoesterase activity rate; PO4, soil orthophosphate‐P; RBI, root branching intensity; RESP, root respiration rate; RTD, root tissue density; SRL, specific root length.
Fig. 8
Fig. 8
Significant relationships between individual fine‐root traits of Handroanthus ochraceus and soil drivers with fitted linear models in black and 95% confidence intervals in gray (n = 30): (a) soil bulk density and root phosphomonoesterase activity rate, (b) soil magnesium cation concentration and root arbuscular mycorrhizal colonization, (c) soil calcium cation concentration and root nitrogen concentration. Only significant relationships based on ANOVA tests with a Bonferroni‐corrected significance level are shown (P < 0.005). AM%, root arbuscular mycorrhizal colonization intensity; Ca, soil calcium cations; Mg, soil magnesium cations; N%, root N concentration; PME, root potential acid phosphomonoesterase activity rate.

References

    1. Akana PR, Mifsud IEJ, Menge DNL. 2023. Soil nitrogen availability in a temperate forest exhibits large variability at sub‐tree spatial scales. Biogeochemistry 164: 537–553.
    1. Allen K, Fisher JB, Phillips RP, Powers JS, Brzostek ER. 2020. Modeling the carbon cost of plant nitrogen and phosphorus uptake across temperate and tropical forests. Frontiers in Forests and Global Change 3: 43.
    1. Anderegg LDL. 2023. Why can't we predict traits from the environment? New Phytologist 237: 1998–2004. - PubMed
    1. Anderegg LDL, Berner LT, Badgley G, Sethi ML, Law BE, HilleRisLambers J. 2018. Within‐species patterns challenge our understanding of the leaf economics spectrum. Ecology Letters 21: 734–744. - PubMed
    1. Ardestani NK, Zare‐Maivan H, Ghanati F. 2011. Effect of different concentrations of potassium and magnesium on mycorrhizal colonization of maize in pot culture. African Journal of Biotechnology 10: 16548–16550.

LinkOut - more resources