Review
. 2024 Jun 8:2024:7679727.
doi: 10.1155/2024/7679727. eCollection 2024.

Analytic Approaches in Genomic Epidemiological Studies of Parasitic Protozoa

Affiliations
Review

Analytic Approaches in Genomic Epidemiological Studies of Parasitic Protozoa

Tianpeng Wang et al. Transbound Emerg Dis. .

Abstract

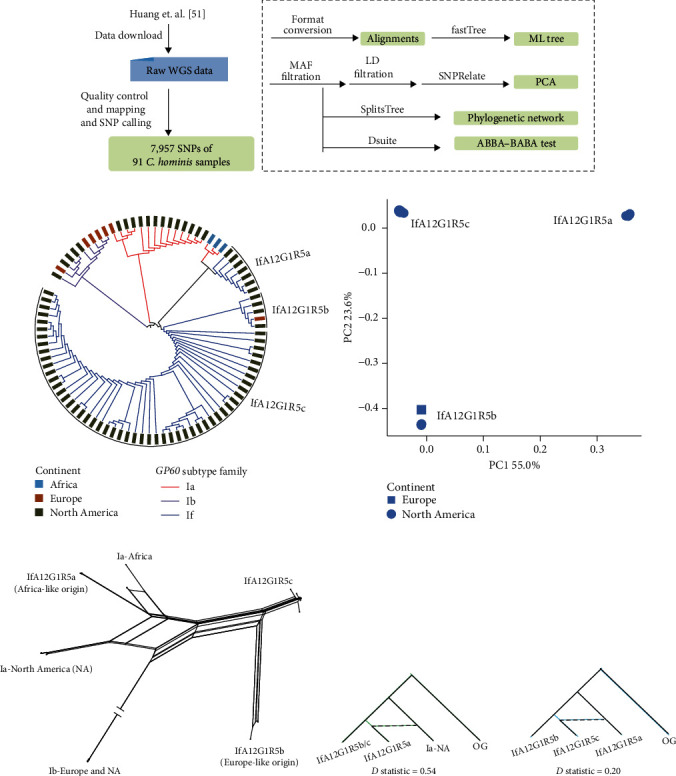
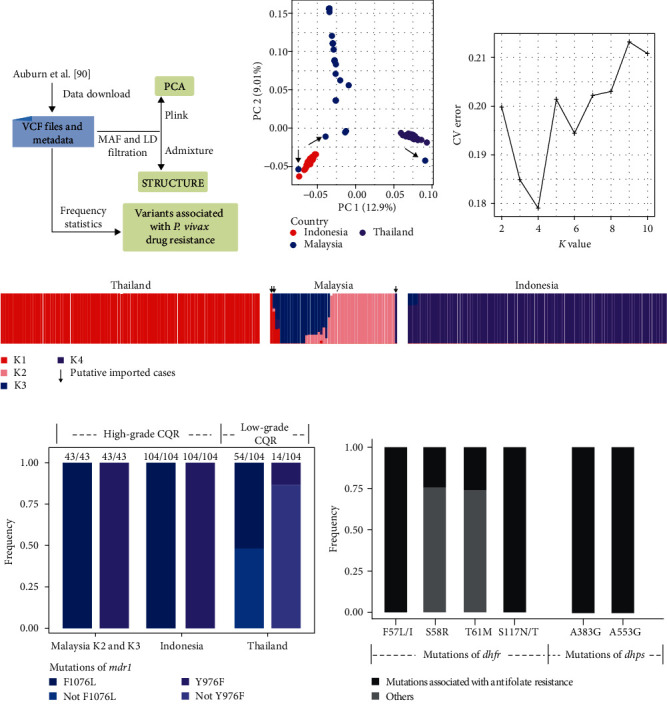
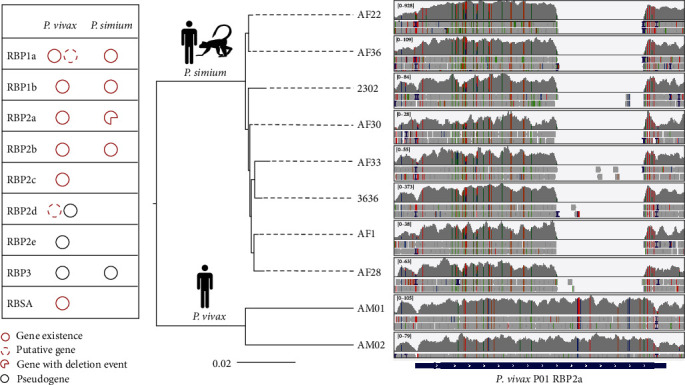
Whole genome sequencing (WGS) plays an important role in the advanced characterization of pathogen transmission and is widely used in studies of major bacterial and viral diseases. Although protozoan parasites cause serious diseases in humans and animals, WGS data on them are relatively scarce due to the large genomes and lack of cultivation techniques for some. In this review, we have illustrated bioinformatic analyses of WGS data and their applications in studies of the genomic epidemiology of apicomplexan parasites. WGS has been used in outbreak detection and investigation, studies of pathogen transmission and evolution, and drug resistance surveillance and tracking. However, comparative analysis of parasite WGS data is still in its infancy, and available WGS data are mainly from a few genera of major public health importance, such as Plasmodium, Toxoplasma, and Cryptosporidium. In addition, the utility of third-generation sequencing technology for complete genome assembly at the chromosome level, studies of the biological significance of structural genomic variation, and molecular surveillance of pathogens has not been fully exploited. These issues require large-scale WGS of various protozoan parasites of public health and veterinary importance using both second- and third-generation sequencing technologies.


Conflict of interest statement

The authors declare that they have no conflicts of interest.

Figures

Figure 1
Figure 1
Phylogenic relationship and genome statistics of major apicomplexan species. Reference genomes of 10 apicomplexan genera were downloaded from NCBI. The rooted maximum likelihood (ML) tree was constructed with 288 single-copy genes, with Leishmania major as the outgroup (not shown). Single copy genes were extracted using Orthofinder v2.5.4 [18]. The ML tree was constructed with IQ-TREE v2.1.2 [19] with a bootstrap value 1,000 and the substitution model automatically selected with ModelFinder Plus (MFP). The number at each tip represents the number of published genomes, with number of reference genomes in parentheses. Genome statistics were mainly referred to NCBI datasets (https://www.ncbi.nlm.nih.gov/datasets/, accessed on May 3, 2023). However, the numbers of chromosomes in Toxoplasma gondii and Neospora caninum have been updated according to recent genomic studies [5, 20]. N.A., no information available. There is no such organelle in Cryptosporidium. aNamasivayam et al. [21]; bBerná et al. [20]; and cBlazejewski et al. [22].
Figure 2
Figure 2
Plasmodium vivax outbreak investigation on the China–Myanmar border (CMB) by analysis of whole genome sequencing (WGS) data. (a) Schematic illustration of analysis of P. vivax WGS data for outbreak detection. Briefly, raw WGS data from CMB samples were downloaded from NCBI for the identification of SNPs. Whole-gneome variations in samples from other Asian countries were obtained from MalariaGEN (https://www.malariagen.net/). The variants are stored in a standardized textual Variant Call Format (VCF) file. The two SNP datasets were then merged. Biallelic SNPs with Phred quality score (QUAL) and mapping depth greater than 30, read depth greater than 3, and missing rate less than 5% were used for further analysis. (b) Maximum likelihood (ML) tree of P. vivax. SNPs were concatenated into alignments for tree building using FastTreeMP v2.11.1 [47]. (c) Identity-by-descent (IBD) network of P. vivax. The VCF file above was converted into a genotype matrix, and IBD was calculated using hmmIBD v2.0.4 [48]. Each node in the network represents a sample, and an edge is drawn between two genomes that share more than 90% of IBD. Branches (b) or shapes (c) in different colors correspond to sample sources, including CMB, Eastern Southeast Asia (ESEA), the Maritime Southeast Asia (MSEA), Western Asia (WSA), and Western Southeast Asia (WSEA). Based on data and analytical approaches of Brashear et al. [44] and the P. vivax Genome Variation Project (Pv4 dataset) [45].
Figure 3
Figure 3
Population structure analysis of whole genome sequencing (WGS) data from Plasmodium falciparum. (a) Schematic illustration of population structure analysis of WGS data from P. falciparum. Whole-gneome variations of representative samples were obtained from P. falciparum Community Project (Pf6) of MalariaGEN (https://www.malariagen.net/). They were filtered according to the quality control annotated in the metadata file and README statement. In addition, biallelic SNPs in coding regions with QUAL and mapping depth greater than 30, depth greater than 3, and missing rate less than 5% were used for further analysis. (b) Maximum likelihood tree of P. falciparum. SNPs were concatenated into alignments for tree construction using FastTreeMP v2.11.1 [47]. Samples were colored according to genographic regions, including West Africa (WAF), Central Africa (CAF), East Africa (EAF), South America (SAM), Oceania (OCE), South Asia (SAS), West Southeast Asia (WSEA), and East Southeast Asia (ESEA). (c) Principal component analysis (PCA) of 14,063 unlinked SNPs. Each dot represents a strain and the color corresponds to (b). The PCA analysis was performed with SNPRelate [105]. (d) Population sturcture of P. falciparum revealed by analysis of the SNP data with fastStructure [106] at K values of 2–4. The proportion of colored regions in each bar indicates the corresponding ancestral components. Based on data and analytical approaches of the published P. falciparum Community Project (Pf6) [58].
Figure 4
Figure 4
Detection of recombination events among different C. parvum subtypes. (a) Schematic illustration of WGS analysis to detect recombination events in C. parvum using a published dataset. Raw WGS data were downloaded from NCBI and SNPs were identified as described in Figure 2. (b) Neighbor-joining phylogenetic network was constructed with SplitsTree v4 [107]. Branches were colored according to the gp60 subtype family, including the anthroponotic IIc and the zoonotic IIa and IId subtype families. (c) Pairwise sequence similarity between three C. parvum genomes. Analysis of recombination event of the possible progeny UKP16 and two potential parents UKP15 and UKP8 were performed using HybridCheck [108]. Two recombination events located on chromosomes 1 and 6 are depicted with dashed black frames. Based on data and analytical approaches of Nader et al. [53] and Troell et al. [66].
Figure 5
Figure 5
Origin and dispersal of an emerging C. hominis subtype. (a) Schematic illustration of the WGS analysis to investigate the origin and dispersal of a novel hypertransmissible C. hominis subtype (IfA12G1R5). Raw WGS data of 91 C. hominis samples were downloaded from NCBI. Reads were processed and whole genome variations were identified as described by Huang et al. [52]. (b) Maximum likelihood tree of C. hominis. SNPs were concatenated into alignments for tree building using FastTreeMP v2.11.1 [47]. The color of each bar corresponds to the source of each genome and the color of each branch corresponds to the gp60 subtype family of each genome. (c) Principle component analysis (PCA) of 1,088 unlinked SNPs from the IfA12G1R5 subtype. Squares represent samples collected from Europe and dots represent genomes from North America. The PCA analysis was performed with SNPRelate [105]. (d) Phylogenetic network of C. hominis based on analysis of concatenated SNPs. (e) Introgression events between different populations. With the assumed phylogenetic relationship (((P1, P2), P3), OG), D statistics were used to assess the introgression between P2 and P3. A D value greater than 0 indicates the presence of sequence introgression. The D statistics were calculated using Dsuite [109]. Based on data and analytical approaches of Huang et al. [52].
Figure 6
Figure 6
Identification of possible occurrence of drug resistance in Plasmodium vivax in Malaysia. (a) Schematic illustration of WGS analysis for the identification of potential drug resistance in a pre-elimination P. vivax population in Malaysia. Whole-gneome variations from 259 samples were obtained from MalariaGEN (https://www.malariagen.net/) and the VCF file was used in the following analyses. (b) Principal component analysis of P. vivax. Each node represents one genome and is colored according to its source. The analysis was performed with plink v1.9. (c) Cross-validation results of K values of 2–10 using Admixture v1.3 [110]. The cross-validation error is lowest at K = 4. (d) Population structure of P. vivax at K = 4 based on the analysis of the data using Admixture. (e) The frequency of variations potentially associated with P. vivax chloroquine resistance (CQR) in three countries with different grades of CQR. (f) Frequency of other variations associated with P. vivax resistance to antifolate in Malaysia. Based on data and analytical approaches of Auburn et al. [86].
Figure 7
Figure 7
Identification of genes associated with host preference in Plasmodium simium by comparative genomic analysis. (a) Comparison of the reticulocyte-binding protein (RBP) family between P. simium and Plasmodium vivax. Each circle represents the existance of RBPs. Dashed and black circles represent putative gene and pseudogene, repectively. A broken circle represents gene with a deletion event. (b) Read mapping results of RBP2a. The tree on the left was constructed using whole genome SNPs from eight P. simium samples and two P. vivax samples. The cartoons at each node indicate the host of parasites in the clade. Read mapping results are viewed with IGV (https://www.igv.org/). The analysis was based mainly on data and analytical approaches of Mourier et al. [93].

Similar articles

Cited by

References

    1. Armstrong G. L., MacCannell D. R., Taylor J., et al. Pathogen genomics in public health. The New England Journal of Medicine . 2019;381(26):2569–2580. doi: 10.1056/NEJMsr1813907. - DOI - PMC - PubMed
    1. Dartois V. A., Rubin E. J. Anti-tuberculosis treatment strategies and drug development: challenges and priorities. Nature Reviews Microbiology . 2022;20(11):685–701. doi: 10.1038/s41579-022-00731-y. - DOI - PMC - PubMed
    1. Dallman T. J., Jalava K., Verlander N. Q., et al. Identification of domestic reservoirs and common exposures in an emerging lineage of Shiga toxin-producing Escherichia coli O157: H7 in England: a genomic epidemiological analysis. Lancet Microbe . 2022;3(8):e606–e615. - PubMed
    1. Wu F., Zhao S., Yu B., et al. A new coronavirus associated with human respiratory disease in China. Nature . 2020;579(7798):265–269. doi: 10.1038/s41586-020-2008-3. - DOI - PMC - PubMed
    1. Xia J., Venkat A., Bainbridge R. E., et al. Third-generation sequencing revises the molecular karyotype for Toxoplasma gondii and identifies emerging copy number variants in sexual recombinants. Genome Research . 2021;31(5):834–851. doi: 10.1101/gr.262816.120. - DOI - PMC - PubMed

MeSH terms

LinkOut - more resources