. 2023 Sep 22:2023:3295812.
doi: 10.1155/2023/3295812. eCollection 2023.

Pancreas Imaging of Children with Type 1 Diabetes Reveals New Patterns and Correlations with Pancreatic Functions

Affiliations

Pancreas Imaging of Children with Type 1 Diabetes Reveals New Patterns and Correlations with Pancreatic Functions

Olivier G Pollé et al. Pediatr Diabetes. .

Abstract

Objective: To perform a longitudinal characterization of the pancreas in patients with new-onset T1D and investigate the correlations between magnetic resonance imaging (MRI) parameters and pancreatic functions during the first year postdiagnosis.

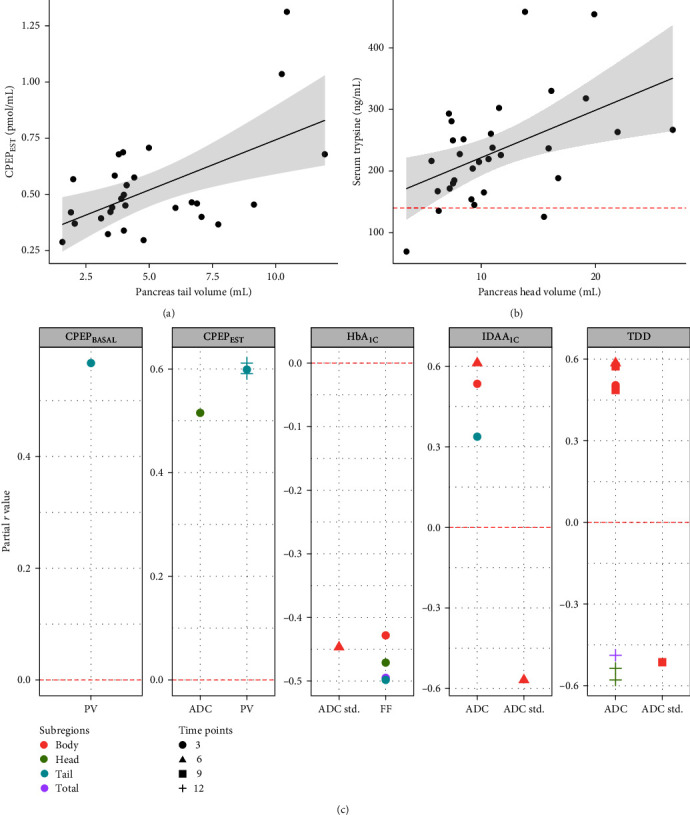
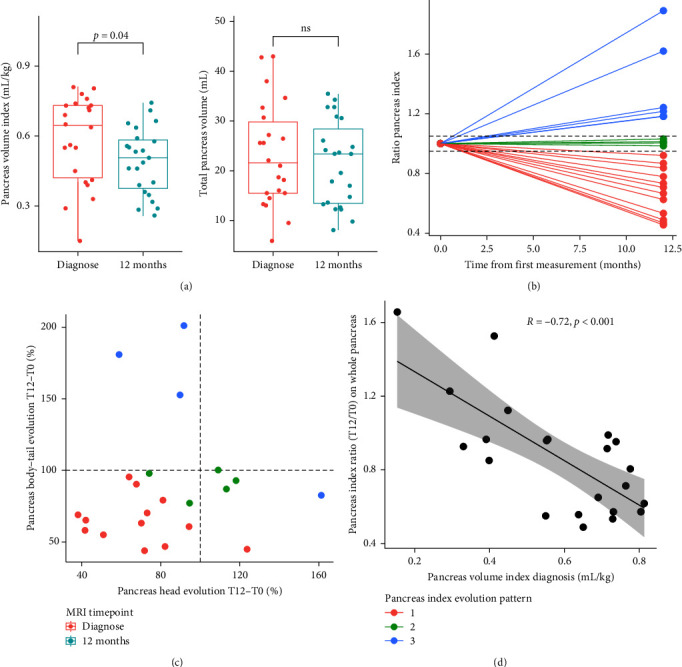
Methods: Thirty-one pediatric patients with new-onset T1D and 29 retrospective age-, body mass index-, and sex-matched controls were included in the study. Following hypotheses were investigated: (H1) the value of pancreas volume (PV) parameters in T1D and in controls, (H2) the association between MRI parameters and markers of pancreatic functions, (H3) the ability of MRI parameters to predict glucose homeostasis, (H4) the longitudinal evolution of MRI parameters and glucose homeostasis, per-organ (whole pancreas) and per-subregion (head, body, and tail).

Results: Patients with new-onset T1D demonstrated a significant decrease of PV at diagnosis compared to controls (-45%), with prepubertal patients having increased pancreas atrophy (+25%) (H1). PV parameters were correlated with C-peptide, and trypsinogen (PVTail and PVHead, respectively). Biparametric regression models including MRI parameters predicted pancreas functions during the first year postdiagnosis (H3). Longitudinal evolution of PV parameters at 1 year postdiagnosis was correlated with PV at diagnosis (R = -0.72) but not with markers of glucose homeostasis (H4).

Conclusion: Our study shows that longitudinal analysis of pancreases of children with T1D using multiparametric MRI improve the understanding of T1D heterogeneity both in the context of its onset and its evolution.


Conflict of interest statement

The authors declare they have no conflicts of interest.

Figures

Figure 1
Figure 1
Flowchart of the DIATAG MRI study. The following hypotheses were investigated in the study. H1: analysis performed on anatomical MRI imaging (PV, PVI, and PVR) according to the disease status, the pancreas subregions and the pubertal status (T0). H2: analysis performed on anatomical, diffusion and FAT MRI (T0). Exocrine (i.e., trypsine) and endocrine (CPEPEST, IDAA1C, HbA1C, and TDD) functions were evaluated around diagnosis. H3: analysis performed on anatomical, diffusion and FAT MRI (T0). Exocrine (i.e., trypsine) and endocrine (CPEPEST, IDAA1C, HbA1C, and TDD) were evaluated at Δ + 3? months, Δ + 6, Δ + 9, and Δ + 12 months. H4: analysis performed on anatomical, diffusion and fat MRI (T12). Exocrine (i.e., trypsine) and endocrine (CPEPEST, IDAA1C, HbA1C, and TDD) were evaluated at Δ + 12 months. Abbreviations: H, hypothesis; MRI, magnetic resonance imaging; PV, pancreatic volume.
Figure 2
Figure 2
Pancreas volume parameters according to age and pubertal status in new-onset T1DM patients and age-, sex-, BMI-matched controls. MRI was performed closed to the diagnosis of T1D. Panels A-B represent pancreas volume (a) and pancreas index (b) in T1DM patients (yellow) and controls (blue). Panel C represents the evolution of pancreas index according to the age of the patient and the disease group (yellow = T1DM, blue = controls). Shaded zone around regression lines represent 95% confidence interval. Panel D represents the influence of pubertal status on pancreas reduction of volume between T1DM (yellow) and controls (blue). Vertical bars represents differences of median between prepubertal (light orange) and pubertal (dark orange) patients. Box plots display the median, 25th and 75th percentiles. The significance level is represented either by numerical values or signs ( =p < 0.05,  ∗∗∗=p < 0.0001). Abbreviations: MRI, magnetic resonance imaging; R, spearman rho; T1DM, Type 1 diabetes mellitus.
Figure 3
Figure 3
Pancreas MRI parameters at diagnosis correlate with residual pancreatic functions and improve prediction models of glucose homeostasis during the first year of T1D. Statistically significant topographic correlations between regional pancreatic subvolumes and residual B-cell secretion (calculated as described by Wentworth et al. [33]) (a) and exocrine function (b) with shaded zone around regression lines represent 95% confidence interval. The horizontal dashed red line in panel B represents the lower range of laboratory normality threshold. (c) Graphical representation of partial r values in multiparametric prediction models including MRI parameters (x axis). The horizontal dashed red line corresponds to r = 0. Dots are colored according to pancreatic subregions (PVBody = red, PVHead = green, PVTail = blue, PVTotal = purple) and shaped according to time from diagnosis (Δ + 3 months = round, Δ + 6 months = triangle, Δ + 9 months = square, Δ + 12 months = cross). The significance level is 0.05. Abbreviations: ADC, apparent diffusion coefficient; FF, fat fraction; HbA1C, glycated hemoglobin; CPEPEST, estimated C-peptide; CPEPBASAL, fasting C-peptide; IDAA1C, insulin dose-adjusted A1C; PV, pancreas volume; R, spearman rho; ADC std., standard deviation of ADC; T1D, type 1 diabetes; TDD, total insulin daily dose.
Figure 4
Figure 4
Morphological evolution of pancreas during the first year after T1D onset. (a) Differences in pancreas index (left panel) and pancreas volume (right panel) in T1D patients. (b) Visualization of relative evolution of PVI during the first year of T1D (PVIT12/PVIT0) with PVIT12 being normalized at Δ + 12 months considering a linear evolution. Horizontal dashed lines represent pancreas index ratio values of 1.05 (upper) and 0.95 (lower) delineating PVI evolution pattern (i.e., increasing (blue dots), stabilizing (green dots) or decreasing (red dots)). (c) Topographic visualization of pancreas volume evolution according to body–tail (y axis) and head (x axis) subregions. Colors of the dots represent the PVI evolution pattern (i.e., PVIT12/PVIT0). Dashed lines represent a ratio of 100% (i.e., no change) with value below demonstrating a decrease of PV during the first year of T1D. (d) Linear regression with 95% CI bands (shaded zone) between PVI at diagnosis and PVI ratio (T12/T0). R represent the regression coefficient of Spearman. Significance level was p value < 0.05 for all analysis. Abbreviations: CI, confidence interval; PVI, pancreas index; T1D, type 1 diabetes.

References

    1. Mallone R., Eizirik D. L. Presumption of innocence for beta cells: why are they vulnerable autoimmune targets in type 1 diabetes? Diabetologia . 2020;63:1999–2006. doi: 10.1007/s00125-020-05176-7. - DOI - PubMed
    1. Battaglia M., Ahmed S., Anderson M. S., et al. Introducing the endotype concept to address the challenge of disease heterogeneity in type 1 diabetes. Diabetes Care . 2020;43(1):5–12. doi: 10.2337/dc19-0880. - DOI - PMC - PubMed
    1. Jacobsen L. M., Bocchino L., Evans-Molina C., et al. The risk of progression to type 1 diabetes is highly variable in individuals with multiple autoantibodies following screening. Diabetologia . 2020;63:588–596. doi: 10.1007/s00125-019-05047-w. - DOI - PMC - PubMed
    1. Fonolleda M., Murillo M., Vázquez F., Bel J., Vives-Pi M. Remission phase in paediatric type 1 diabetes: new understanding and emerging biomarkers. Hormone Research in Paediatrics . 2017;88(5):307–315. doi: 10.1159/000479030. - DOI - PubMed
    1. Sims E. K., DiMeglio L. A. Cause or effect? A review of clinical data demonstrating beta cell dysfunction prior to the clinical onset of type 1 diabetes. Molecular Metabolism . 2019;27:S129–S138. doi: 10.1016/j.molmet.2019.06.010. - DOI - PMC - PubMed

Publication types

LinkOut - more resources