. 2025 Mar 10;21(6):2396-2414.
doi: 10.7150/ijbs.99275. eCollection 2025.

PPARG Activation of Fatty Acid Metabolism Drives Resistance to Anti-HER2 Therapies in HER2-Positive Breast Cancer

Affiliations

PPARG Activation of Fatty Acid Metabolism Drives Resistance to Anti-HER2 Therapies in HER2-Positive Breast Cancer

Min Xiong et al. Int J Biol Sci. .

Abstract

HER2-positive breast cancer, which accounts for approximately 15-20% of all breast cancers, is characterized by its aggressive recurrence, metastasis and reduced survival. Despite advances in anti-HER2 therapies, many patients continue to face treatment resistance, either initially or after an initial positive response, resulting in relapse or disease progression. The primary focus of this research was to identify the peroxisome proliferator-activated receptor gamma (PPARG) as a contributing factor to decreased drug sensitivity by establishing anti-HER2 drug-resistant cell lines of HER2-positive breast cancer. We found that PPARG promotes fatty acid metabolism and activates the PI3K/Akt/mTOR signaling pathway. Inhibition of fatty acid synthesis (FASN) after overexpression of PPARG, effectively blocking the activation of the PI3K/Akt/mTOR pathway and enhancing cellular anti-HER2 drug sensitivity. Co-administration of the PPARG inhibitor GW9662 has emerged as a promising strategy to augment the efficacy of anti-HER2 therapies, offering potential for clinical applications.

Keywords: Drug sensitivity; GW9662; HER2-positive breast cancer; PPARG.


Conflict of interest statement

Competing Interests: The authors have declared that no competing interest exists.

Figures
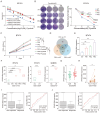
Figure 1
Figure 1
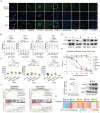
PPARG as a key factor in modulating drug sensitivity in HER2-positive breast cancer. (A) IC50 curves of WT and PR BT474 cells treated with gradient concentrations of pyrotinib; (B) Plate colony formation of WT and PR BT474 cells treated with different concentration pyrotinib; (C) Proliferation curves of WT and PR BT474 cells treated with or without pyrotinib; (D) Venn diagram illustrating elevated gene expression (ratio>2.5) in PR BT474 cells; (E) Expression profile of PPARG in WT and PR BT474 cells; (F) Expression profile of PPARG in BT474 cells from the GSE121105, GSE136304 and GSE52707 dataset; (G) Expression levels of PPARG in tumors of patients with pCR or RD from the GSE50948 dataset; (H) Expression levels of PPARG before and after trastuzumab treatment (paired T-test) from the GSE114082 dataset; Expression levels of PPARG and ROC curve analysis in non-responder and responder groups to (I) anti-HER2 therapy and (J) trastuzumab therapy. WT: Wild Type; PR: Pyrotinib-Resistant; NC: Normal Control; TR: Trastuzumab-Resistant; TPR: Resistant to both Trastuzumab and Pertuzumab; LR: Lapatinib-Resistant; pCR: pathological complete response; RD: residual disease.
Figure 2
Figure 2
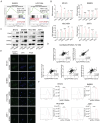
PPARG promotes resistance to targeted therapy in HER2-positive breast cancer. (A) Expression of PPARG at the RNA and protein level in four HER2-positive breast cancer cell lines (SKBR3, BT474, JIMT1, HCC1954 cells); (B) Expression of PPARG at the RNA and protein level in BT474, SKBR3, HCC1954, JIMT1 cells in pCDH and PPARG overexpressing groups; (C) Viability of different concentrations of trastuzumab treatment BT474, SKBR3, HCC1954 cells overexpressing PPARG compared to pCDH groups, (D) Gradient concentrations of pyrotinib treatment BT474, SKBR3, HCC1954, JIMT1 cells overexpressing PPARG compared to pCDH groups were plotted for IC50 curves and IC50 value bar graphs; (E) Gradient concentrations of lapatinib treatment BT474, SKBR3, HCC1954, JIMT1 cells overexpressing PPARG compared to pCDH groups were plotted for IC50 curves and IC50 value bar graphs.
Figure 3
Figure 3
PPARG associated with poorer prognosis in HER2-positive breast cancer. (A) Examples of low and high expression of PPARG in tumor tissues; (B) Kaplan-Meier analysis of the relationship between PPARG expression levels and OS, DFS; (C) Proliferation curves of BT474, SKBR3, HCC1954, JIMT1 cells overexpressing PPARG compared to pCDH groups; (D) Plate colony formation of BT474, SKBR3, HCC1954, JIMT1 cells overexpressing PPARG compared to pCDH groups; (E) Schematic representation, mass box diagram and proliferation curves of in situ tumors in overexpressing PPARG compared to pCDH groups.
Figure 4
Figure 4
Fatty acid metabolism is more active in anti-HER2 resistant HER2-positive breast cancer. (A) Fatty acid distribution in different breast cancer cells (yellow for Luminal type, purple for HER2-positive, and blue for Triple-negative); (B) Expression of ACLY,CPT1A, FASN and SCD in different subtypes of breast cancer in METABRIC database; (C) Expression of ACLY, FASN and SCD in different subtypes of breast cancer in TCGA database; (D) Protein expression of FASN after treatment with C75 in BT474, SKBR3, HCC1954, JIMT1 cells; (E) Viability of different breast cancer cells treated with C75; (F) GSEA analysis of the fatty acid metabolism pathway in the GSE50948 dataset (RD vs pCR) and GSE136304 dataset (LR vs WT); (G) FASN expression in pyrotinib-resistant BT474 cells; (H) Enrichment of fatty acid metabolism pathways in single or dual-target resistant cell lines from the GSE121105 dataset. ACLY: ATP Citrate Lyase; CPT1A: Carnitine Palmitoyltransferase 1A; FASN: Fatty Acid Synthesis; SCD: Stearoyl-CoA Desaturase.
Figure 5
Figure 5
PPARG activates fatty acid metabolic pathways in HER2-positive breast cancer. (A) GSEA enrichment analysis of the fatty acid metabolism pathway with PPARG overexpressed and pCDH groups from SKBR3 and HCC1954 cell lines; (B) Expression levels of ACLY, CD36, CPT1A, FASN, and SCD in BT474, SKBR3, HCC1954, and JIMT1 PPARG-overexpressing cell lines; (C) Western blot of FASN and CD36 in PPARG overexpressing and pCDH group; (D) Correlation analysis of PPARG with ACLY, CD36, CPT1A, FASN, and SCD; (E) Fatty acid distribution in BT474, SKBR3, HCC1954, JIMT1 cells overexpressing PPARG compared to the pCDH groups; (F) Flow cytometry detection of lipid in BT474, SKBR3, HCC1954, JIMT1 cells overexpressing PPARG compared to the pCDH groups; CD36: Fatty Acid Translocase.
Figure 6
Figure 6
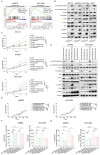
PPARG enables the PI3K/Akt/mTOR signaling pathway by facilitating FASN. (A) GSEA enrichment analysis of the PI3K/Akt/mTOR signaling with PPARG-overexpressed and pCDH groups from SKBR3 and HCC1954 cell lines; (B) Expression levels of PI3K/Akt/mTOR signaling pathway proteins in BT474, SKBR3 HCC1954 and JIMT1 cells PPARG-overexpressing group and pCDH group; (C) Proliferation curves of BT474, SKBR3 and HCC1954 cells PPARG-overexpressing group and pCDH group treated with or without Trastuzumab/ Everolimus; (D)Expression levels of PI3K/Akt/mTOR signaling pathway proteins in SKBR3 and HCC1954 knocking down FASN in PPARG overexpressing cells; (E) Proliferation curves of SKBR3 and HCC1954 knocking down FASN in PPARG overexpressing cells; (F) Viability of SKBR3 and HCC1954 cells treated with trastuzumab; (G) Viability of SKBR3 and HCC1954 cells treated with pyrotinib.
Figure 7
Figure 7
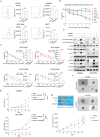
​GW9662 boosts drug sensitivity in HER2-positive breast cancer. (A) Flow cytometry detection of lipid in BT474, SKBR3, HCC1954, JIMT1 cells treated with GW9662; (B) Proliferation curves of different breast cancer cells treated with 10 μM GW9662 (yellow for Luminal type, purple for HER2-positive, and blue for Triple-negative); (C) Gradient concentrations of pyrotinib treatment WT and PR BT474 cells treated with GW9662 were plotted for IC50 curves and IC50 value bar graphs; (D) Expression levels of PI3K/Akt/mTOR signaling pathway proteins in SKBR3 and HCC1954 PPARG-overexpressing cells with or without 10 μM GW9662; (E) Proliferation curves of SKBR3 and HCC1954 PPARG-overexpressing cells with or without 10 μM GW9662; (F) Morphological changes of PDOs with or without GW9662 or with or without trastuzumab/pyrotinib; (G) Schematic representation, and proliferation curves of in situ tumors in Control, P+T, and Combine groups.
Figure 8
Figure 8
13(S)-HODE promotes PPARG expression to promote drug resistance. (A) Volcano plot depicting differential metabolites between the non-pCR group and pCR groups; (B) Box plot illustrating the abundance of 13(S)-HODE and expression of PPARG in the pCR and non-pCR groups; (C) Viability rates of BT474, SKBR3 and HCC1954 cells after trastuzumab treatment with or without 13(S)-HODE; (D) IC50 curves and bar graph illustrating the gradient concentration of pyrotinib treatment in BT474, SKBR3, HCC1954 and JIMT1 cells when treated with or without 13(S)-HODE; (E) IC50 curves and bar graph illustrating the gradient concentration of lapatinib treatment in BT474, SKBR3, HCC1954 and JIMT1 cells when treated with or without 13(S)-HODE; (F) Viability of SKBR3 and HCC1954 NC and KO1 cells treated with or without 13(S)-HODE and trastuzumab; (G) Viability of SKBR3 and HCC1954 NC and KO1 cells treated with or without 13(S)-HODE and pyrotinib; (H) Viability of SKBR3 and HCC1954 NC and KO1 cells treated with or without 13(S)-HODE and lapatinib.
Figure 9
Figure 9
Mechanistic diagram of PPARG-mediated fatty acid metabolism and PI3K/Akt/mTOR signaling pathway in promoting drug resistance in HER2-positive breast cancer.

References

    1. Siegel RL, Giaquinto AN, Jemal A. Cancer statistics, 2024. CA Cancer J Clin. 2024;74(1):12–49. - PubMed
    1. Kreutzfeldt J, Rozeboom B, Dey N, De P. The trastuzumab era: current and upcoming targeted HER2+ breast cancer therapies. Am J Cancer Res. 2020;10(4):1045–67. - PMC - PubMed
    1. Pernas S, Tolaney SM. HER2-positive breast cancer: new therapeutic frontiers and overcoming resistance. Ther Adv Med Oncol. 2019;11:1758835919833519. - PMC - PubMed
    1. Harbeck N, Gnant M. Breast cancer. Lancet. 2017;389(10074):1134–50. - PubMed
    1. Yang M, Li Y, Kong L. et al. Inhibition of DPAGT1 suppresses HER2 shedding and trastuzumab resistance in human breast cancer. J Clin Invest. 2023;133(14):e164428. - PMC - PubMed

MeSH terms