. 2025 Mar 31;21(6):2780-2805.
doi: 10.7150/ijbs.102675. eCollection 2025.

Macrophage KDM2A promotes atherosclerosis via regulating FYN and inducing inflammatory response

Affiliations

Macrophage KDM2A promotes atherosclerosis via regulating FYN and inducing inflammatory response

Yuzhou Xue et al. Int J Biol Sci. .

Abstract

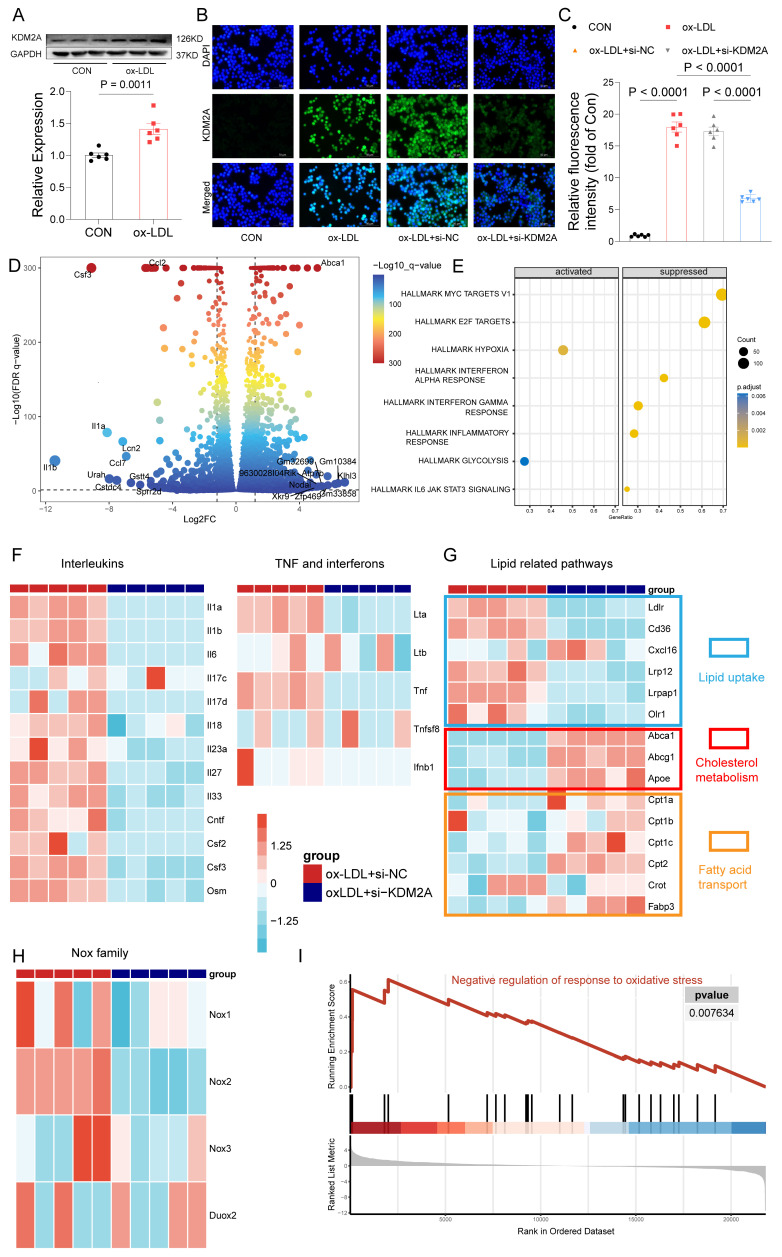
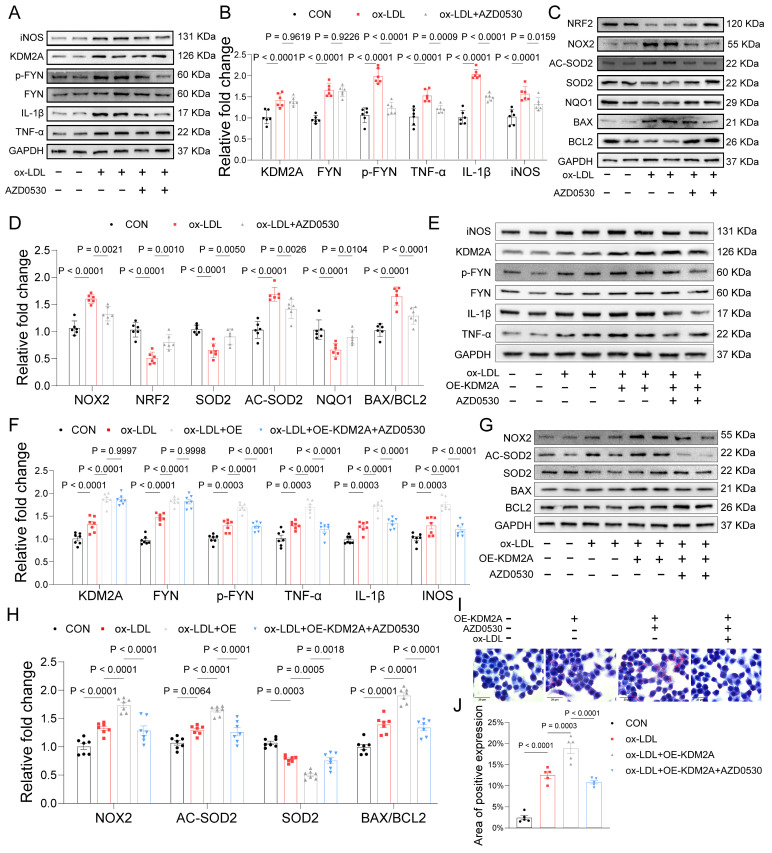
Macrophage inflammatory response is the key driver in atherosclerosis development. However, transcriptional remodeling of macrophage inflammatory response remains largely unknown. In this study, transcriptional regulatory networks were constructed from human plaque microarray datasets. Differential analysis and subsequent machine learning algorithms were used to identify key transcriptional regulons. Multiple immune cell inference methods (including CIBERSORT, ssGSEA, MCP-counter, and xCell), single-cell RNA-seq of human plaques and immunofluorescence of human and mouse plaque samples reveal that the macrophage-specific transcriptional regulator, KDM2A, is critical for inflammatory response. Diagnostic analyses validate KDM2A expression in peripheral monocytes/macrophages is an excellent predictor of atherosclerosis development and progression. RNA-seq of mouse bone marrow-derived macrophages under oxidized low-density lipoprotein stimulation reveal KDM2A knockdown significantly represses pro-inflammatory, oxidative, and lipid uptake pathways. In vitro experiments confirmed KDM2A activates inflammation, oxidative stress and lipid accumulation in macrophages. Mechanistically, FYN was identified as a direct target of KDM2A by chromatin immunoprecipitation followed by sequencing and qPCR analysis. Specific inhibition of FYN restored the inflammatory response, oxidative stress, and intracellular lipid accumulation after transfection with KDM2A overexpression plasmid. Importantly, macrophage-specific knockdown of KDM2A in ApoE-/- mice fed a high-fat diet apparently attenuated plaque progression. Furthermore, the genetic association of KDM2A with atherosclerosis was validated by Mendelian randomization and colocalization analysis. A group of small molecules with the potential to target KDM2A has been identified through virtual screening, offering promising strategies for atherosclerosis treatment. The current study provides the novel role of KDM2A in macrophage inflammatory response of atherosclerosis through transcriptional regulation of FYN.

Keywords: Atherosclerosis; FYN; KDM2A; Metabolism reprograming.; inflammatory response; macrophage; oxidative stress.


Conflict of interest statement

Competing Interests: The authors have declared that no competing interest exists.

Figures

Figure 1
Figure 1
Identification of KDM2A as a key transcriptional regulator (TR) in the development of atherosclerosis. Screening of master regulons by (A) LASSO and (B) SVM-RFE machine learning algorithms. (C) Key regulons were identified as the intersection of these two algorithms. (D) Boxplots show the difference of the three TRs activities (DLX2, HESX1, and KDM2A) between macroscopically intact (n = 32) and atheroma plaque tissue (n=32) groups. (E) Receiving operating curve (ROC) shows the diagnostic efficacy of KDM2A regulon activity in GSE43292. (F) Validations of ROC curves (DLX2, HESX1, and KDM2A) in the combine dataset (n = 235 in total, AS = 195, normal = 40). (G) Linear regression plot of KDM2A expression with coronary artery disease (CAD) class in GSE90074 (n=143) (correlation coefficient = 0.15, P value = 0.046). (H) Receiving operating curve (ROC) shows the diagnostic efficacy of KDM2A regulon activity in GSE90074 (n = 143 in total, non-obstructive = 50 and obstructive = 93). Correlation analysis was examined by Spearman's test. Expressions were presented in boxplots together with the group mean ± SE. For two groups, data were compared by paired t-test test: ****P < 0.0001.
Figure 2
Figure 2
KDM2A is involved in macrophage activation. Functional delineation of KDM2A by (A) gene ontology (GO), (B) Kyoto Encyclopedia of Genes and Genomes (KEGG), and (C) gene set enrichment analysis (GSEA). (D) The differences in the proportions of macrophage subtypes inferred by four algorithms (CIBERSORT, ssGSEA, xCell, and MCP-counter) in GSE43292 (n = 32 per group). (E) Correlation heatmap of three TRs (HESX1, DLX2, and KDM2A) with abundances of 11 macrophage subtypes in plaque samples (n = 32) of GSE43292. (F) Correlation heatmap of KDM2A with proportions of 11 macrophage subtypes in plaque (n = 195) and normal (n = 40) samples in the combine dataset. (G) Representative immunofluorescence staining images for KDM2A and CD68 in carotid arteries from a patient with atherosclerosis. Expressions are presented as box plots showing the group mean ± SE. Data for two groups were compared by paired-t test: **P < 0.01, ***P < 0.001, ****P < 0.0001.
Figure 3
Figure 3
KDM2A participates in the functional state alteration of macrophages. tSNE clustering plots showing (A) 8 cell populations of GSE159677 (a total of 35,021 individual cells), (B) 3 macrophage subtypes, (C) 3 color-coded cell clusters, and (D) different groups (of 6533 individual cells). (E) Violin/box plot of KDM2A activities across different macrophage subtypes. (F) Sankey diagram linking cell types and different Monocle states between atherosclerotic and normal groups. (G) Heatmap showing the expression dynamics of 3 gene clusters with the first branch point determined by BEAM analysis. Kyoto Encyclopedia of Genes and Genomes (KEGG) analyses of gene clusters (H) 2 and (I) 1 belongs to State 2 and 3, respectively. (J) Pseudotime kinetics of KDM2A activity with pseudotime progression (colored by different State). (K) Displayed genes ordered by correlation coefficient with KDM2A activity. Correlation analysis was examined by Spearman's test; for two groups, data were compared by Wilcoxon signed-rank test. Expressions are presented as box plots showing the group mean ± SE.
Figure 4
Figure 4
KDM2A regulates the inflammatory response of macrophages. (A) Western blot assay demonstrates significant expression of KDM2A in bone marrow-derived macrophages (BMDMs) cultured with 20 ug/ml ox-LDL for 24 h. Data were shown as bar plot compared by Mann-Whitney U-test. (B) Immunofluorescence staining reveals alterations in KDM2A expression under siRNA Kdm2a (Si-KDM2A) treatment and quantified by (C) bar plot. Data were compared by one-way ANOVA test. (D) Differentially expressed genes identified between si-KDM2A treatment (n=5) and si-NC (n=5) BMDMs under ox-LDL treatment, represented by color and size dots in a volcano plot. (E) HALLMARK gene set enrichment analysis (GSEA) terms of differentially expressed genes after KDM2A knockdown. Heatmap shows the normalized read counts (log transformed) of genes belonging to (F) cytokines, (G) lipid-related pathways, and (H) Nox family. (I) GSEA plot showing upregulation of negative regulation of response to oxidative stress in si-KDM2A group. Expressions are presented as bar plots showing the group mean ± SEM, with n=6 per group.
Figure 5
Figure 5
In vitro experiments confirm the pro-inflammatory role of KDM2A. (A) Quantification of the number of cells expressing KDM2A co-expressed with CD68 and iNOS within the human carotid samples. (B) Quantification of the number of cells expressing KDM2A co-expressed with CD68 and iNOS within the mouse plaque lesions. Data were shown as bar plots together with group mean ± SE and compared using the Mann-Whitney U-test (n=3 per group). (C) Western blot assay showed significantly increased expression of inflammatory markers (TNF-α, IL-1β, and iNOS) in ox-LDL treated bone marrow-derived macrophages (BMDMs), which was rescued by si-KDM2A. (D) Immunofluorescence staining showed decreased iNOS expression under Si-KDM2A and quantified by (E) bar plot (n=3 per group). (F) Oil-red O staining determined the lipid accumulation of RAW264.7 cells with si-KDM2A treatment, and quantified by (G) bar plot (n=3 per group). (H) Western blot assay showed that the increased oxidative marker (NOX2) and apoptotic markers (BAX and BCL2) were alleviated by si-KDM2A. Expressions are presented as bar plots showing the group mean ± SEM, with n=6 per group unless otherwise specified. Data for more than two groups were compared by one-way ANOVA test.
Figure 6
Figure 6
FYN and RREB1 are direct target genes of KDM2A in macrophages. (A) Average ChIP-seq signal distribution near the transcriptional start site (TSS). (B) Genome-wide distribution of KDM2A ChIP-seq peaks in RAW264.7 cells. (C) Motif enrichment analysis of KDM22A co-bound peaks. (D) KEGG analysis of genes regulated by KDM2A. (E) A Venn diagram showing the target genes involved in inflammatory response regulated by KDM2A, identified as the intersection of RTN, scRNA-seq, RNA-seq, and ChIP-seq analysis. Genome browser views of 4 kb genomic loci of the (F) Fyn and (H) Rreb1 showing ChIP-seq tracks with called peaks (red bars). The increased RNA expression of KDM2A target genes (G) Fyn and (I) Rreb1 could be reversed by si-KDM2A. Expressions are shown as group mean ± SEM in bar plots. Data were compared by one-way ANOVA test, with n=3 per group.
Figure 7
Figure 7
KDM2A transcriptionally regulate FYN. The association of KDM2A expression with (A) CAC score and (B) FYN expression in GSE56045. (C) The association of FYN expression with CAC score. (D) Schematic illustrated the design for Fyn primers. (E) ChIP-qPCR showed the direct binding of KDM2A with the promoter of Fyn (n=3 per group). (F-I) Peripheral blood mononuclear cells from stable CAD patients undergoing percutaneous coronary intervention were used to validate the dysregulation of KDM2A, p-FYN/FYN ratios, and associated pathways based on the Gensini score. The expression levels of inflammatory markers (TNF-α, IL-1β, iNOS), oxidative stress markers (NRF2, NOX2, SOD2), and apoptosis-related proteins (BAX and BCL2) were assessed by immunoblotting (n = 5 per group). Data are presented as bar plots showing the group mean ± SEM and compared by Mann-Whitney U-test. Correlation analysis was examined by Spearman's test.
Figure 8
Figure 8
KDM2A-FYN axis exacerbates macrophage inflammatory response. (A-D) BMDMs were treated with the FYN activation inhibitor (AZD0530) for 24 hours after incubation with ox-LDL. Expression of inflammation (TNF-α, IL-1β, iNOS), oxidative stress (NRF2, NOX2, SOD2, NQO1, and AC-SOD2), and apoptosis (BAX and BCL2) was measured by immunoblotting and presented as bar plots together with group mean ± SEM (n = 6 per group). (E-H) BMDMs were treated with a KDM2A overexpression plasmid (OE-KDM2A) and rescued by AZD0530. The expression levels of inflammatory markers (TNF-α, IL-1β, iNOS), oxidative stress markers (NOX2, SOD2, and AC-SOD2), and apoptotic markers (BAX and BCL2) were measured by immunoblotting and presented as bar plots together with group mean ± SEM (n = 7 per group). (L) Oil-red O staining determined the lipid accumulation in RAW264.7 cells treated with OE-KDM2A and reversed by AZD0530, quantified by (M) bar plot (n=5 per group). The expressions were plotted together with the group mean ± SEM. data were compared by one-way ANOVA test.
Figure 9
Figure 9
Inhibition of Macrophage KDM2A attenuates atherosclerotic progression. (A) HE staining of carotid arteries in ApoE-/- mice treated with adeno-associated virus serotype 9 (AAV9) of negative control (HBAAV2/9-F4/80-mcherry, Control) or si-KDM2A (HBAAV2/9-F4/80-mir30-m-KDM2A-mcherry, M-KDM2A KD). (B) Quantitative analysis of the area of necrotic core (upper panel) and atherosclerotic lesion (lower panel) in aortic roots (n=3 per group). (C) Oil-red O staining of aortic roots from ApoE-/- mice treated with AAV-NC or AAV-si-KDM2A. (D-G) Aortic tissue samples from control and M-KDM2A KD group were used to validate the dysregulation of KDM2A, p-FYN/FYN ratios, and associated pathways The expression levels of inflammatory markers (TNF-α, IL-1β, iNOS), oxidative stress markers (NRF2, NOX2, SOD2), and apoptosis-related proteins (BAX and BCL2) were assessed by immunoblotting and presented as bar plots (n=6 per group). (I) Representative immunofluorescence analysis of cross-sections of the aortic root stained with iNOS, FYN, and CD68. Quantification of the relative intensity iNOS/FYN (I) and percentages of iNOS+ (J) and FYN+ (K) macrophages (CD68+ cells). Values are presented as group mean ± SEM. Data were compared by Mann-Whitney U-test.
Figure 10
Figure 10
KDM2A casually predicts atherosclerosis. (A) The study flowchart shows the genetic association analysis of KDM2A with atherosclerosis; (B) Forest plot illustrating the association of KDM2A with risk of atherosclerosis using the random effects inverse-variance weighted (IVW) method across different databases (UK Biobank and FinnGen). (C) Regional association plot for the colocalization analysis of KDM2A expression with atherosclerosis risk, with the lead SNP shown as a purple diamond. (D) HuGE (Human Genetic Evidence) scores quantify the genetic support for the involvement of KDM2A in various diseases and traits available in the CVDKP platform. (E) Electrostatic potential diagram of KDM2A (PDB ID: 4BBQ) interacting with the five good candidates (Kisspeptin-1: blue, NF-449: pink, Colistin: purple, Micafungin: orange, and TRV-120027: cyan). Predicted binding models of Kisspeptin-1 (F), NF-449 (G), Colistin (H), Micafungin (I), and TRV-120027 (J) with the Zinc finger of KDM2A. KDM2A was shown as a green cartoon, and the critical residues in binding were colored in red. The five compounds were shown as pink sticks. Yellow dashed lines represented the potential hydrogen bonds.
Figure 11
Figure 11
Schematic illustration of the role of KDM2A in the macrophage inflammatory response during atherosclerosis development. Graphic summary was generated with BioRender (https://app.biorender.com/).

References

    1. Ala-Korpela M. The culprit is the carrier, not the loads: cholesterol, triglycerides and apolipoprotein B in atherosclerosis and coronary heart disease. International journal of epidemiology. 2019;48:1389–92. - PubMed
    1. Tamargo IA, Baek KI, Kim Y, Park C, Jo H. Flow-induced reprogramming of endothelial cells in atherosclerosis. Nature reviews Cardiology. 2023;20:738–53. - PMC - PubMed
    1. Hou P, Fang J, Liu Z, Shi Y, Agostini M, Bernassola F. et al. Macrophage polarization and metabolism in atherosclerosis. Cell death & disease. 2023;14:691. - PMC - PubMed
    1. Miano JM, Fisher EA, Majesky MW. Fate and State of Vascular Smooth Muscle Cells in Atherosclerosis. Circulation. 2021;143:2110–6. - PMC - PubMed
    1. Bycroft C, Freeman C, Petkova D, Band G, Elliott LT, Sharp K. et al. The UK Biobank resource with deep phenotyping and genomic data. Nature. 2018;562:203–9. - PMC - PubMed

MeSH terms

Substances