. 2025 Mar 24;21(6):2568-2588.
doi: 10.7150/ijbs.97008. eCollection 2025.

Cgref1 is a CREB-H-regulated hepatokine that promotes hepatic de novo lipogenesis by mediating epididymal fat insulin resistance

Affiliations

Cgref1 is a CREB-H-regulated hepatokine that promotes hepatic de novo lipogenesis by mediating epididymal fat insulin resistance

Pearl Chan et al. Int J Biol Sci. .

Abstract

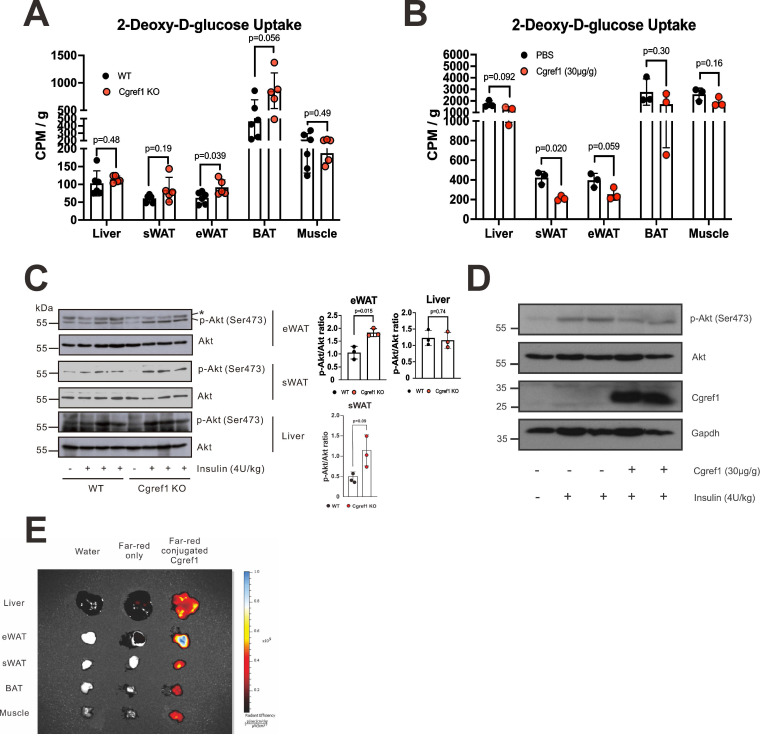
Rationale: Type 2 diabetes mellitus and metabolic dysfunction-associated steatotic liver disease (MASLD) are interrelated metabolic disorders that pose significant health concerns. Hepatokines and other regulatory factors implicated in these diseases are incompletely understood. Here, we report on a new hepatokine named cell growth regulator with EF-hand domain 1 (Cgref1) that modulates lipid metabolism to aggravate these conditions. Methods: Cgref1 was identified by microarray analysis of downregulated genes in liver of Creb3l3 -/- mice. Cgref1 -/- mice were subjected to transcriptomic, metabolomic and lipidomic analyses as well as metabolic assays. Gain-of-function and loss-of-function assays were performed in primary hepatocytes and cultured human and mouse cells. Results: Cgref1 expression is induced by hepatic transcription factor CREB-H. Secreted Cgref1 primarily targets epididymal white adipose tissue (eWAT), where insulin signalling and glucose uptake are suppressed. Cgref1-/- mice showed lower tendencies of developing obesity, hyperglycaemia and dyslipidaemia, associated with compromised hepatic de novo lipogenesis. Thus, Cgref1 poses an advantage to maintain the normal functioning of vital organs by preserving glucose from being absorbed into eWAT. However, in circumstances where Cgref1 expression becomes excessive, eWAT develops insulin resistance, which in turn promotes hepatic glucose production, lipogenesis and MASLD development. Conclusion: As a hepatokine that affects blood glucose levels and lipogenesis, Cgref1 is a potential target in the intervention of metabolic disorders.

Keywords: CREB-H transcription factor; Cgref1; diabetes; hepatokine; metabolic dysfunction-associated steatotic liver disease (MASLD); metabolic syndrome.


Conflict of interest statement

Competing Interests: The authors have declared that no competing interest exists.

Figures

Figure 1
Figure 1
Cgref1 expression is induced by transcription factor CREB-H. (A) The procedure of identifying CREB-H downstream targets. AAV-CREB-H-ΔTC (or AAV-eGFP as control) was delivered to Creb3l3-/- mice (n = 3 per group). Liver samples were processed for microarray analysis in the form of single-stranded cDNA (ss-cDNA). (B) The induction of hepatic Cgref1 by AAV-CREB-H-ΔTC revealed by microarray analysis. (C) Western blot analysis of liver lysates overexpressed with AAV-CREB-H-ΔTC or AAV-eGFP. (D and E) RT-qPCR (D) and Western blot (E) analysis of Huh7 cell culture medium and/or lysates after transfection of CREB-H-FL-V5, CREB-H-ΔTC-V5 and vector control. (F) RT-qPCR analyses of hepatic Cgref1 expression after an overnight fast of 16 h in WT and Creb3l3-/- mice and (G) 1 month of ND or HFD consumption in WT and Creb3l3-/- mice. (H) The design of three luciferase reporters containing different lengths of the Cgref1 promoter. (I) Dual-luciferase reporter assay. The three reporters harboring the Cgref1 promoter sequence described above were co-transfected respectively with CREB-H expressing plasmids. pRL-SV40 served as internal control.
Figure 2
Figure 2
Cgref1 expression and secretion through the ER-to-Golgi pathway. (A) Immunoprecipitation (IP) of Cgref1 protein from mouse sera. Expression was compared by Western blot analysis. (B) RT-qPCR and (C) Western blot analyses of Cgref1 expression in WT mouse tissues after 12 weeks of ND or HFD consumption (n = 5-6). (D) RT-qPCR analysis of hepatic Cgref1 mRNA between resting and prolonged exercise in mice (E) and in young versus relatively aged mice. (F) Confocal microscopic analysis of RFP-Rab2 (red) and Cgref1-V5 (green) overexpression in Hepa1-6 and Huh7 cells. Scale bars at 20 μm. (G) Western blot analysis of cell culture media and lysates of Hepa1-6 and Huh7 transfected with Cgref1-V5 or CGREF1-V5. For cell culture media, IP was performed to capture V5-tagged proteins before visualizing protein expression. (H) Western blot analysis of increasing doses of brefeldin A treatment. Hepa1-6 cells were first transfected with Cgref1-V5. Two days later, different doses of brefeldin A were applied to the cells and further incubated for 6 h. Cgref1-V5 in cell culture media was immunoprecipitated. Total protein was extracted from lysates. Band intensities were analyzed by ImageJ and normalized by the values of the PBS control sample.
Figure 3
Figure 3
Cgref1-/- mice exhibited a metabolically healthier phenotype. (A) Body weights of WT and Cgref1-/- mice at 8 weeks old on ND (n = 10-11 per group) or HFD (n = 7-8 per group) were measured on a weekly basis for 7 consecutive weeks. (B and C) Fat mass (B) and lean mass (C) of WT and Cgref1-/- mice on ND (n = 10-11 per group) and HFD (n = 7-8 per group) were determined by body composition analysis and represented as percentages of their body weights. (D and E) Blood glucose (D) and insulin (E) levels of WT and Cgref1-/- mice. (F-H) Intraperitoneal glucose tolerance (F), insulin tolerance (G) and pyruvate tolerance (H) tests were performed on WT and Cgref1-/- mice on ND (n = 6-8 per group) and HFD (n = 5-8 per group). (I-K) Serum TG (I), TCHO (J) and NEFA (K) levels were measured for WT and Cgref1-/- mice on ND (n = 5-8 per group) and HFD (n = 5-8 per group).
Figure 4
Figure 4
Cgref1 targets eWAT and suppresses insulin-mediated glucose uptake. (A) In vivo glucose uptake assay. Fasted WT and Cgref1-/- mice (n = 5-6 per group) were intraperitoneally injected with 3H-labelled 2-DG at a dose of 20 µCi. 30 minutes later, the mice were dissected. Extracted tissues were homogenized and subjected to scintillation counting. (B) In vivo glucose uptake assay with exogenous Cgref1 protein supplementation. Fasted WT mice (n = 3 per group) were intraperitoneally injected with recombinant Cgref1 protein at a dose of 30 µg/g of body weight 30 minutes before the injection of 2-DG. Remaining steps were identical to those described above. (C) Western blot analysis of Akt S473 phosphorylation in eWAT, sWAT and livers of WT and Cgref1-/- mice. Fasted mice were intraperitoneally injected with a lethal dose of insulin (4U/kg) and euthanized after 15 minutes. A non-specific band is highlighted by a star (*). (D) Western blot analysis of Akt S473 phosphorylation in eWAT of Cgref1-/- mice. Mice were intraperitoneally injected with recombinant Cgref1 protein (30 µg/g) or PBS. Insulin (4U/kg) was injected after 20 to 30 minutes. After a further 15 minutes, mice were euthanized. (E) Recombinant Cgref1 protein conjugated to a Far Red fluorescent dye was intraperitoneally injected into a WT mouse subject. Double-distilled water or the fluorescent dye alone was injected into control mice. After 30 minutes, the animals were euthanized and their tissues were arranged for fluorescence imaging. (F) Western blot analysis of insulin signaling pathway components in eWAT of WT and Cgref1-/- mice. Fasted mice were injected with insulin (4U/kg) and euthanized after 15 minutes.
Figure 5
Figure 5
The influence of Cgref1 on the expression of Glut4 and lipogenic factors. (A) Glut4 mRNA and protein expression (n = 7) in eWAT of WT and Cgref1-/- mice. (B) Dual luciferase reporter assay. Firefly luciferase reporter carrying a partial Glut4 promoter sequence was transfected into 3T3-L1 preadipocytes. A day later, the cells were incubated with Cgref1 protein (10 µg/ml) for a further 24 hours before luciferase activity measurement. pRL-SV40 served as internal control. (C) Glut4 mRNA and protein expression in differentiated 3T3-L1 adipocytes after an overnight incubation with Cgref1 protein (10 µg/ml). (D) RT-qPCR analysis of Srebp1 and glucose-sensitive Chrebp mRNA in eWAT. TFs: transcription factors. (E and F) RT-qPCR analysis of lipogenic genes in eWAT (E) and liver (F).
Figure 6
Figure 6
Cgref1-/- mice are less likely to develop fatty liver. (A) In vivo lipogenesis assay. Measurement of 3H in the lipid fraction of primary hepatocytes pre-incubated with 3H-labelled acetic acid (n = 4 per group). (B) H&E staining of mouse liver sections. (C) Hepatic TG measurement. (D) Total hepatic RNA of WT and Cgref1-/- mice (n = 3 per group) were compared by RNA-seq. DEGs identified from RNA-seq were further analyzed by KEGG pathway mapping. (E) Acc1, Acc2 and Scd1 genes belong to the fatty acid biosynthesis pathway and differentially expressed between WT and Cgref1-/- mice. (F) RT-qPCR analysis of Acc1, Acc2 and Scd1 mRNA expression in the liver cDNA of WT and Cgref1-/- mice. (G) Western blot analysis of Acc1 and Scd1 proteins in the liver samples of WT and Cgref1-/- mice. (H-J) Lipidomic analysis of hepatic FFA (H), DG (I) and TG (J) species identified by LC-MS/MS (n = 3 per group).
Figure 7
Figure 7
An illustration of physiological effects mediated by Cgref1. Liver-made Cgref1 mediates inter-organ effects of suppressing insulin signalling and glucose uptake at eWAT. Under circumstances of fasting, the secretion of Cgref1 preserves glucose from being absorbed into eWAT for the maintenance of vital organs. Under chronic and excessive expression of Cgref1, eWAT develops insulin resistance leading to elevated blood glucose and FFA levels. By processing these metabolites, hepatic DNL is upregulated and promotes hepatic fat accumulation. Simultaneously, the liver develops hepatic insulin resistance as a secondary effect. In short summary, the glucose 'turned away' from the eWAT and increased hepatic glucose production together contribute to the promotion of hyperglycemia.

Similar articles

References

    1. Younossi ZM, Golabi P, de Avila L, Paik JM, Srishord M, Fukui N. et al. The global epidemiology of NAFLD and NASH in patients with type 2 diabetes: A systematic review and meta-analysis. J Hepatol. 2019;71(4):793–801. - PubMed
    1. Sanders FW, Griffin JL. De novo lipogenesis in the liver in health and disease: more than just a shunting yard for glucose. Biol Rev Camb Philos Soc. 2016;91(2):452–68. - PMC - PubMed
    1. Utzschneider KM, Kahn SE. Review: The role of insulin resistance in nonalcoholic fatty liver disease. J Clin Endocrinol Metab. 2006;91(12):4753–61. - PubMed
    1. Liu XL, Pan Q, Cao HX, Xin FZ, Zhao ZH, Yang RX. et al. Lipotoxic hepatocyte-derived exosomal microRNA 192-5p activates macrophages through Rictor/Akt/Forkhead box transcription factor O1 signaling in nonalcoholic fatty liver disease. Hepatology. 2020;72(2):454–69. - PMC - PubMed
    1. Stefan N, Schick F, Birkenfeld AL, Häring HU, White MF. The role of hepatokines in NAFLD. Cell Metab. 2023;35(2):236–52. - PMC - PubMed

Substances