. 2025 Mar 31;15(11):4955-4969.
doi: 10.7150/thno.108329. eCollection 2025.

Biomimetic piezoelectric hydrogel system for energy metabolism reprogramming in spinal cord injury repair

Affiliations

Biomimetic piezoelectric hydrogel system for energy metabolism reprogramming in spinal cord injury repair

Guoliang Shi et al. Theranostics. .

Abstract

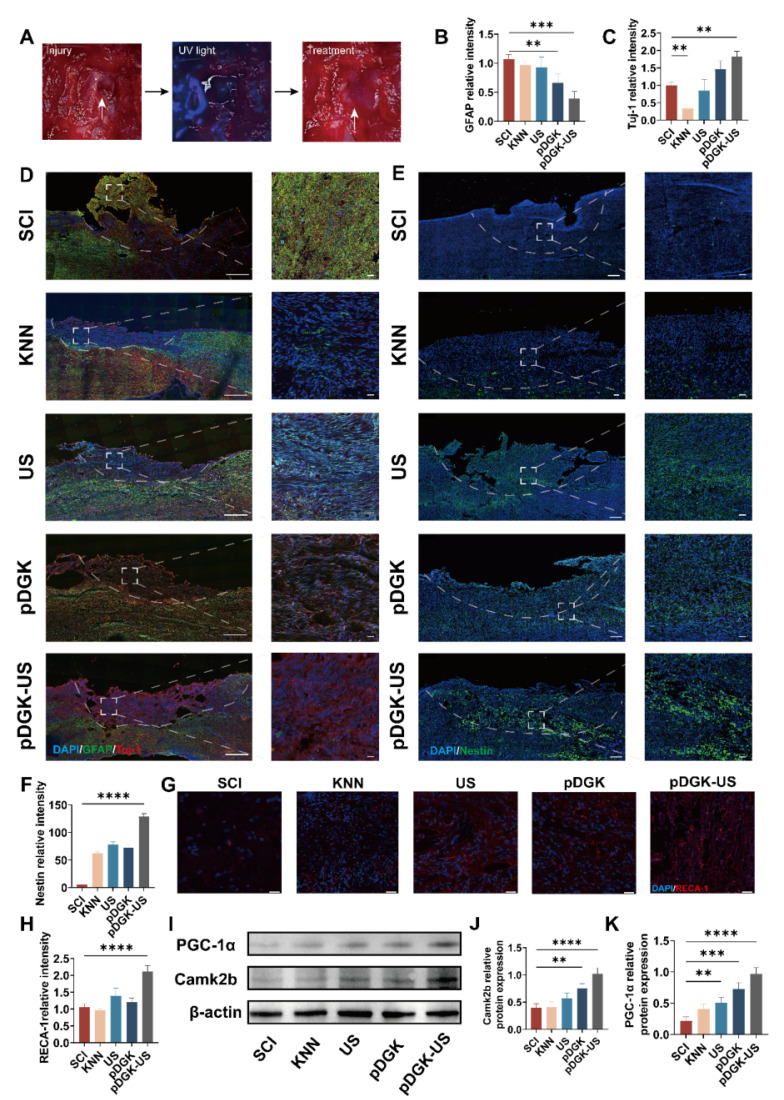
Rationale: Spinal cord injury (SCI) leads to limited regenerative capacity and severe energy deficiency in the injury microenvironment. This study aimed to develop a biomimetic piezoelectric hydrogel system that could recapitulate the native tissue microenvironment while enabling wireless physical regulation for SCI repair. Methods: A piezoelectric hydrogel was fabricated by integrating K0.5Na0.5NbO3 (KNN) nanoparticles with porous decellularized spinal cord matrix gel (pDG). The hydrogel's effects on vascular endothelial cell migration, neural stem cell differentiation, and ATP synthesis were evaluated in vitro. RNA sequencing was performed to identify key regulatory pathways. The therapeutic efficacy was assessed in a rat model of spinal cord hemisection, examining motor function and angiogenesis. Results: The piezoelectric hydrogel demonstrated excellent biocompatibility and significantly enhanced vascular endothelial cell and neural cell migration. Under ultrasonic stimulation, the hydrogel promoted neural stem cell differentiation into neurons more effectively than control hydrogels. The piezoelectric stimulation increased ATP synthesis and calcium ion flux, activating the Ca2+/Camk2b/PGC-1α signaling axis. In vivo studies showed that implantation of the piezoelectric hydrogel combined with ultrasound stimulation significantly improved motor function recovery and promoted angiogenesis. Conclusion: The piezoelectric hydrogel system presents an effective strategy for SCI repair through energy metabolism reprogramming and demonstrates promising potential in neural tissue engineering applications.

Keywords: ATP; neural regeneration; neural stem cells; piezoelectric hydrogel; spinal cord injury repair.


Conflict of interest statement

Competing Interests: The authors have declared that no competing interest exists.

Figures

Figure 1
Figure 1
Preparation and characterization of the DSCM and KNN nanoparticles. (A) Comparative H&E-stained sections of native and decellularized rat spinal cord tissues, highlighting the reduced nuclear content in DSCM (scale bar = 100 μm). (B) Nuclear staining of native spinal cord tissue and DSCM cells, showing the effectiveness of the decellularization process (scale bar = 1 mm). (C) Assessment of DNA content revealed a significant difference between native spinal cord tissue and DSCM. *p < 0.05, **p < 0.01, ***p < 0.001; n = 3. (D) Micrograph of KNN nanoparticles, demonstrating their morphology and size distribution (scale bar = 1 μm). (E) Elemental analysis of KNN nanoparticles, confirming the presence of key elements and the purity of the sample (scale bar = 1 nm). (F) Amplitude ring curve of KNN nanoparticles, illustrating their piezoelectric response to an applied electric field. (G) Phase ring curve of KNN nanoparticles, revealing substantial polarization reversal indicative of their piezoelectric properties.
Figure 2
Figure 2
Preparation and characterization of the piezoelectric hydrogel. (A) SEM and EDX elemental analysis of the piezoelectric porous hydrogel, showing its microstructure and elemental composition (SEM scale bar = 15 μm, EDX scale bar = 50 μm). (B) XRD pattern of the piezoelectric hydrogel, indicating its crystalline structure. (C) Gelation times for the piezoelectric hydrogel: components pDG and pDGK under UV illumination, and DSCM at 37°C, demonstrating rapid gelation kinetics. **p < 0.01, ***p < 0.001, ****p < 0.0001; n = 3. (D) Stress-strain curve of the piezoelectric hydrogel, with the maximum compressive modulus highlighting its mechanical properties. *p < 0.05; n = 3. (E) Elastic modulus of the piezoelectric hydrogel, illustrating its compliance compared with that of biological tissues. (F) Open-circuit voltage of the piezoelectric hydrogel, reflecting its ability to generate electrical potential in response to mechanical stress. (G) Output current of the piezoelectric hydrogel, showing the electrical output as a function of its piezoelectric properties.
Figure 3
Figure 3
Evaluation of the biocompatibility and migration efficiency of the piezoelectric hydrogel. (A) CCK-8 absorbance OD values for cells treated with different concentrations of KNN nanoparticles. *p < 0.05, ****p < 0.0001; n = 3. (B) CCK-8 absorbance OD values for cells treated with 0.2% KNN nanoparticles and different ultrasonic powers. **p < 0.01, ***p < 0.001; n = 3. (C) Assessment of cell viability within the hydrogels under 0.4 W/cm2 ultrasonic stimulation and non-stimulated conditions.(D) Live-dead staining images of PC12 cells cultured with the piezoelectric hydrogel, indicating cell viability (scale bar = 50 μm).(E) Quantification of migrated PC12 cells in response to the hydrogels under 0.4 W/cm2 ultrasonic stimulation and non-stimulated conditions. *p < 0.05, ***p < 0.001; n = 3. (F) Transwell migration assay results for PC12 cells and HUVECs under piezoelectric stimulation, visualized with crystal violet staining (scale bar = 20 μm). (G) Enumeration of migrated HUVECs in response to the hydrogels under 0.4 W/cm2 ultrasonic stimulation and non-stimulated condition. ***p < 0.001, ****p < 0.0001; n = 3.
Figure 4
Figure 4
Effect of piezoelectric hydrogels on neural differentiation. (A) Neural differentiation under piezoelectric stimulation, with Tuj-1 and GFAP labeled neurons and astrocytes, respectively (scale bars = 50 μm). (B) Analysis of the fluorescence intensity of GFAP-positive cells across different groups. **p < 0.01; n = 3. (C) Analysis of fluorescence intensity in Tuj-1-positive cells across different groups. *p < 0.05, **p < 0.01, ****p < 0.0001; n = 3. (D) Quantitative mRNA expression levels of the GFAP gene in the different groups, were normalized to GAPDH as an internal control. *p < 0.05; n = 5. (E) Quantitative mRNA expression levels of the Tuj-1 gene across groups, were normalized to the level of those of GAPDH, which was used as an internal control. **p < 0.01, ****p < 0.0001; n = 5. (F) Quantitative mRNA expression levels of the MAP2 gene across groups, normalized to those of GAPDH, which was used as an internal control. **p < 0.01, ***p < 0.001, ****p < 0.0001; n = 5. (G) Protein expression of Tuj-1, GFAP, and MAP2 of NSCs cultured on different samples. (H-J) Quantification of Western blot data. *p < 0.05, **p < 0.01, ***p < 0.001; n = 3.
Figure 5
Figure 5
Bioinformatics analysis and validation of the impact of piezoelectric hydrogels on neural differentiation. (A) Heatmap depicting differentially expressed genes between the piezoelectric pDGK-US group and the nonpiezoelectric control group, with orange indicating upregulated genes and blue indicating downregulated genes. (B) Volcano plot comparing gene expression in the piezoelectric pDGK-US group to that in the nonpiezoelectric control group, where the x-axis represents log2 (fold change) and the y-axis represents -log10 (P-value). (C) Measurement of the intracellular ATP content relative to that of the control. *p < 0.05; n = 3. (D) Relative fluorescence intensity assessment of cellular calcium influx. *p < 0.05; n = 3. (E) KEGG pathway enrichment analysis highlighting significant pathways. (F) Heatmap showing upregulated genes within the calcium signaling pathway. (G) GSEA indicating the upregulation of PGC-1α-involved pathways. (H) PPI analysis revealing the connections between Camk2b, PGC-1α, and genes associated with neuronal differentiation and axonal extension. (I) Immunofluorescence mapping of PGC-1α and Camk2b positive cells, visualized under microscopy (scale bars = 50 μm). (J) Relative fluorescence intensity of PGC-1α and Camk2b positive cells. *p < 0.05, ***p < 0.001; n = 3. (K) Gene expression of PGC-1α and Camk2b. ***p < 0.001; n = 3. (L) Protein expression of PGC-1α and Camk2b of NSCs cultured on different samples. (M) Quantification of Western blot data. *p < 0.05, **p < 0.01, ***p < 0.001; n = 3.
Figure 6
Figure 6
In vivo histological examination of piezoelectric hydrogels in injured spinal cord repair. (A) Schematic representation of the in vivo implantation of piezoelectric hydrogels (scale bars = 2 mm). (B) Comparative analysis of the relative fluorescence intensity of GFAP positive cells among the different groups. **p < 0.01, ***p < 0.001; n = 3. (C) Comparative analysis of the relative fluorescence intensity of Tuj-1 positive cells among the different groups. ***p < 0.001; n = 3. (D) Fluorescence images showing Tuj-1 and GFAP positive cells at the injury site for each group, at 8 weeks post-surgery (scale bars = 50 μm). (E) Fluorescence images showing Nestin positive cells at the injury site for each group, at 1 week post-surgery (scale bars = 50 μm). (F) Comparative analysis of the relative fluorescence intensity of Nestin positive cells among the different groups. ****p < 0.0001; n = 3. (G) Fluorescence images of RECA-1 positive cells at the injury site for each group at 8 weeks post-operatively (scale bars = 20 μm). (H) Comparative analysis of the relative fluorescence intensity of PGC-1α positive cells among different the groups. ****p < 0.0001; n = 3. (I) Protein expression of PGC-1α and Camk2b of damaged tissue on different samples. (J) Quantification of Camk2b Western blot data. **p < 0.01, ****p < 0.0001; n = 3. (K) Quantification of PGC-1α Western blot data. **p < 0.01, ***p < 0.001, ****p < 0.0001; n = 3.
Figure 7
Figure 7
Functional assessment of injured spinal cord repair with the piezoelectric hydrogel. (A) Temporal analysis of BBB scores for rat hind limb function. ***p < 0.001; n = 3. (B) Results of the inclined plate test at 8 weeks, with the y-axis representing the degree of plate inclination. (C) CatWalk gait analysis at 8 weeks, highlighting the footprint of the injured side in purple. (D) Analysis of rat footprint stress, where higher peaks signify greater force, and larger areas under the curve indicate a more uniform distribution of force. (E) MEP electrophysiology in rats at 8 weeks, with each frame representing a 5 ms interval and a 5 mV amplitude. (F) Duration of MEP latency, with shorter latencies suggesting faster neural conduction and improved nerve function. ****p < 0.0001; n = 3. (G) Amplitude of the MEP, with higher amplitudes reflecting better recovery of nerve function. ****p < 0.0001; n = 3. (H) Masson's trichrome staining of rat bladder tissue, with red areas indicating smooth muscle (scale bars = 200 μm). (I) Measurement of bladder wall thickness. ***p < 0.001; n = 3.

Similar articles

References

    1. Tian T, Zhang S, Yang M. Recent progress and challenges in the treatment of spinal cord injury. Protein Cell. 2023;14:635–52. - PMC - PubMed
    1. Ong B, Wilson JR, Henzel MK. Management of the Patient with Chronic Spinal Cord Injury. Med Clin North Am. 2020;104:263–78. - PubMed
    1. Lu Y, Shang Z, Zhang W, Pang M, Hu X, Dai Y. et al. Global incidence and characteristics of spinal cord injury since 2000-2021: a systematic review and meta-analysis. BMC Med. 2024;22:285. - PMC - PubMed
    1. Hu X, Xu W, Ren Y, Wang Z, He X, Huang R. et al. Spinal cord injury: molecular mechanisms and therapeutic interventions. Signal Transduct Target Ther. 2023;8:245. - PMC - PubMed
    1. Courtine G, Sofroniew MV. Spinal cord repair: advances in biology and technology. Nat Med. 2019;25:898–908. - PubMed