. 2025 Apr 9;15(11):5106-5120.
doi: 10.7150/thno.109826. eCollection 2025.

Noninvasive DWI tracking of hiPSCs differentiation into RTECs in AKI recovery via the KSP promoter-mediated AQP1 strategy

Affiliations

Noninvasive DWI tracking of hiPSCs differentiation into RTECs in AKI recovery via the KSP promoter-mediated AQP1 strategy

Yue Zhao et al. Theranostics. .

Abstract

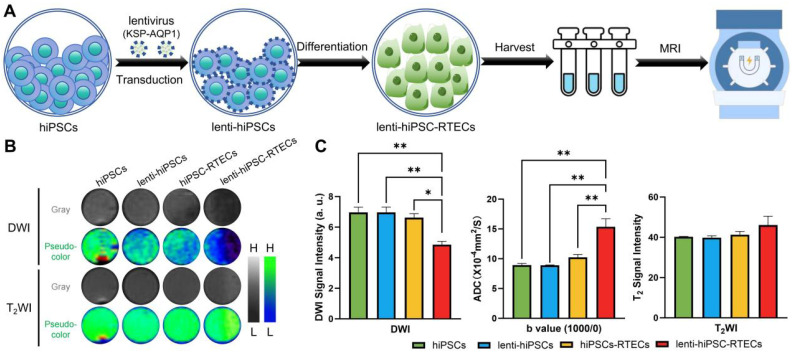
Rationale: Human-induced pluripotent stem cells (hiPSCs) exhibit great potential in the treatment of acute kidney injury (AKI), and their targeted differentiation into renal tubular epithelial cells (RTECs) is directly involved in the repair of the injured tissue. However, their differentiation during treatment is difficult to evaluate noninvasively. Methods: Aquaporin 1 (AQP1) can alter the dispersion of water molecules at the cellular level and thus can be detected with high sensitivity by diffusion-weighted imaging (DWI). In this study, a kidney-specific promoter (KSP-cadherin)-driven AQP1 overexpression lentivirus (KSP-AQP1) was constructed and used for tracking the differentiation of hiPSCs in vivo. Then, two AKI animal models were used to identify the feasibility of KSP-AQP1 for in vivo tracking of the differentiation of hiPSCs into RTECs. Results: We utilized KSP-positive and KSP-negative cells to examine the in vitro specificity of KSP-AQP1. It was found that only the KSP-positive cells showed a substantial expression of AQP1, accompanied by a significant variation in both the diffusion-weighted imaging (DWI) signal intensity (SI) and the apparent diffusion coefficient (ADC) values. whereas KSP-AQP1-transduced KSP-negative cells had no apparent SI and ADC changes. DWI results suggested that after the hiPSCs transplantation in vivo, the KSP-AQP1-pretransduced hiPSCs group exhibited a significantly decreased SI and increased ADC value when compared with the hiPSCs-treated and untreated AKI kidneys. In addition, the AQP1-mediated differences in DWI SI and ADC value between the KSP-AQP1-pretransduced hiPSCs group and hiPSCs group were confirmed by analysis of the KSP transcriptional activity using co-expressed exogenous flag gene mCherry. Conclusions: This study successfully developed a method for tracking the differentiation of hiPSCs into RTECs in vivo during the treatment of AKI using a KSP-regulated AQP1 overexpression strategy.

Keywords: acute kidney injury; aquaporin 1; diffusion-weighted imaging; human-induced pluripotent stem cells; tracking of differentiation.


Conflict of interest statement

Competing Interests: The authors have declared that no competing interest exists.

Figures

Figure 1
Figure 1
AQP1 structure and lentiviral construction. (A) The 3D structure information of AQP1 (PDB ID: 1ih5). (B) Schematic illustration of the transportation process of water molecules within the AQP1 channel. (C) The workflow of construction of recombinant lentivirus plasmids. (D) PCR analysis of the plasmids. 1, ddH2O; 2, pLV/CMV plasmid; 3, GAPDH; 4, DNA marker; and 5, pKSP-AQP1 plasmid. (E) Transmission electron microscopic observation of KSP-AQP1. Scale bar, 200 nm.
Figure 2
Figure 2
Differentiation of hiPSCs into RTECs. (A) Schematic of the differentiation process using the Nephron Differentiation Kit. (B) RT-PCR analysis revealed significant expression of pluripotency markers OCT4 and Nanog on Day 0 and epithelial cell markers CDH1 and CK18 on Day 20. (C) IFA indicated a significantly high expression of the pluripotency marker OCT4 on Day 0 and the epithelial cell marker CDH1 on Day 20. Scale bar, 100 μm. (D) Western blot assay demonstrated significantly high expression of the pluripotency marker OCT4 on Day 0 and the epithelial cell marker CDH1 on Day 20. (E) Quantitative analysis of western blot results. *p < 0.05, **p < 0.01, ***p < 0.001; n = 3.
Figure 3
Figure 3
KSP promoter-mediated specific expression of AQP1. (A) The mCherry expression in each type of cell line before and after KSP-AQP1 transduction. BF, bright field; Scale bar, 100 μm. (B) IFA to detect the expression of AQP1. (C) RT-PCR to detect the expression level of AQP1 mRNA. (D) Western blot to analyze the level of AQP1 protein in different cells. (E) Quantitative analysis the relative level of AQP1 protein by western blot. **p < 0.01, ***p < 0.001, and nsp > 0.05; n = 3.
Figure 4
Figure 4
KSP-AQP1-mediated specific DWI contrast after the differentiation of hiPSCs into RTECs. (A) Schematic illustration of in vitro MRI. (B) DWI (b = 1000) images and T2WI signal maps of hiPSCs, lenti-hiPSCs, hiPSC-RTECs and lenti-hiPSC-RTECs, where L and H denote low SI and high SI, respectively. (C) Quantitative analysis of DWI SI, ADCb=1000/0 values, and T2WI SI in the target regions. *p < 0.05 and **p < 0.01; n = 3.
Figure 5
Figure 5
DWI tracking the differentiation of hiPSCs in I/R-AKI rats. (A) DWI images (b = 650) in different groups, where L and H denote low SI and high SI, respectively; pre, before I/R surgery. (B) Quantitative analysis of the DWI SI (b=650) and ADCb=650/0 values of ROI in Figure 5A. (C) H&E, Masson's trichrome staining, and IHC of kidney in different groups. Scale bar, 50 μm. (D) Serum concentrations of BUN and SCr before I/R and 7 and 14 days post-treatment in different groups. *p < 0.05, **p < 0.01, and ***p < 0.001; n = 3.
Figure 6
Figure 6
DWI tracking the differentiation of hiPSCs in Cisplatin-AKI rats. (A) DWI maps (b = 650) in different groups, where L and H denote low SI and high SI, respectively; pre, before cisplatin induction. (B) Quantitative analysis of the DWI SI (b = 650) and ADCb=650 values in Figure 6A. (C) H&E, Masson's trichrome staining, and IHC of kidneys in different treatments. Scale bar, 50 μm. (D) Serum concentrations of BUN and SCr before cisplatin induction and 7 days and 14 days post-treatment. *p < 0.05 and **p < 0.01; n = 3.

Similar articles

References

    1. Bonventre JV, Yang L. Cellular pathophysiology of ischemic acute kidney injury. J Clin Invest. 2011;121:4210–21. - PMC - PubMed
    1. Ronco C, Bellomo R, Kellum JA. Acute kidney injury. Lancet. 2019;394:1949–64. - PubMed
    1. Kellum JA, Romagnani P, Ashuntantang G, Ronco C, Zarbock A, Anders H-J. Acute kidney injury. Nat Rev Dis Primers. 2021;7:52. - PubMed
    1. Lewington AJP, Cerdá J, Mehta RL. Raising awareness of acute kidney injury: a global perspective of a silent killer. Kidney Int. 2013;84:457–67. - PMC - PubMed
    1. Yun CW, Lee SH. Potential and Therapeutic Efficacy of Cell-based Therapy Using Mesenchymal Stem Cells for Acute/chronic Kidney Disease. Int J Mol Sci. 2019;20:1619. - PMC - PubMed

LinkOut - more resources