. 2025 Apr 9;15(11):5121-5137.
doi: 10.7150/thno.110034. eCollection 2025.

Extracellular vesicles play a central role in linking podocyte injury to mesangial activation in glomerular disease

Affiliations

Extracellular vesicles play a central role in linking podocyte injury to mesangial activation in glomerular disease

Zhao Liu et al. Theranostics. .

Abstract

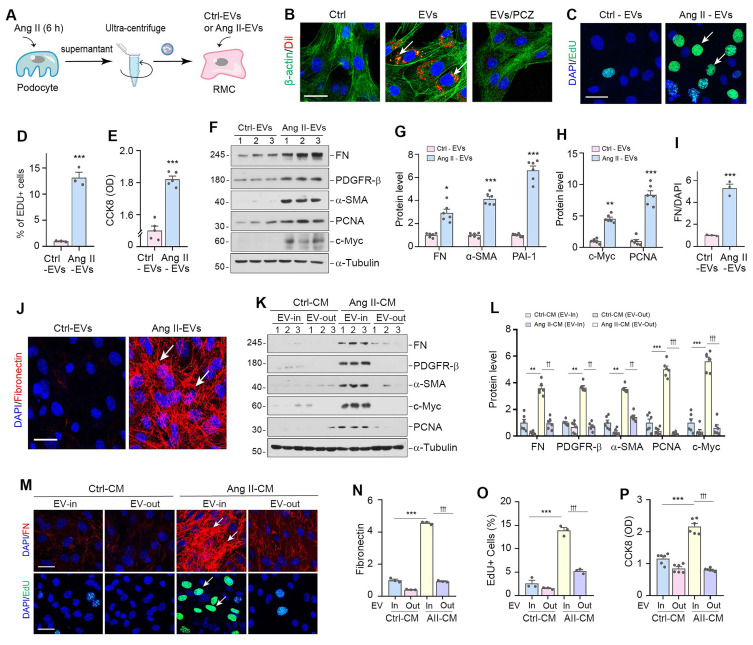
Background: Podocyte injury leading to proteinuria is the primary feature of a vast majority of glomerular diseases, while mesangial cell activation is the hallmark of glomerulosclerosis. Whether and how these two events are connected remains elusive. In this study, we investigated the role of extracellular vesicles (EVs) in linking podocyte injury to mesangial activation in glomerular disease. Methods: EVs were characterized by nanoparticle tracking analysis and electron microscopy. Differentially expressed proteins from podocyte-derived EVs were analyzed by protein microarray. The role and mechanism by which EVs-packaged sonic hedgehog (Shh) mediates mesangial cell activation were investigated in vitro and in vivo. Results: An increased production of EVs in mouse podocytes (MPC5) was observed after injury induced by angiotensin II (Ang II). Shh and N-Shh were identified as major constituents of the proteins encapsulated in EVs isolated from Ang II-treated MPC5 cells (Ang II-EVs). In vitro, Ang II-EVs induced the activation and proliferation of rat mesangial cells (HBZY-1), whereas inhibition of EV secretion with dimethyl amiloride, depletion of EVs from conditioned media or knockdown of Shh expression abolished the ability of Ang II-EVs to induce HBZY-1 activation. In vivo, intravenous injection of Ang II-EVs exacerbated glomerulosclerosis, which was negated by hedgehog inhibitor. Furthermore, blocking EV secretion also ameliorated glomerulosclerosis in mouse model of glomerular disease. Conclusions: These findings suggest that podocyte injury can cause mesangial cell activation and glomerulosclerosis by releasing Shh-enriched EVs. Therefore, strategies targeting EVs may be a novel way to ameliorate proteinuric kidney disease.

Keywords: Glomerulosclerosis; Shh; extracellular vesicles; podocyte-mesangial communication; proteinuria.


Conflict of interest statement

Competing Interests: The authors have declared that no competing interest exists.

Figures

Figure 1
Figure 1
Podocyte injury is associated with increased production of extracellular vesicles (EVs). (A-B) Western blot analyses demonstrate protein expression of ZO-1, podocalyxin and tumor susceptibility gene 101 (TSG101) in mouse podocyte cells (MPC5) at different time points after Ang II treatment. Representative Western blot (A) and quantitative data (B) are presented. Numbers (1 to 3) indicate each individual culture plate in a given group. P < 0.05, ***P < 0.001versus control (n = 6). (C-D) Western blotting (C) and quantitative data show protein expression of ZO-1, podocalyxin and TSG101 (D) in MPC5 cells treated with different concentrations of Ang II. Numbers (1 to 3) indicate each individual culture plate in a given group. P < 0.05, **P < 0.01 versus control (n = 6). (E) Diagram shows the experimental design of EVs isolated from MPC5 cells treated with Ang II (Ang II-EVs). (F) Transmission electron microscopy (TEM) shows the EVs isolated from conditioned media of MPC5 cells. Scale bar, 200 nm. (G) Average size distribution and concentration of Ctrl-EVs and Ang II-EVs were detected by nanoparticle tracking analysis (NTA), respectively. (H) Diagram shows the experimental design of the ELISA-based protein arrays to identify the different composition of EVs isolated from MPC5 cells treated with or without Ang II (Ang II-EV or Ctrl-EV). N-Shh was the most increased protein in Ang II-EV, compared with Ctrl-EV. (I) Representative Western blotting shows the presence of CD63, TSG101, as well as Shh, N-Shh, Gli1 and Smo in the EVs isolated from the Ang II-CM. (J) Double immunofluorescence staining demonstrates co-localization of Shh (Green) and CD63 (Red) in MPC5 after Ang II treatment. Arrows indicate positive staining. Scale bar, 10 µm. (K) Representative transmission electron microscopy (TEM) shows EVs in the interstitial spaces between podocytes and mesangial area of Ang II/ADR-treated glomerulosclerotic mice. Boxed area is enlarged. Arrows indicate EVs. Scale bar, 200 nm. (L) Double immunofluorescence staining indicates the generation of EVs in the glomeruli of diseased kidney from FSGS patient. Kidney sections were co-stained for CD63 (Red) and Shh (green). White broken line highlights the boundary of glomeruli. Boxed area is enlarged. Scale bar, 20 µm. (M) Transmission electron microscopy (TEM) shows extracellular vehicles (EVs) in the spaces between podocytes and mesangial cells of FSGS patient's renal tissue. Boxed area is enlarged. Arrows indicate EVs. Scale bar, 1 µm. (N-P) Western blotting (N) and quantitative data (O, P) show protein expression of TSG101, CD63, nephrin, Shh and N-Shh (D) in urinary EVs isolated from CKD patients. Numbers (1 to 5) indicate urinary EV samples from each individual in a given group. ***P < 0.001 versus control (n = 5).
Figure 2
Figure 2
Inhibition of EV release attenuates mesangial cell activation and proliferation in vitro. (A, B) Representative Western blotting (A) and quantitative data (B) indicate the induction of N-Shh and Shh expression in MPC5 cells at different time points after Ang II treatment. Numbers (1 to 3) indicate each individual treatment in a given group. ***P < 0.001 versus control (n = 6). (C, D) Western blotting analyses demonstrate the expression of N-Shh and Shh in MPC5 cells treated with different concentrations of Ang II. Representative Western blot (C) and quantitative data (D) are presented. Numbers (1 to 3) indicate each individual culture plate in a given group. **P < 0.01, ***P < 0.001 versus control (n = 6). (E) Experimental design. MPC5 cells were treated with Ang II (1 µM) for 6 h, and then washed to remove Ang II and continued to incubate for additional 48 h in serum-free medium. Conditioned media were collected and used to stimulate normal rat mesangial cells (HBZY-1) for 24 h. (F) Cell Counting Kit-8 (CCK8) assay shows the conditioned media from MPC5 cells treated with Ang II (Ang II-CM) stimulated HBZY-1 cell proliferation in vitro. ***P < 0.001 versus Ctrl-CM (n = 6). (G, H) Representative Western blotting (G) and quantitative data (H) show the expression of c-Myc and proliferating cell nuclear antigen (PCNA) in HBZY-1 cells after incubation with conditioned media. Numbers (1 to 3) indicate each individual treatment in a given group. ***P < 0.001 versus Ctrl-CM (n = 6). (I, J) Representative Western blotting (I) and quantitative data (J) show the expression of FN, α-smooth muscle actin (α-SMA), and plasminogen activator inhibitor-1 (PAI-1) in HBZY-1 cells after incubation with conditioned media. Numbers (1 to 3) indicate each individual treatment in a given group. **P < 0.01, ***P < 0.001 versus Ctrl-CM (n = 6). (K, L) Representative micrographs (K) and quantitative data (L) show immunofluorescence staining of fibronectin (FN) in HBZY-1 cells after incubation with conditioned media from MPC5 cells. Arrows indicate positive staining. Scale bar, 25 µm. ***P < 0.001 versus Ctrl-CM (n = 3). (M, N) Representative Western blotting (M) and quantitative data (N) demonstrate the reduction of CD63 and TSG101 expression after DMA treatment. Numbers (1 to 3) indicate each individual culture plate in a given group. ***P < 0.001 versus controls; †††P < 0.001 versus Ang II-CM treatment alone (n = 6). (O, P) Blockade of EV generation by DMA abolished mesangial cell activation induced by MPC5 conditioned media. Representative micrographs (O) and quantitative data (P) show FN expression in different groups as indicated. Arrows indicate positive staining. Scale bar, 25 µm. ***P < 0.001 versus controls; †††P < 0.001 versus Ang II-CM treatment alone (n = 3). (Q, R) Western blot analyses show that blockade of EV secretion by DMA inhibited FN, PDGFR-β, and α-SMA expression in HBZY-1 cells induced by MPC5 conditioned media. Representative Western blot (Q) is shown. Numbers (1 to 3) indicate each individual culture in given group. Graphic presentation (R) indicates the relative protein levels of FN, PDGFR-β, and α-SMA. **P < 0.01 versus controls, ††P < 0.01, †††P < 0.001 versus Ang II-CM (n = 6). (S, T) Western blot analyses show that blockade of EV secretion by DMA inhibited c-Myc and PCNA expression in HBZY-1 induced by MPC5 conditioned media. Representative Western blot (S) is shown. Numbers (1 to 3) indicate each individual culture in given group. Graphic presentation (T) indicates the relative protein levels of c-Myc and PCNA. **P < 0.01, ***P < 0.001 versus controls, ††P < 0.01, †††P < 0.001 versus Ang II-CM (n = 6).
Figure 3
Figure 3
Podocyte-derived EVs mediate mesangial cell activation and proliferation in vitro. (A) Diagram shows the experimental design. EVs were isolated from conditioned media by ultracentrifugation. (B) Fluorescent staining confirms the intercellular transfer of MPC5 cell-derived EVs in HBZY-1 cells. MPC5 cells were incubated with Dil-C18 (red), a fluorescent lipophilic membrane dye for a long-term tracing. HBZY-1 cells were pretreated with or without the endocytosis inhibitor prochlorperazine (PCZ). MPC cell-derived EVs were then isolated and incubated with HBZY-1 cells for 24 h, followed by immunofluorescence staining for β-actin (green). Arrows indicate MPC5 cell-derived EVs. Scale bar, 25 µm. (C-E) EVs derived from Ang II-treated MPC5 cells stimulated HBZY-1 cell proliferation in vitro. EdU incorporation (C) and its quantitative data (D) are shown. Arrows indicate positive staining. Scale bar, 25 µm. ***P < 0.001 versus Ctrl-EVs (n = 3). Graphic presentation (E) indicates the Cell Counting Kit-8 assay. ***P < 0.001 versus Ctrl-EVs (n = 6). (F-H) Western blot analyses show protein expression of FN, PDGFR-β, α-SMA, PCNA and c-Myc in HBZY-1 cells exposed to Ctrl-EVs or Ang II-EVs. Representative Western blot (F) and quantitative data (G, H) are presented. Numbers (1 to 3) indicate each individual treatment in a given group. *P < 0.05, **P < 0.01, ***P < 0.001 versus Ctrl-EVs (n = 6). (I, J) Representative micrographs (J) and quantitative data (I) show FN-positive staining in HBZY-1 cells after incubation with EVs derived from MPC5 cells. Arrows indicate positive staining. Scale bar, 25 µm. ***P < 0.001 versus Ctrl-EVs (n = 3). (K, L) EVs are required for mediating HBZY-1 cell activation induced by MPC5 cells conditioned media. Western blot analyses show that FN, PDGFR-β, α-SMA, c-Myc and PCNA expression in different groups as indicated. Numbers (1 to 3) indicate each individual culture plate in a given group. Quantitative data (L) is presented. **P < 0.01, ***P < 0.001 versus Ctrl-CM (EV-In); ††P < 0.01, †††P < 0.001 versus Ang II-CM (EV-Out) (n = 6). (M-O) Representative micrographs (M) and quantitative data (N) show FN-positive staining in different groups as indicated. Arrows indicate positive staining. Scale bar, 25 µm. ***P < 0.001 versus Ctrl-CM, †††P < 0.001 versus Ang II-CM (n = 3). Representative micrographs (M) and quantitative data (O) show EdU incorporation in different groups as indicated. Arrows indicate positive staining. Scale bar, 25 µm. ***P < 0.001 versus Ctrl-CM, †††P < 0.001 versus Ang II-CM (n = 3). (P) Cell Counting Kit-8 assay shows MPC5 cells conditioned media lacking EVs failed to induce HBZY-1 cell proliferation. ***P < 0.001 versus Ctrl-CM, †††P < 0.001 versus Ang II-CM (n = 6).
Figure 4
Figure 4
Shh in podocyte-derived EVs mediate podocyte-mesangial communication. (A) Experimental design show Shh signal are inhibited in HBZY-1 cells prior to stimulation with MPC5 cells conditioned media. HBZY-1 cells were treated with CPN for 1 h, and then treated with Ctrl-CM or Ang II-CM for 24 h. (B-D) Western blot (B) and quantitative data (C, D) show the upregulation of Gli1, Smo, FN, PDGFR-β, α-SMA, c-Myc and PCNA expression after incubation with Ang II-CM, but these effects are abolished by CPN treatment. Numbers (1 to 3) indicate each individual treatment in a given group. ***P < 0.001 versus Ctrl-CM, †††P < 0.001 versus Ang II-CM (n = 6). (E) Experimental design showing knockdown of Shh in MPC5 cells prior to collection of conditioned media. (F, G) Western blot (F) and quantitative data (G) showing protein levels of Shh and N-Shh in different groups as indicated. Numbers (1 to 3) indicate each individual treatment in a given group. ***P < 0.001, †††P < 0.001 (n = 6). (H, I) Representative micrographs (H) and quantitative data (I) show Knockdown of Shh in MPC5 cells reduced FN-positive staining in HBZY-1 cells after incubation with conditioned media. Arrows indicate positive staining. Scale bar, 50 µm. ***P < 0.001, †††P < 0.001 (n = 6). (J, K) Western blot analyses show protein expression of c-Myc and PCNA in different groups of HBZY-1 cells as indicated. Representative Western blot (J) and quantitative data (K) are presented. Numbers (1 to 3) indicate each individual treatment in a given group. ***P < 0.001, †††P < 0.001 (n = 6). (L, M) Western blot analyses show protein expression of FN, PDGFR-β and α-SMA in different groups of HBZY-1 cells as indicated. Representative Western blot (L) and quantitative data (M) are presented. Numbers (1 to 3) indicate each individual treatment in a given group. ***P < 0.001, †††P < 0.001 (n = 6).
Figure 5
Figure 5
The production of EVs and Shh is increased in mouse model of glomerulosclerosis. (A) Diagram shows the experimental design. The time points when osmotic pump was placed into the subcutaneous space of mice and intravenous injection of ADR at the dose of 8 mg/ kg body weight are indicated, respectively. Mice were infused with Ang II at 1.5 mg/ kg per day with osmotic pumps. (B, C) Graphic presentations show the mean arterial pressure (MAP) levels (B) and urinary albumin-to creatinine ratio (ACR) levels (C) in Ang II/ADR mice. ***P < 0.001 versus sham controls (n = 6). (D-F) Representative micrographs (D) and quantifications show the fraction of collagen deposition (E) and mesangial area (F) in Ang II/ADR mice. Paraffin sections were subjected to periodic acid-Schiff (PAS) staining (upper) and Masson's trichrome staining (bottom), respectively. Arrow indicates positive staining. Scale bar, 50 µm. ***P < 0.001 versus sham controls (n = 6). (G-I) Representative Western blotting (G) and quantitative data show the loss of ZO-1 and podocalyxin (H) and the induction of TSG101, N-Shh and Shh (I) in the glomeruli of Ang II/ADR mice. Numbers (1 to 6) indicate each individual animal in a given group. ***P < 0.001, †††P < 0.001 versus sham controls (n = 6). (J, K) Western blotting analyses demonstrate the expression of FN, PDGFR-β and α-SMA in the glomeruli of Ang II/ADR mice. Representative Western blot (J) and quantitative data (K) are presented. Numbers (1 to 6) indicate each individual animal in a given group. ***P < 0.001 versus sham controls (n = 6). (L, M) Representative micrographs and quantifications of double immunofluorescence staining show CD63 (left), Shh (middle) and PDGFR-β (right) expression in the glomeruli of Ang II/ADR mice. Kidney sections were co-stained for podocalyxin (green) and CD63, Shh or PDGFR-β (Red), respectively. Scale bar, 50 µm. ***P < 0.001 versus controls (n = 6). (N) Representative Western blotting of CD63, TSG101, N-Shh and Shh in HBZY-1 cells after incubation with Ang II for 24 h are shown. Numbers (1 to 3) indicate each individual culture in a given group.
Figure 6
Figure 6
Podocyte-derived EVs promote glomerulosclerosis in vivo. (A) Diagram shows the experimental design. The time points of the osmotic pump of Ang II being placed into the subcutaneous space of mice (at the dose of 1.5 mg/kg body weight per day), the intravenous injection of ADR (8 mg/kg body weight), the intravenous injection of MPC cells-derived EVs (Ctrl-EVs or Ang II-EVs, 1 mg per mouse per time point, once per two days) and the CPN treatment (5 mg/kg body weight), are indicated. (B) Imaging of fluorescence intensity showed Dil-C18-labeled EVs in the glomeruli at 12 h after the last intravenous injection. EVs isolated from Ang II-treated MPC5 cells were labelled with fluorescent lipophilic membrane dye Dil-C18, and then injected through the tail vein into Sham (left) and Ang II/ADR mice (right). Part of the glomerulus was enlarged and positive staining indicated by arrows. (C) Graphic presentation shows the urinary albumin-to creatinine ratio (ACR) levels in different groups after Ang II and ADR treatment. ***P < 0.001, n.s., not significant (n = 6). (D, E) Western blot analyses show expression of PDGFR-β, FN, α-SMA, PCNA, Gli1 and Smo in different groups of glomeruli as indicated. Numbers (1 to 2) indicate each individual animal in a given group. Quantitative data is presented (E). ***P < 0.001 versus Ang II+ADR mice; †††P < 0.001 versus CPN treated with Ang II-EVs (n = 6). (F, G) Representative micrographs (F) and quantifications (G) show the collagen deposition and mesangial area in different groups as indicated. Paraffin sections were subjected to periodic acid-Schiff (PAS) staining (upper) and Masson's trichrome staining (bottom), respectively. Arrows indicate positive staining. Scale bar, 50 µm. ***P < 0.001, †††P < 0.001, n.s., not significant (n = 6). (H, I) Representative micrographs and quantification of double immunofluorescence staining show PDGFR-β expression in different groups of glomeruli as indicated. Kidney sections were co-stained for PDGFR-β (Red) and podocalyxin (green), respectively. Arrows indicate positive staining. Scale bar, 50 µm. **P < 0.01, ***P < 0.001, †††P < 0.001, n.s., not significant (n = 6).
Figure 7
Figure 7
Blockade of EV secretion ameliorates glomerulosclerosis in vivo. (A) Diagram shows the experimental design. The time points of the osmotic pump of Ang II being placed into the subcutaneous space of mice (at the dose of 1.5 mg/kg body weight per day), the intravenous injection of ADR (8 mg/kg body weight) and the daily intraperitoneal injection of dimethyl amiloride DMA (20 mg/kg body weight in 0.9% saline), are indicated. (B) DMA treatment did not affect albuminuria in Ang II/ADR mice. Urinary albumin-to creatinine ratio (ACR) levels were shown. ***P < 0.001, n.s., not significant (n = 6). (C, D) DMA inhibits EVs secretion of glomeruli in Ang II/ADR mice. Representative Western blot (C) and quantitative data (D) show the reduction of glomerular CD63 and TSG101 expression after DMA treatment. Numbers (1 to 3) indicate each individual animal in a given group. ***P < 0.001, †††P < 0.001 (n = 6). (E-F) Representative micrographs (E) and quantifications (F) show the collagen deposition and mesangial area in different groups as indicated. Paraffin sections were subjected to periodic acid-Schiff (PAS) staining (upper) and Masson's trichrome staining (bottom), respectively. Arrows indicate positive staining. Scale bar, 50 µm. ***P < 0.001, ††† P < 0.001 (n = 6). (G, H) Western blot analyses show that DMA inhibited glomerular expression of mesangial activation-related proteins in Ang II/ADR mice. Representative Western blot (G) and quantitative data (H) are shown. Numbers (1 to 3) indicate each individual animal in a given group. ***P < 0.001, †††P < 0.001 (n = 6). (I, J) Representative Western blot (I) and quantitative data (J) show the protein levels of c-Myc and PCNA in different groups of glomeruli as indicated. Numbers (1 to 3) indicate each individual animal in a given group. ***P < 0.001, †††P < 0.001 (n = 6). (K-M) Representative micrographs (K, L) and quantification (M) of double immunofluorescence staining show CD63 (K) and PDGFR-β (L) expression of glomeruli in different groups as indicated. Kidney sections were co-stained for podocalyxin (green), and CD63 or PDGFR-β (Red), respectively. Arrows indicate positive staining. Scale bar, 50 µm. ***P < 0.001, †††P < 0.001 (n = 6). (N) Schematic diagram illustrating the role of podocyte-derived EVs enriched with sonic hedgehog (Shh) in promoting mesangial cell activation and glomerulosclerosis. Following podocyte injury, these EVs facilitate the delivery of Shh to mesangial cells, thereby activating them via the Shh/Smoothened/Gli1 signaling pathway, which ultimately promotes mesangial activation and glomerulosclerosis.

Similar articles

References

    1. Kidney Disease. Improving Global Outcomes (KDIGO) Glomerular Diseases Work Group. KDIGO 2021 clinical practice guideline for the management of glomerular diseases. Kidney Int. 2021;100:S1–S276. - PubMed
    1. Chadban SJ, Atkins RC. Glomerulonephritis. Lancet. 2005;365:1797–806. - PubMed
    1. Kopp JB, Anders HJ, Susztak K, Podestà MA, Remuzzi G, Hildebrandt F. et al. Podocytopathies. Nat Rev Dis Primers. 2020;6:68. - PMC - PubMed
    1. Pavenstädt H, Kriz W, Kretzler M. Cell biology of the glomerular podocyte. Physiol Rev. 2003;83:253–307. - PubMed
    1. D'Amico G, Bazzi C. Pathophysiology of proteinuria. Kidney Int. 2003;63:809–25. - PubMed

LinkOut - more resources