. 2025 Mar 31;15(11):4890-4908.
doi: 10.7150/thno.105953. eCollection 2025.

Pharmacological targeting of mitophagy via ALT001 improves herpes simplex virus 1 (HSV1)-mediated microglial inflammation and promotes amyloid β phagocytosis by restricting HSV1 infection

Affiliations

Pharmacological targeting of mitophagy via ALT001 improves herpes simplex virus 1 (HSV1)-mediated microglial inflammation and promotes amyloid β phagocytosis by restricting HSV1 infection

Soo-Jin Oh et al. Theranostics. .

Abstract

Rationale: One of the hallmarks of Alzheimer's disease (AD) is the accumulation of dysfunctional mitochondria. Herpes simplex virus type 1 (HSV1) may be a risk factor for the neuropathology linked to amyloid β (Aβ) accumulation. However, the mechanisms underlying HSV1-associated mitochondrial dysfunction in AD remain unclear. ALT001 is a novel drug that ameliorates AD-related cognitive impairment via ULK1/Rab9-mediated alternative mitophagy. In this study, we investigated the effects of ALT001 on the neurodegeneration-related microglial signatures associated with HSV1 infection. Methods: Molecular mechanisms and physiological functions of mitophagy was investigated in HSV1-infected microglia, including primary murine and human embryonic stem cell (ESC)-derived microglia (ES-MG), as well as in a microglia-neuron co-culture system. Microglial gene signatures following HSV1 infection in the presence or absence of ALT001 were analyzed using bulk RNA sequencing, and the effects of ALT001 on microglial phagocytosis and microglia-mediated immune responses were further evaluated by flow cytometry and cytokine profiles. Results: HSV1 infection inhibited PINK1/Parkin-mediated mitophagy via HSV1-encoded protein kinase US3, resulting in mitochondrial dysfunction in both human and mouse microglia. Furthermore, transcriptomic analysis of HSV1-infected microglia revealed an upregulation of distinct microglial genes associated with disease-associated microglia (DAM)-like phenotype and pro-inflammatory activity. Pharmacological targeting of mitophagy using ALT001 prevents mitochondrial damage caused by HSV1 through ULK1/Rab9-mediated pathway. Furthermore, ALT001-induced ULK1/Rab9-dependent mitophagy restricts HSV1 infection by activating interferon-mediated antiviral immunity. Consequently, ALT001 reduces HSV1-triggered neuroinflammation, recovers HSV1-altered microglial phagocytosis for Aβ, and efficiently reverses morphological and molecular abnormalities in HSV1-infected microglia by triggering mitophagy in ES-MG. ALT001 also suppressed HSV1-mediated Aβ accumulation and neurodegeneration in the microglia-neuron co-culture and cerebral organoid model. Conclusions: In this study, we identified a critical molecular link between HSV1 and AD-related microglial dysfunction. Furthermore, our findings provide an evidence that therapeutic targeting of alternative mitophagy via ALT001 effectively interfere with HSV1-induced microglial dysfunction and alleviate neurodegeneration.

Keywords: ALT001; Microglia; alternative mitophagy; herpes simplex virus 1 (HSV1); neurodegeneration.


Conflict of interest statement

Competing Interests: SJO, JY, and OSS have filed a patent regarding ALT001 as an antiviral drug candidate against HSV1. JY is co-founder of Altmedical company. The other authors declare no competing interests.

Figures

Figure 1
Figure 1
HSV1 suppresses mitophagy in human microglia. A, B Human microglial cells HMC3 stably expressing mitochondria-targeted Keima (HMC3-mt-Keima) were infected with HSV1 (MOI 1) for 24 h followed by 20 μM CCCP treatment. Following 2 h period, mitophagy was quantified by flow cytometry (A) and mitochondrial DNA was quantified using genomic DNA, and normalized against 18s ribosomal RNA (18s RNA) (B). C Proteins were extracted from HSV1-infected HMC3 at MOI 1 for 24 h followed by 20 μM CCCP treatment for 2 h. Representative immunoblots of HSV1 ICP0, phospho-ubiquitin (pUB; Ser56), Parkin, phospho-PINK1 (pPINK1), PINK1, mitochondria-encoded cytochrome c oxidase II (COX II), and Actin are shown. Semi-quantification of protein expression by densitometry is shown below the blot. D HMC3 were infected with HSV1 (MOI 1) for 24 h followed by 10 μM chloroquine (CQ) treatment for 8 h. Immunoblot analysis was performed to examine the levels of HSV1 ICP0, p62, LC3, and Actin. E, F HMC3 were transfected with Parkin (PRKN)-GFP (E) or LC3-GFP (F), followed by HSV1 (MOI 1) infection. At 24 hpi, cells were treated with 20 μM CCCP for 2 h. Representative immunofluorescence images showing Parkin (green), LC3 (green) and HSV1 ICP0 (red). Scale bar=10 μm. G Representative immunofluorescence images showing MitoTracker (green) and LysoTracker (red) staining. Scale bar=10 μm. H HMC3 were infected with HSV1 (MOI 1) for 48 h for transmission electron microscopy analysis The number of damaged mitochondria/total mitochondria was quantified. Scale bar=200 nm. I HMC3 were infected with HSV1 (MOI 1) for 48 h and mitochondrial respiration was determined using Cell Mito Stress test kit and analyzed with Seahorse XFp analyzer. OCR=oxygen consumption rate. All data represent the means ± SD of at least three independent experiments. Statistical analysis: one-way ANOVA with Dunnett's post-hoc correction (B) or Student's t-test (H). ***p < 0.001, versus mock (m)-infected and vehicle (Veh)-treated group. ###p < 0.001, versus mock (m)-infected and CCCP-treated group.
Figure 2
Figure 2
HSV1-encoded US3 inhibits PINK1/Parkin-mediated mitophagy. A Representative confocal images of cells expressing both mt-dsRED (red) and US3-GFP (green). Scale bar=10 μm. B Cytosol and mitochondria were fractionated from cells transfected with empty vector (EV)-GFP or US3-GFP and analyzed by immunoblotting to determine the relative levels of GFP-tagged US3 or EV, phospho-PINK1 (pPINK1), Parkin, TOM70, and Actin. Semi-quantification of protein expression by densitometry is indicated below the blot. C HMC3 transfected with EV-GFP or US3-GFP were treated with 10 μM CCCP for 2 h and immunoblot analysis was performed to examine the levels of phospho-ubiquitination (pUB; Ser56), Parkin, pPINK1, PINK1, COX II, GFP-tagged US3 or EV, and Tubulin. D HEK293T were co-transfected with PINK1-V5 or Parkin-MYC along with US3-GFP. Cell lysates were immunoprecipitated using antibodies against PINK1 and MYC-conjugated magnetic beads. E HMC3-mt-Keima transfected with pBHA-US3 plasmid were treated with 20 μM CCCP for 2 h. Mitophagic cells were quantified by flow cytometry. F HMC3 transfected with EV-GFP or US3-GFP were treated with 20 μM CCCP for 2 h and mitochondrial DNA levels were examined using genomic DNA, normalizing against 18s rRNA. G Mitochondrial respiration profiles were determined in cells transfected with EV-GFP or US3-GFP using XFp analyzer. OCR=oxygen consumption rate. H HMC3 were transfected with IP-10 and NF-κB reporter plasmids along with EV-GFP or US3-GFP. Cells were treated with 10 μg/ml Poly(I:C) for 6 h and the results of the luciferase reporter assay was shown. All data represent the means ± SD of at least three independent experiments. Statistical analysis: one-way ANOVA with Dunnett's post-hoc correction. **p < 0.01; ***p < 0.001, versus vehicle (Veh)-treated EV group. ###p < 0.001, versus CCCP or poly I:C-treated EV group.
Figure 3
Figure 3
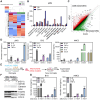
Damaged mitochondria from HSV1-infected microglia induces inflammation. A Primary murine microglia (pMG) were isolated, cultured and infected with mock (m) or HSV1 (MOI 10) for 48 h and bulk RNA sequencing was performed. A hierarchical clustering heatmap represents overall transcriptome signatures. B The number of differentially expressed genes (DEGs) according to GO term analysis; 2-fold upregulated or downregulated DEGs of HSV1-infected pMG compared to m-infected groups (p <0.05). C Scatter plot illustrating 2-fold upregulated (red dot) or downregulated (green dot) DEGs (p <0.05). HM=homeostatic microglia, DAM=disease-associated microglia. D pMG were infected with HSV1 (MOI 10) for 72 h, while BV2 or HMC3 were infected with HSV1 (MOI 1) for 48 h. Secretion levels of pro-inflammatory cytokines/chemokines including interleukin (IL)-6, IL-1β, and tumor necrosis factor (TNF)-α by pMG and BV2 were measured by ELISA. Interferon (IFN)-γ-induced protein 10 (IP-10), TNF-α, IFN-γ, IL-8 and Chemokine (C-C motif) ligand 5 (CCL5) secretion by HMC3 were measured by Luminex. E Experimental scheme showing that mitochondria fractionated from the m- or HSV1-infected cells were added to fresh microglial culture. F Representative immunoblot analysis confirming protein levels of GM130, Calnexin, Actin, TOM70, TOM20, and COX II. G BV2 or HMC3 were treated with mitochondria (Mito) from m- or HSV1-infected cells for 48 h. Secretion levels of IL-6, IL-1β, and TNF-α were examined by ELISA. All data represent the means ± SD of at least three independent experiments. Statistical analysis: Student's t-test. **p < 0.01; ***p < 0.001, versus m-infected group
Figure 4
Figure 4
ALT001 prevents HSV1-induced mitochondrial damage via ULK1/Rab9-mediated mitophagy. A Cell viability assay was performed in ALT001 (ALT)-treated cells for 48 h. B HMC3-mt-Keima were treated with 0, 15, and 30 μM ALT for 24 h and mitophagic cells were examined by both flow cytometry and confocal microscopy. Scale bar=10 μm. C HSV1 (MOI 1) was inoculated in HMC3 or BV2 for 1 h and treated with 30 μM ALT. HeLa were transfected with EV-GFP or US3-GFP for 24 h and treated with 30 μM ALT. Representative immunoblot analysis was shown to assess the levels of phospho-ULK1 (pULK1; Ser 555), ULK1, HSV1 ICP0, TOM20, COX II, Calnexin, GM130, GFP-tagged US3 or EV, and Actin. D Rab9-YFP-expressing HMC3 were infected with HSV1 (MOI 1) or transfected with pBHA-US3. After infection or transfection, cells were treated with 30 μM ALT for 48 h and Rab9 puncta formation was measured by confocal microscopy. Fluorescence intensity was quantified using Zen Desk. Scale bar=5 μm. E HMC3-mt-Keima were infected with HSV1 at MOI 1 for 24 h or transfected with pBHA-US3 followed by 30 μM ALT. Mitophagic cells were examined by flow cytometry. F HSV1 was inoculated in HMC3 at MOI 1 for 1 h and cells were treated with 30 μM ALT. At 48 h, oxygen consumption rate (OCR) was measured by XFp analyzer. G Transmission electron microscopy analysis shows the quantification of damaged mitochondria/total mitochondria. Scale bar=200 nm. All data represent the means ± SD of at least three independent experiments. Statistical analysis: one-way ANOVA with Dunnett's post-hoc correction. *p < 0.05; **p < 0.01; ***p < 0.001, versus mock (m)-infected group. #p < 0.05; ###p < 0.001, versus HSV1-infected group.
Figure 5
Figure 5
ALT001-driven ULK1/Rab9-mediated mitophagy promotes antiviral function against HSV1 by triggering IFN response. A Quantitative RT-PCR was performed to measure HSV1 ICP27 and UL30 transcripts in HSV1 (MOI 1)-infected Vero cells treated with various concentrations of ALT001 (ALT) for 48 h. B HSV-1 ICP0, gB, gD, and Actin levels were quantified by densitometry of immunoblots. C, D HSV1 was inoculated into primary microglia (pMG; MOI 10), BV2 (MOI 1), and HMC3 (MOI 1), and cells were treated with 30 μM ALT. HSV1 ICP27 and UL30 mRNA levels were analyzed by quantitative RT-PCR (C) and infectious viral loads were quantified by plaque assay (D). Statistical analysis: Student's t-test, *p < 0.05; **p < 0.01; ***p < 0.001, versus Vehicle (Veh)-treated group. E A scatter plot indicates ALT treatment in HSV1-infected pMG led to alteration of mRNA expression profiles including upregulation of interferon-signaling-related genes (red dots) and downregulation of pro-inflammatory genes (green dots). F A heatmap represents the expression levels of genes involved in antiviral responses. G The secretion level of IFN-β was measured by ELISA. Statistical analysis: one-way ANOVA with Dunnett's post-hoc correction. *p < 0.05; **p < 0.01; ***p < 0.001, versus Veh-treated mock (m)-infected group. #p < 0.05; ###p < 0.001, versus Veh-treated HSV1-infected group. H Representative immunoblot analysis of HSV1 ICP0, phospho-STING (pSTING), STING, phospho-TBK1 (pTBK1), TBK1, phospho-IRF3 (pIRF3), IRF3, and Actin. I, J ULK1 or Rab9 knockdown in HMC3 was introduced by shRNAs or siRNAs and cells were infected with HSV1 in the presence or absence of 30 μM ALT. At 48 hpi, quantitative RT-PCR was performed to examine the transcript levels of HSV ICP27 (I) and ELISA was performed to examine the secretion levels of IFN-β (J). All data represent the means ± SD of at least three independent experiments. Statistical analysis: one-way ANOVA with Dunnett's post-hoc correction. *p < 0.05; **p < 0.01; ***p < 0.001, versus control shRNA (Ctl)-transfected Veh-treated group. #p < 0.05; ###p < 0.001, Ctl-transfected ALT-treated group.
Figure 6
Figure 6
ALT001 mitigates microglia-mediated inflammation during HSV1 infection and alters transcriptional and morphological features in HSV1-infected microglia. A Primary microglia (pMG) were infected with mock (m) or HSV1 (MOI 10) in the presence or absence of 30 μM ALT001 (ALT) and bulk RNA sequencing was performed. A schematic overview of the experimental design is shown (upper panel) and principal component analysis was applied to score similarity of data sets (lower panel). B Venn diagram depicts overlapping and unique differentially expressed genes (DEGs) in HSV1-infected pMG treated with ALT. C A scatter plot indicates ALT treatment in HSV1-infected pMG led to alteration of mRNA expression profiles including upregulation of HM-related DEGs (red dots) and downregulation of DAM-related DEGs (green dots). D Heatmap showing expression profiles of microglia state-related genes E, F HSV1 was inoculated into pMG (MOI 10; E) or HMC3 (MOI 1; F) and cells were treated with various doses of ALT001. ELISA was performed to examine the secretion levels of IL-6, IL-8, IL-1β, and TNF-α. UD=undetermined. G, H pMG were infected with HSV1 (MOI 10) and treated with 30 μM ALT. At 48 hpi, cells were stained with CD45 for flow cytometry (G) and stained with IBA1 (green) for confocal microscopy (H). Dysmorphic microglia/total cells were counted using at least 50 images and the graph on the right panel shows % dysmorphic microglia. Red asterisks represent dysmorphic microglia. Scale bar=20 μm. I Microglia morphology was quantified using semi-automated software analysis (IMARIS). Microglia surface area, surface volume, filaments length and number of branch points were analyzed. Scale bar=10 μm. All data represent the means ± SD of at least three independent experiments. Statistical analysis: one-way ANOVA with Dunnett's post-hoc correction. *p < 0.05; **p < 0.01; ***p < 0.001, versus vehicle (Veh)-treated m-infected group. #p < 0.05; ##p < 0.01; ###p < 0.001, versus Veh-treated HSV1-infected group.
Figure 7
Figure 7
ALT001 restores HSV1-altered microglial phagocytosis for Aβ. A HSV1 were inoculated in primary microglia (pMG; MOI 10), BV2 (MOI 1), and HMC3 (MOI 1) for 24 or 48 h. After HSV1 infection, GFP-labeled Escherichia coli (E. coli) bioparticles were added to the cells and incubated for 1 h. Phagocytosed E. coli is presented in the graph. B Cells were infected with HSV1 at various MOIs and incubated with fluorescent microspheres (6 µm) for 1 h. Phagocytosis of the microspheres was quantified by flow cytometry. C pMG (MOI 10), BV2 (MOI 1), and HMC3 (MOI 1) were infected with HSV1 followed by treatment with various concentrations of ALT for 48 or 72 h, and cells were incubated with fluorescent microspheres (6 µm) for 1 h. Phagocytosis was quantified by flow cytometry. D HSV1 (MOI 1) were inoculated into HMC3 transfected with ULK1 and Rab9-specific siRNAs and cells were treated with 30 μM ALT. At 48 hpi, cells were incubated with fluorescent microspheres (6 µm) for 1h and phagocytosis was analyzed by flow cytometry. E Intracellular CD68 expression was analyzed by flow cytometry. F Surface expression of phagocytic receptors such as CD14, CD36, and TREM2 was analyzed by flow cytometry. The data are presented by representative histograms. G A schematic representation of microglia-mediated phagocytosis assay for oligomeric Aβ42 (oAβ42). H HSV1 was inoculated into BV2 and HMC3 at MOI 1 for 1 h and cells were treated with various doses of ALT. At 48 hpi, cells were treated with oAβ42 for 8 h and remaining oAβ42 was stained with Thioflavin T dye for flow cytometry analysis. All data represent the means ± SD of at least three independent experiments. Statistical analysis: one-way ANOVA with Dunnett's post-hoc correction. *p < 0.05; **p < 0.01; ***p < 0.001, versus mock (m)-infected group. #p < 0.05; ##p < 0.01; ###p < 0.01, versus HSV1-infected group.
Figure 8
Figure 8
ALT001 improves HSV1-altered microglial mitophagy and phagocytosis in human embryonic stem cell-derived microglia. A Schematic representation of differentiation of human embryonic stem cell-derived microglia (ES-MG). B Embryonic stem cells (ESC), microglial progenitors (25 days post-differentiation), and ES-MG (32 days post-differentiation) were stained with antibodies against CD14 and CX3CR1 and analyzed by flow cytometry. C HSV1 was inoculated into ES-MG (MOI 10) and cells were treated with 30 μM ALT001 (ALT). At 48 hpi, cells were stained with MitoTracker (MitoT) and LysoTracker (LysoT) to visualize mitolysosomes and analyzed by confocal microscopy. Scale bar =10 μm. D HSV1 was inoculated into ES-MG (MOI 10) and cells were treated with 30 μM ALT. At 48 hpi, infectious viral loads were quantified by plaque assay using supernatants. E, F HSV1 was inoculated into ES-MG (MOI 10) and cells were treated with 30 μM ALT. At 48 hpi, the secretion levels of IL-6, IL-8, and TNF-α were examined by ELISA (E) and cells were stained with CD45 for flow cytometry (F). G, H ES-MG were infected with HSV1 (MOI 10) followed by 30 μM ALT treatment for 48 h. Cells were incubated with fluorescent microspheres (6 µm) for 1 h (G) or oligomeric Aβ42 (oAβ42) for 8 h (H). Uptake of fluorescent microspheres or remaining oAβ42 stained with Thioflavin T was quantified by flow cytometry. All data represent the means ± SD of at least three independent experiments. Statistical analysis: one-way ANOVA with Dunnett's post-hoc correction. *p<0.05; **p<0.01; ***p < 0.001, versus vehicle (Veh)-treated mock (m)-infected group. #p < 0.05; ##p < 0.01; ###p < 0.001, versus Veh-treated HSV1-infected group.

References

    1. Borst K, Dumas AA, Prinz M. Microglia: Immune and non-immune functions. Immunity. 2021;54:2194–208. - PubMed
    1. Prinz M, Jung S, Priller J. Microglia Biology: One Century of Evolving Concepts. Cell. 2019;179:292–311. - PubMed
    1. Paolicelli RC, Sierra A, Stevens B, Tremblay ME, Aguzzi A, Ajami B. et al. Microglia states and nomenclature: A field at its crossroads. Neuron. 2022;110:3458–83. - PMC - PubMed
    1. Cserep C, Posfai B, Lenart N, Fekete R, Laszlo ZI, Lele Z. et al. Microglia monitor and protect neuronal function through specialized somatic purinergic junctions. Science. 2020;367:528–37. - PubMed
    1. Keren-Shaul H, Spinrad A, Weiner A, Matcovitch-Natan O, Dvir-Szternfeld R, Ulland TK. et al. A Unique Microglia Type Associated with Restricting Development of Alzheimer's Disease. Cell. 2017;169:1276–90. e17. - PubMed

MeSH terms

Substances