. 2025 Apr 13;15(11):5358-5380.
doi: 10.7150/thno.107162. eCollection 2025.

Magnetic sculpture-like tumor cell vaccines enable targeted in situ immune activation and potent antitumor effects

Affiliations

Magnetic sculpture-like tumor cell vaccines enable targeted in situ immune activation and potent antitumor effects

Heng Zhang et al. Theranostics. .

Abstract

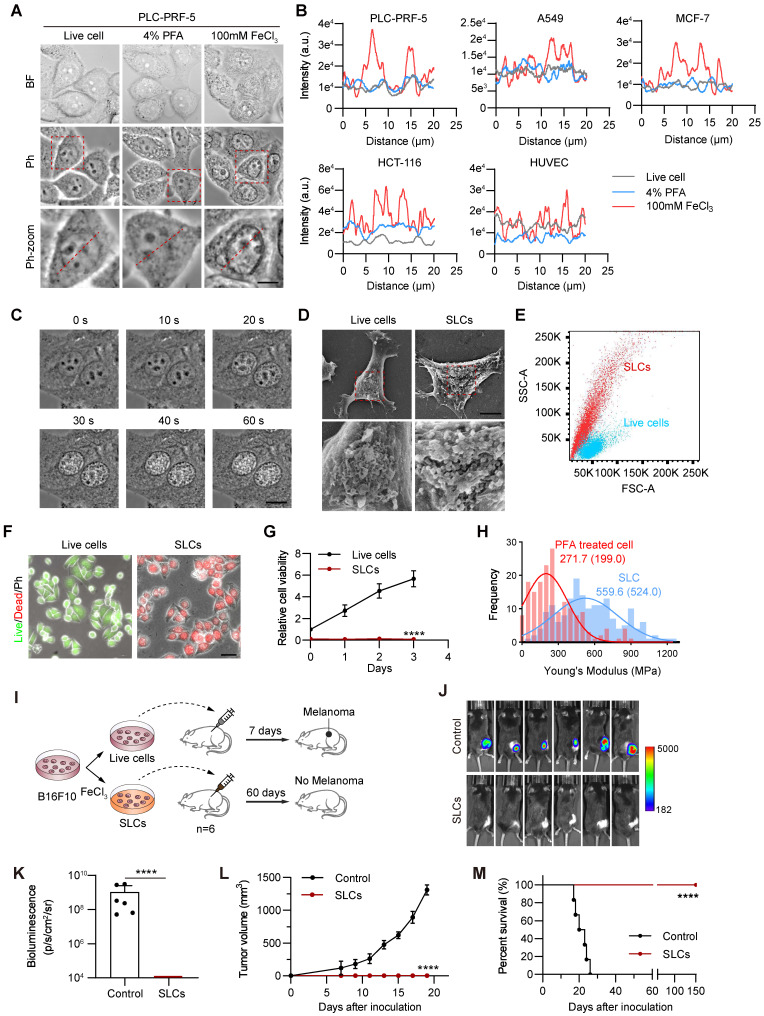
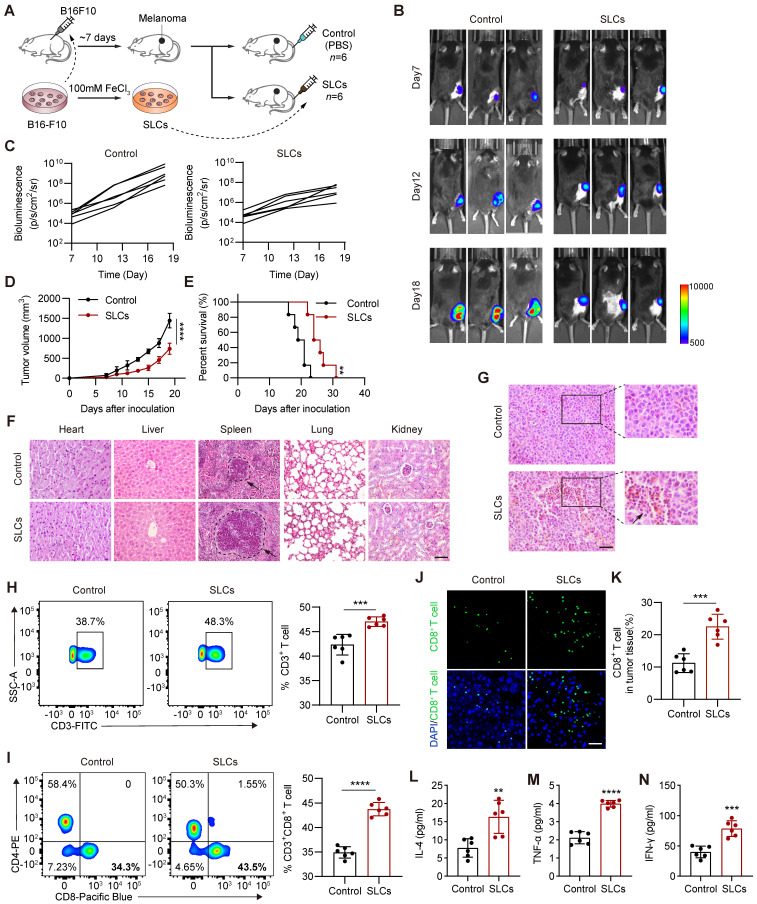
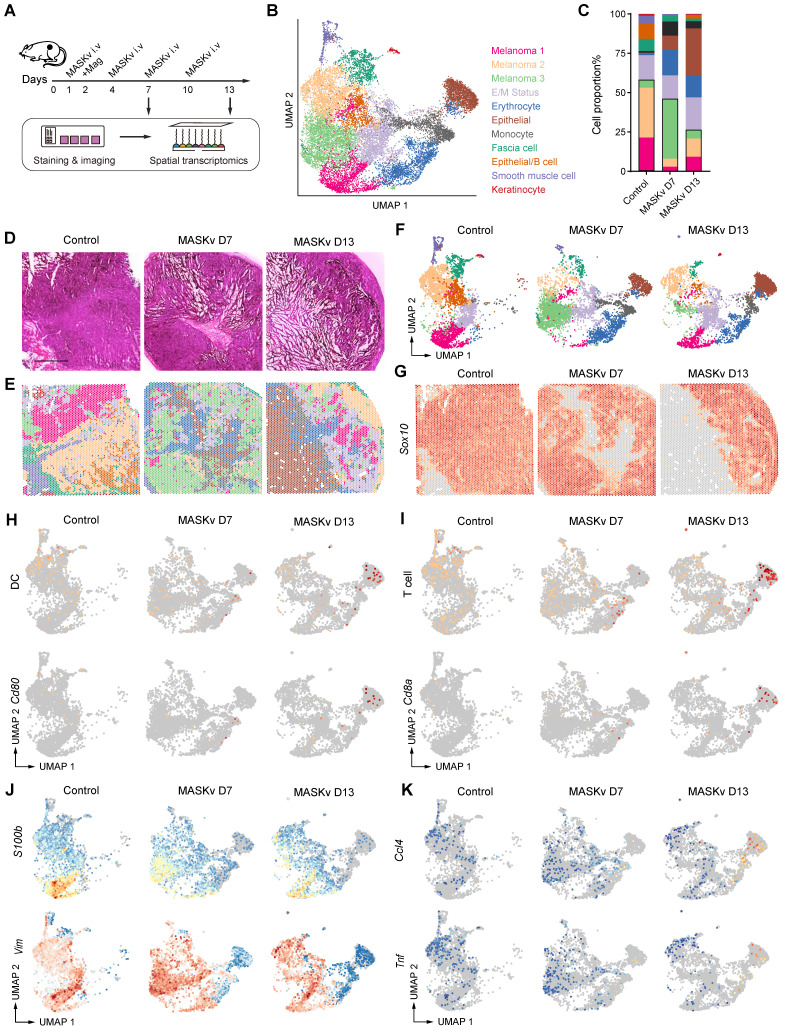
Rationale: Tumor cells are ideal candidates for developing cancer vaccines due to their antigenic profiles, yet existing whole-cell vaccines lack efficacy. This study aimed to develop a novel whole-cell vaccine platform that combines immunogenicity, structural integrity, and tumor-targeting capabilities. Methods: We created "Magnetic Sculpture-like (MASK) Cells" by treating tumor cells with high-concentration FeCl3, inducing rapid morphological fixation without traditional chemical crosslinking. MASK cells were characterized for proliferative capacity, biomolecule retention, and magnetic properties. Vaccine efficacy was tested in vitro, in melanoma-bearing mouse models, and through spatial transcriptomic profiling of tumor microenvironments. Combination therapy with anti-PD-1 was further evaluated. Results: MASK cells lose proliferative ability but retain biomolecules and architecture. MASK cells promote dendritic cell maturation and T cell responses against tumors. Vaccines combining MASK cells and adjuvant potently suppress melanoma growth. Uniquely, FeCl3 sculpting imparts magnetism to cells, enabling directional navigation to tumors using magnetic fields and enhanced in situ immune activation. Spatial transcriptomics reveals DC and T cell activation and tumor cytotoxicity after MASK vaccination. Combined with anti-PD-1, MASK cell vaccines strongly inhibit growth and improve survival. Conclusion: MASK cells represent a promising new approach for targeted, patient-specific anti-tumor therapeutics.

Keywords: Immunotherapy; Magnetic Sculpture-like cell.; Whole-cell vaccines.


Conflict of interest statement

Competing Interests: The authors have declared that no competing interest exists.

Figures

Figure 1
Figure 1
Characterization of Sculpture-Like Cells after treatment with 100 mM FeCl3. (A) Representative bright field (top) and phase contrast (middle) microscopy images of PLC-PRF-5 cells treated with PBS, 4% paraformaldehyde, or 100 mM FeCl3. The red dashed box represents a magnified view of the phase contrast microscopy image. Scale bar, 5 µm. (B) Density plot of the red dashed area in the magnified image of phase contrast images in (A) and four additional cell lines. (C) High speed live cell imaging of PLC-PRF-5 cells treated with 100 mM FeCl3 under a phase contrast microscope. The time interval between each picture is 20 s. Scale bar, 10 µm. (D) Scanning electron microscopy (SEM) images of PLC-PRF-5 live cell or cell after treatment with FeCl3. Scale bar, 5 μm. (E) Flow cytometric analysis of PLC-PRF-5 live cells and cells treated with FeCl3. FSC, forward scatter; SSC, side scatter. (F) Cell viability analysis of living cells and cells treated with FeCl3 was performed using the Calcein/PI Cell Viability kit. Calcein AM: living cells; PI (propidium iodide): dead cells. Scale bar, 30 μm. (G) Relative cell viability (%) analysis of live cells and FeCl3 treated cells (n = 3) by CCK8 assay. (H) Histograms and Gaussian fitting line of the Young's modulus of PFA treated cell and SLC (n = 3, collected point = 174). The values represent the mean value of cell's elasticity, and the values in parentheses represent the highest values of the Gaussian fitting line. (I) Schematic diagram of experimental design. (J-K) Representative images of bioluminescence signal (J) showing in vivo proliferation of luciferase-labeled 3×10⁶ B16F10 viable cells and SLCs in C57BL/6 mice after inoculation on day 19 (n = 6) and quantification of bioluminescence signal (p/s/cm2/sr) is shown (K), n = 6, biological replicates. (L) Tumor volume of mice after challenge with live cells or SLCs (n = 6). (M) Kaplan--Meier survival curves of the mice of different treatment groups (n = 6). Data represent means ± S.D, and were analyzed by two-tailed unpaired t tests with GraphPad Prism software, ****P < 0.0001.
Figure 2
Figure 2
SLCs activate immunity in vivo and exert anti tumor effects. (A) Schematic of model construction and in vivo treatment of SLCs. Seven days after C57BL/6 mice were subcutaneously inoculated with tumor cells, SLCs were injected intravenously (i.v.) once every three days for a total of three times. Organ and tumor tissues were collected on day 19 to analyze immune responses. (B) Representative bioluminescence images and quantitative bioluminescence (C) of mice in different treatment groups (n = 6). (D) Tumor volumes were recorded every two days until day 19 (n = 6). (E) Kaplan--Meier survival curves of the mice of different treatment groups (n = 6). (F) HE staining of hearts, livers, spleens, lungs and kidneys. Scale bar, 100 µm. (G) HE staining of tumor tissue. Scale bar, 50 µm. (H-I) Representative flow cytometry data for frequency (left) and quantification (right) of tumor infiltrating CD3+ T cells (H) or CD3+ CD8+ T cells (I) (n = 6). (J-K) Immunofluorescence staining of CD8+ cells (green) in tumor tissue collected on day 19. (J) and quantification of CD8+ cells per field of view (n = 6) (K). Scale bar, 30 μm. (L-N) Serum samples were isolated on day 19 and cytokine levels IL-4 (L), TNF-α (M), IFN-γ (N) were determined by ELISA assay (n = 6). Data represent analyses of the indicated n mice per group, means ± S.D, and were analyzed by two-tailed unpaired t tests with GraphPad Prism software. **P < 0.01; ***P < 0.001; ****P < 0.0001.
Figure 3
Figure 3
SLCs promote DC maturation, differentiation and antigen presentation. (A) Schematic of SLCs activating DCs in vitro. (B-C) Flow cytometric detection of untreated DCs or DCs treated with SLCs in vitro, representative flow cytometry images (B) and mean fluorescent intensity (MFI) (C) of DCs mature differentiation markers CD40, CD80, CD86, MHCII. (D) Schematic of in vitro killing assay of CD8+ T cells. CD8+ T cells isolated from the spleens of C57BL/6 mice were mixed with BMDCs at a 2:1 ratio and incubated with B16F10-GFP cells, with or without the indicated cell amounts of SLCs for 24 h. (E-F) Flow cytometry analysis showing the proportion of live B16F10-GFP cells after various treatments. In panel (E), data for each group are presented as mean ± standard deviation (n = 6); ****P < 0.0001 was determined using a two-tailed unpaired t-test. Panel (F) displays representative flow cytometry images.
Figure 4
Figure 4
Enhanced antitumor immunotherapy efficacy of SLC vaccine. (A) Schematic of model construction and in vivo treatment. C57BL/6 mice were subcutaneously inoculated with Tumor cells for 7 days and then intravenously injected (i.v.) with PBS, Adjuvant (MPLA, 20 μg/mouse), SLCs (1 × 10⁶), or SLCV (combined treatment with MPLA and SLCs) every three days, 3 times in total. Tumor tissues were collected on day 19 to analyze the immune response (n = 6). (B) Representative bioluminescence images and quantitative bioluminescence (C) of mice in different treatment groups (n = 6). (D) Tumor volumes were recorded every two days until day 19 (n = 6). (E) Kaplan-Meier survival curves of the mice of different treatment groups (n = 6). (F-G) Representative flow cytometry data for frequency (F) and quantification (G) of tumor infiltrating CD8+ T cells (n = 6). Data represent analyses of the indicated n mice per group, means ± S.D, and were analyzed by one-way two-sided ANOVA with GraphPad Prism software. *P < 0.05; **P < 0.01; ***P < 0.001; ****P < 0.0001. (H-K) Long-term immune memory effects of SLC vaccine treatment. (H) Schematic representation of tumor rechallenge. B16F10 cells were injected subcutaneously into the right side of C57BL/6 mice to inoculate the first tumor. When the tumor volume reaches 80-100 mm3, the tumors were completely removed after three rounds of treatment with Adjuvant or SLCV. Thirty days after the first tumor was completely excised from the mice, B16F10 cells were again inoculated on the contralateral side to form a second tumor. (I) Tumor growth of the rechallenged tumors was recorded. (J) Flow cytometric analysis of representative CD8⁺ T cells and memory T cell markers CD62L and CD44 in splenic lymphocytes (gated on CD3+ cells) in mice before they were rechallenged to secondary tumors, and quantification of TEM (K) and TCM (L) in the spleen (n = 3). Data represent means ± S.D, and were analyzed by two-tailed unpaired t tests with GraphPad Prism software. ns, not significant, P > 0.05; *P < 0.05.
Figure 5
Figure 5
Magnetic Sculpture-like (MASK) cells enhance vaccine efficacy through their enrichment in tumors. (A) Digital photographs depicting SLCs before and after 10 min of magnetic field attraction (magnet force = 0.2 T) (B) Magnetic hysteresis curves of Fe3O4 and SLCs at ± 4e4 (oe). (C) The fold enrichment of DNA, RNA, and protein extracted from MASK cells after magnetic attraction compared to control cells (n = 6). (D) Schematic of model construction and magnetic targeted therapy. C57BL/6 mice were subcutaneously inoculated with tumor cells for 7 days, then intravenously (i.v.) injected with PBS or MASKv (combined treatment with MPLA 20 μg/mouse and 1 × 10⁶ MASK cells) every three days for a total of three times, and the tumor tissues were collected on day 19 to analyze the immune response. For MASKv+mag group, an N35 grade NdFeB circular magnet, 8 mm in diameter and 2 mm thick, which we attached to the tumor site with adhesive tape (n = 6). (E) Representative bioluminescence image (left) and in vivo distribution image of DiR-labeled MASK cells (right) after the first magnetic targeting treatment. (F) Image of resected tumor at endpoint and (G) tumor weight of resected tumor (n = 6). Scale bar: 1 cm. (H) Kaplan--Meier survival curves of the mice of different treatment groups (n = 6). (I) HE staining of tumor tissue collected on day 19, immunohistochemical staining of CD8+ cells and Ki67. Scale bars, 50 μm. (J-K) IHC score of immunohistochemical staining for CD8 (J) and Ki67(K) (n = 6). (L-M) Representative flow cytometry figures (L) and quantification (M) of tumor infiltrating CD8+ T cells of mice. Data represent analyses of the indicated n mice per group, means ± S.D, and were analyzed by one-way two-sided ANOVA with GraphPad Prism software. ns, not significant, P > 0.05; *P < 0.05; **P < 0.01; ***P < 0.001; ****P < 0.0001.
Figure 6
Figure 6
Spatial transcriptomics of the structural heterogeneity of Tumors and TME in response to magnetic MASK vaccine treatment. (A) Graphical overview of spatial transcriptomics experimental design. (B) Uniform manifold approximation and projection (UMAP) plots of integrated ST spots from the tumor tissues of Control, MASKv D7 and MASKv D13. (C) Bar graph showing the proportion of each cell cluster in each sample in the ST dataset. (D) H&E staining of three tumor tissue samples, and (E) unbiased cluster analysis of ST spots. (F) UMAP plots of ST spots for three tumor tissue samples, respectively. (G) The spatial feature maps illustrate the spatial expression of Sox10 in each tumor tissue. (H-I) The spatial expression maps of dendritic cell markers (CD40, CD80, CD86) and CD80 in tumor tissues (H), and T cell markers (CD3E, CD3G, CD8A, IKZF2, THY1) as well as CD8A in tumor tissues (I). (J) The spatial expression maps of Vimentin and S100B in tumor tissues of different treatment groups. (K) The spatial expression maps of CCL4 and TNF in tumor tissues of different treatment groups.
Figure 7
Figure 7
MASK vaccine combined with PD-1 inhibitor enhances the efficacy of ICB immunotherapy. (A) Representative bioluminescence images and quantitative bioluminescence (B) of mice in different treatment groups. (C) Tumor volumes were recorded every two days until day 19. (D) Kaplan-Meier survival curves of the mice of different treatment groups. (E-F) Representative flow cytometry data (E) and quantification (F) of tumor infiltrating CD8+ T cells. (G-H) Representative flow cytometry data (G) and quantification (H) of IFN-γ+ CD8+ T cells. (I-J) Representative flow cytometry data (I) and quantification (J) of TNF-α+ CD8+ T cells. (K) Immunohistochemical staining of CD8+ cells. Scale bar, 50 μm, and IHC score (L) of CD8 (n=6). Data represent analyses of the indicated 6 mice per group, means ± S.D, and were analyzed by one-way two-sided ANOVA with GraphPad Prism software. ns, not significant, P > 0.05; **P < 0.01; ***P < 0.001; ****P < 0.0001.

Similar articles

References

    1. Saxena M, van der Burg SH, Melief CJM, Bhardwaj N. Therapeutic cancer vaccines. Nat Rev Cancer. 2021;21:360–78. - PubMed
    1. Kim YJ, Ko MJ, Park BC, Moon JH, Jeon YS, Park HS. et al. Association between Cell Microenvironment Altered by Gold Nanowire Array and Regulation of Partial Epithelial-Mesenchymal Transition. Advanced Functional Materials. 2021;31:2008758.
    1. Zeng F, Pan Y, Wu M, Lu Q, Qin S, Gao Y. et al. Self-Metallized Whole Cell Vaccines Prepared by Microfluidics for Bioorthogonally Catalyzed Antitumor Immunotherapy. ACS Nano. 2024;18:7923–36. - PubMed
    1. Zeng F, Pan Y, Lu Q, Luan X, Qin S, Liu Y. et al. Self-Generating Gold Nanocatalysts in Autologous Tumor Cells for Targeted Catalytic Immunotherapy. Adv Healthc Mater. 2024;13:e2303683. - PubMed
    1. Gupta RG, Li F, Roszik J, Lizee G. Exploiting Tumor Neoantigens to Target Cancer Evolution: Current Challenges and Promising Therapeutic Approaches. Cancer Discov. 2021;11:1024–39. - PMC - PubMed

Substances