. 2025 Mar 3;12(6):uhaf072.
doi: 10.1093/hr/uhaf072. eCollection 2025 Jun.

Root-specific expression of CsNPF2.3 is involved in modulating fluoride accumulation in tea plant (Camellia sinensis)

Affiliations

Root-specific expression of CsNPF2.3 is involved in modulating fluoride accumulation in tea plant (Camellia sinensis)

Huiliang Niu et al. Hortic Res. .

Abstract

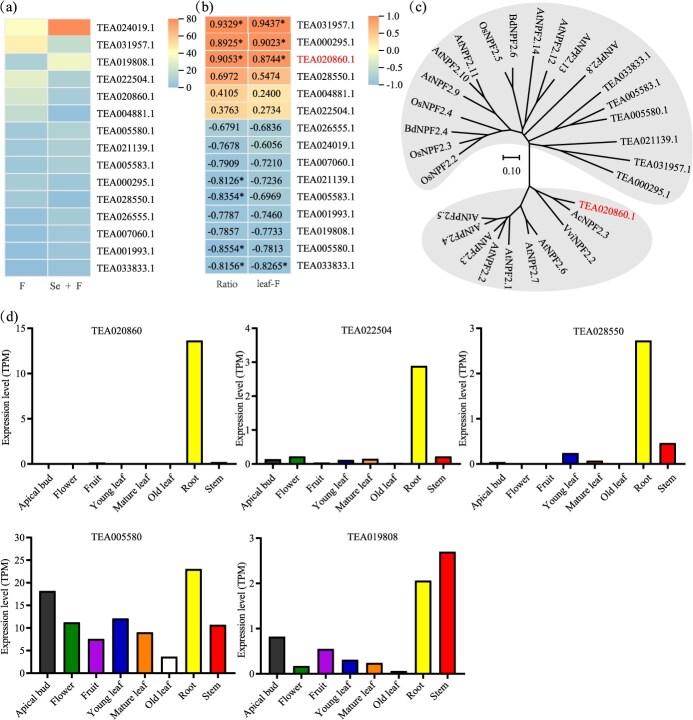
Fluoride (F) is a nonessential but potentially harmful element for plants, especially when present in excess. The tea plant is known for its ability to hyperaccumulate F from the soil and eventually accumulates in the leaves; however, how the tea plant transports F to the leaves remains unclear. Here, we found that Se can significantly decrease the transport efficiency of F from root to leaf. Therefore, RNA-Sequencing was performed on tea roots cotreated with selenite and fluoride, and then we isolated a plasma membrane-localized F transporter CsNPF2.3 from tea plant roots and examined its role in transport of F in tea plants. The results showed that CsNPF2.3 exhibited F transport activity when heterologously expressed in yeast. Expression pattern analysis revealed that CsNPF2.3 is expressed in epidermal cells, cortex cells, and xylem parenchyma cells in roots. Overexpression of CsNPF2.3 in tea roots significantly increased F content in the root, stem, and leaf, and enhanced the transport efficiency of F from root to leaf. Furthermore, in nine tea cultivars, CsNPF2.3 expression in the root was significantly positively correlated with F content in the leaf and root, and the transport efficiency of F from root to leaf. Altogether, these findings suggest that CsNPF2.3 was involved in uptake and transport of F in tea plants.


Conflict of interest statement

The authors declare no competing financial interests.

Figures

Figure 1
Figure 1
F accumulation, uptake, and translocation in tea plants after F and Se + F treatment. (a), (b), (c), and (d) represent F content in leaf, stem, shoot (leaf + stem), and root, respectively. (e) F uptake by root in tea plant. (f) The ratio of F concentration in the leaf and root. The ratio served as an indicator of the transport efficiency of F from root to leaf. CK is the control group (no F). F is the fluoride treatment group. Se + F is the cotreatment of selenium and fluorine. The data presented are represented as means ± standard deviation (SD) with a sample size of n = 3. Different letters are used to indicate significant differences at the P < 0.05 level.
Figure 2
Figure 2
Analysis of DEGs in tea plant roots under F and Se + F treatment. (a) The expression levels of DEGs under F and Se + F treatment in tea plant roots. (b) Pearson correlation analysis between DEG expression and F transport efficiency (ratio), and leaf F content. The ratio served as an indicator of the efficiency of F transport from root to leaf. The leaf-F was F content in leaves. The numbers in the figure represented the correlation coefficients between DEG expression levels and F transport efficiency (root-to-leaf), and leaf F content. ‘*’ indicates significant difference at P < 0.05. (c) Phylogenetic tree of CsNPF2.3 with NPF2s in A. thaliana (At), O. sativa (Os), V. vinifera (Vvi), Actinidia chinensis (Ac), and B. distachyon (Bd). The phylogenetic tree was constructed using MEGA11 with Neighbor-Joining method. The scale showed substitution distance. (d) Expression levels of DEGs encoding nitrate transporter family in eight tissues in tea plants. The data are sourced from the Tea Tree Genome website (Tea Plant Information Archive (TPIA): A comprehensive knowledge database for tea plant (teaplants.cn)).
Figure 3
Figure 3
Expression pattern and subcellular localization of CsNPF2.3. (a) Relative expression level of CsNPF2.3 in different tissues of tea plants. (b) Relative expression level of CsNPF2.3 under different F concentration treatment for 24 h. (c–d) Relative expression level of CsNPF2.3 with different time under 0.26 and 1.05 mM F treatment, respectively. (e–g) In situ PCR analysis of CsNPF2.3 in tea root. (e) Negative control. (f) Expression location of CsNPF2.3. (g) The magnified areas of the red box in (f). The stained area represents cells of gene expression. Ep, epidermis; Co, cortex; En, endodermis; Ph, phloem; Xy, xylem. (h) Subcellular localization of CsNPF2.3 in epidermal cells of tobacco. Fluorescence signals from GFP, mCherry, and the merged and bright-field images are shown. All data are means ± SD, at least three biological replicates (n ≥ 3). Bars in (e) are 0.5 μm, 1 mm in (f, g), and 25 μm in (h).
Figure 4
Figure 4
F transport activity of CsNPF2.3. (a) The yeast strain BY4743 transformed with pDR196 or CsNPF2.3 was serially diluted and grown on the YPD media containing 0 or 40 mM F for 5 days. (b) and (c) were the growth rates of yeast strains in liquid YPD medium containing 0 and 40 mM F, respectively. ‘ns’ indicated no significant difference. ‘*’ and ‘**’ indicated significant differences at the P < 0.05 and P < 0.01 level between pDR196 and CsNPF2.3 at the same time. (d) F content in yeast cells transformed with pDR196 or CsNPF2.3. Yeast cells were incubated in liquid YPD containing 0, 0.1, or 0.5 mM F for 24 h, and the F content in yeast cells was measured. ‘ns’ indicated no significant difference. ‘*’ and ‘**’ indicated significant differences at the P < 0.05 and P < 0.01 level between pDR196 and CsNPF2.3 at the same F concentration, respectively. All data are means ± SD, at least three biological replicates (n ≥ 3).
Figure 5
Figure 5
Functional characterization of CsNPF2.3 in hairy roots of tea plants. (a) Representative images of transgenic tea hairy roots expressing CsNPF2.3 and empty vector. White arrows indicated the hairy roots. (b) Relative expression level of CsNPF2.3 in EV and CsNPF2.3 hairy roots. The relative expression levels were computed through the 2-ΔΔCT method. (c) F content of primary roots in EV and CsNPF2.3 tea plant. (d) F content of stems in EV and CsNPF2.3 tea plant. (e) F content of leaf in EV and CsNPF2.3 tea plant. (f) The ratio of F content in leaves and roots in EV and CsNPF2.3 tea plant. ‘EV’ represented the tea hairy roots line of transgenic empty vector. ‘35S::CsNPF2.3’ represented the activation of CsNPF2.3 gene expression with CaMV 35S as the promoter. OE-1 and OE-2 represented the overexpression of CsNPF2.3 in transgenic hairy root system, respectively. ‘*’ and ‘**’ indicated significant differences at the P < 0.05 and P < 0.01 level, respectively. All data are means ± SD, at least three biological replicates (n ≥ 3).
Figure 6
Figure 6
Analysis of CsNPF2.3 expression and F content in different tea plant cultivars. (a) Relative expression level of CsNPF2.3 in tea roots. Relative expression was represented with 2-ΔCT. (b) F content in tea leaves. (c) F content in tea roots. (d), Ratio of F content in leaf and root. (e) Pearson correlation analysis between the relative expression of CsNPF2.3 and F content in tea leaves. (f) Pearson correlation analysis between the relative expression of CsNPF2.3 and F content in tea roots. (g) Pearson correlation analysis between the relative expression of CsNPF2.3 and ratio of F content in leaf and root. Longjing 43, LJ43; Mingke 1, MK1; Wancha 6, WC6; Huangguanyin, HGY; Echa 4, EC4; Jiaming 1, JM1; Fuding Dabaicha, FDDBC; Zhenong 113, ZN113; Dangui, DG. All data are means ± SD, at least three biological replicates (n ≥ 3).

Similar articles

References

    1. Wang M, Wang H, Lei G. et al. Current progress on fluoride occurrence in the soil environment: sources, transformation, regulations and remediation. Chemosphere. 2023;341:139901 - PubMed
    1. De A, Mridha D, Ray I. et al. Fluoride exposure and probabilistic health risk assessment through different agricultural food crops from fluoride endemic Bankura and Purulia Districts of West Bengal, India. Front Environ Sci. 2021;9:713148
    1. Koblar A, Tavčar G, Ponikvar-Svet M. Fluoride in teas of different types and forms and the exposure of humans to fluoride with tea and diet. Food Chem. 2012;130:286–90
    1. Das S, De Oliveira LM, Da Silva E. et al. Fluoride concentrations in traditional and herbal teas: health risk assessment. Environ Pollut. 2017;231:779–84 - PubMed
    1. Rodrigues AA, Vasconcelos-Filho SC, Mendes GC. et al. Fluoride in simulated rain affects the morphoanatomy and physiology of Eugenia dysenterica (Mart.) DC. Ecol Indic. 2017;82:189–95

LinkOut - more resources