. 2025 Apr 13;22(9):2208-2226.
doi: 10.7150/ijms.109493. eCollection 2025.

Analysis of the Relationship Between NF-κB1 and Cytokine Gene Expression in Hematological Malignancy: Leveraging Explained Artificial Intelligence and Machine Learning for Small Dataset Insights

Affiliations

Analysis of the Relationship Between NF-κB1 and Cytokine Gene Expression in Hematological Malignancy: Leveraging Explained Artificial Intelligence and Machine Learning for Small Dataset Insights

Jae-Seung Jeong et al. Int J Med Sci. .

Abstract

This study measures expression of nuclear factor kappa B (NF-κB)1 and related cytokine genes in bone marrow mononuclear cells in patients with hematological malignancies, analyzing the relationship between them with an integrated framework of statistical analyses, machine learning (ML), and explainable artificial intelligence (XAI). While traditional dimensionality reduction techniques-such as principal component analysis, linear discriminant analysis, and t-distributed stochastic neighbor embedding-showed limited differentiation embedding, ML classifiers (k-Nearest Neighbors, Naïve Bayes Classifier, Random Forest, and XGBoost) successfully identified critical patterns. Notably, normalized caspase-1 counts consistently emerged as the most influential feature associated with NF-κB1 activity across disease groups, as highlighted by SHapley Additive exPlanations analyses. Systematic evaluation of ML performance on small datasets revealed that a minimum sample size of 15-24 is necessary for reliable classification outcomes, particularly in cohorts of acute myeloid leukemia and myelodysplastic syndrome. These findings underscore the pivotal role of caspase-1 to the NF-κB1 gene expression in hematologic malignancy diseases. Furthermore, this study demonstrates the feasibility of leveraging ML and XAI to derive meaningful insights from limited data, offering a robust strategy for biomarker discovery and precision medicine in rare hematological malignancies.

Keywords: NF-κB / Hematological Malignancy / Machine Learning Classifiers / Explainable Artificial Intelligence / Small Data Adaptation.


Conflict of interest statement

Competing Interests: The authors have declared that no competing interest exists.

Figures

Figure 1
Figure 1
Pie chart of group distributions. (A) Comparison between “Disease” (combining groups 1 to 4) and “Control” groups. (B) Detailed breakdown of the “Disease” category into its constituent groups. Abbreviations: MPN, myeloproliferative neoplasm; PCN, plasma cell neoplasm; MDS, myelodysplastic syndrome; AM, acute myeloid leukemia.
Figure 2
Figure 2
Flowchart of the study highlighting the three main phases: data preparation, analysis, and interpretation.
Figure 3
Figure 3
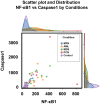
Scatter plot and marginal density distributions of caspase-1 and NF-κB1 normalized counts across the five patient groups (MPN, AML, MDS, PCN, and Control). The scatter plot highlights intergroup differences, while the marginal density plots provide an overview of the parameter distributions within each group, emphasizing the overlapping trends and variability among the groups. Abbreviations: AML, acute myeloid leukemia; MDS, myelodysplastic syndrome; MPN, myeloproliferative neoplasm; PCN, plasma cell neoplasm
Figure 4
Figure 4
(A) Pearson correlation heatmap illustrating the relationships between NF-κB1 and other cytokine genes. Caspase-1 normalized counts demonstrates the strongest correlation with NF-κB1 normalized counts (r = 0.79). (B) Correlation coefficients (Spearman, Pearson, and Kendall) between NF-κB1 and caspase-1 normalized counts across the five patient groups. The MPN group shows consistently strong correlations across all methods, highlighting the robust interaction between these two features.
Figure 5
Figure 5
A comparison of the normalized counts of NF-κB1 (A), caspase-1 (B), BAX (C), and NGAL (D) in BM mononuclear cells of the hematological malignancy and control groups. The control group comprises patients with normal BM. (A) NF-κB1 normalized counts in the MPN and control groups are statistically lower than those in the AML, MDS, and PCN groups. (B) Caspase-1 normalized counts in the MPN and control groups are statistically lower than those in the MDS group. (C) BAX normalized counts in the control group are statistically lower than those in the AML group. (D) NGAL normalized counts in the AML and MDS groups are statistically lower than those in the MPN and control groups. Abbreviations: AML, acute myeloid leukemia; BAX, BCL2-associated X; BM, bone marrow; MDS, myelodysplastic syndrome; MPN, myeloproliferative neoplasm; NF-κB1, nuclear factor kappa light chain enhancer of activated B cells 1; NGAL, neutrophil gelatinase-associated lipocalin; PCN, plasma cell neoplasm.
Figure 6
Figure 6
(A) PCA scatter plot showing the distribution of the MPN and Control groups along the first two principal components (PC1 and PC2). (B) PCA loadings indicating the contributions of key features (e.g., NF-κB1 normalized counts, caspase-1 normalized counts) to PC1 and PC2. (C) t-SNE scatter plot depicting the clustering of MPN and Control groups in a non-linear feature space. (D) Loading projections highlighting the most influential features in the t-SNE analysis. Abbreviations: MPN, myeloproliferative neoplasm; PCA, principal component analysis; PC, principal component; LDA, linear discriminant analysis; t-SNE, t-distributed stochastic neighbor embedding; LD, linear discriminant.
Figure 7
Figure 7
Average ROC Curves for Machine Learning Classifiers (kNN, NBC, RF, XGB) Applied to Distinguish Between Control and Hematological Malignancy Groups. (A) MPN vs Control. (B) AML vs Control. (C) MDS vs Control. (D) PCN vs Control. Abbreviations: MPN, myeloproliferative neoplasm; AML, acute myeloid leukemia; MDS, myelodysplastic syndrome; PCN, plasma cell neoplasm; ROC, receiver operating characteristic; TPR, true positive rate; FPR, false positive rate.
Figure 8
Figure 8
Permutation feature importance for distinguishing control and disease groups (MPN, AML, MDS, PCN) across four machine learning models: (A) kNN, (B) NBC, (C) RF, and (D) XGB. Bars represent the relative feature importance of NF-κB1 and caspase-1 normalized counts for classification tasks. Features highlighted with red-bordered yellow boxes indicate the top feature within each group that contributed the most to classification. Absence of bars (e.g., XGB for AML) reflects models where no features contributed relevantly to classification in the corresponding group. Abbreviations: MPN, myeloproliferative neoplasm; AML, acute myeloid leukemia; MDS, myelodysplastic syndrome; PCN, plasma cell neoplasm; kNN, k-nearest neighbors; NBC, naïve Bayes classifier; XGB, extreme gradient boosting; NF-κB1, nuclear factor kappa light chain enhancer of activated B cells 1; Caspase-1, cysteine-aspartic protease 1.
Figure 9
Figure 9
SHAP Feature Importance Analysis for Predicting NF-κB1 Expression Across Hematological Malignancy Groups. (A) AML, (B) MPN, (C) MDS, and (D) PCN groups. Caspase-1 consistently ranks as the top feature in all groups, underscoring its critical role in NF-κB1 regulation. Group-specific features, such as RAGE, NGAL, and MYD88, further highlight distinct regulatory mechanisms contributing to NF-κB1 activity across malignancy types. Abbreviations: MPN, myeloproliferative neoplasm; AML, acute myeloid leukemia; MDS, myelodysplastic syndrome; PCN, plasma cell neoplasm; XGB, extreme gradient boosting; Caspase-1, cysteine-aspartic protease 1; SHAP, SHapley Additive exPlanations.
Figure 10
Figure 10
Average classification accuracy of four machine learning models (kNN, NBC, RF, and XGB) across varying sample sizes for distinguishing disease groups from the control group. (A) MPN, (B) AML, (C) MDS, and (D) PCN. The red dotted line indicates the sample size threshold (15, 14, and 23 samples) at which stable accuracy is achieved across most models for each disease group. Abbreviations: MPN, myeloproliferative neoplasm; AML, acute myeloid leukemia; MDS, myelodysplastic syndrome; PCN, plasma cell neoplasm; kNN, k-nearest neighbors; NBC, naïve Bayes classifier; XGB, extreme gradient boosting.

Similar articles

References

    1. Pikarsky E, Porat RM, Stein I, Abramovitch R, Amit S, Kasem S. et al. NF-κB functions as a tumour promoter in inflammation-associated cancer. Nature. 2004;431:461–6. - PubMed
    1. Beg A, Baltimore D. An essential role for NF-kappaB in preventing TNF-alpha-induced cell death. Science274: 782-784. CrossRef CAS. 1996;274:782–4. - PubMed
    1. Grigoriadis G, Zhan Y, Grumont RJ, Metcalf D, Handman E, Cheers C. et al. The Rel subunit of NF-kappaB-like transcription factors is a positive and negative regulator of macrophage gene expression: distinct roles for Rel in different macrophage populations. The EMBO journal. 1996;15:7099–107. - PMC - PubMed
    1. Xia L, Tan S, Zhou Y, Lin J, Wang H, Oyang L. et al. Role of the NFκB-signaling pathway in cancer. OncoTargets and therapy. 2018;11:2063–73. - PMC - PubMed
    1. Gilmore TD. Introduction to NF-κB: players, pathways, perspectives. Oncogene. 2006;25:6680–4. - PubMed

LinkOut - more resources