. 2025 Apr 18;7(2):fcaf156.
doi: 10.1093/braincomms/fcaf156. eCollection 2025.

Lymphocyte signatures correspond to clinical phenotypes in autoimmune limbic encephalitis

Affiliations

Lymphocyte signatures correspond to clinical phenotypes in autoimmune limbic encephalitis

Saskia Räuber et al. Brain Commun. .

Abstract

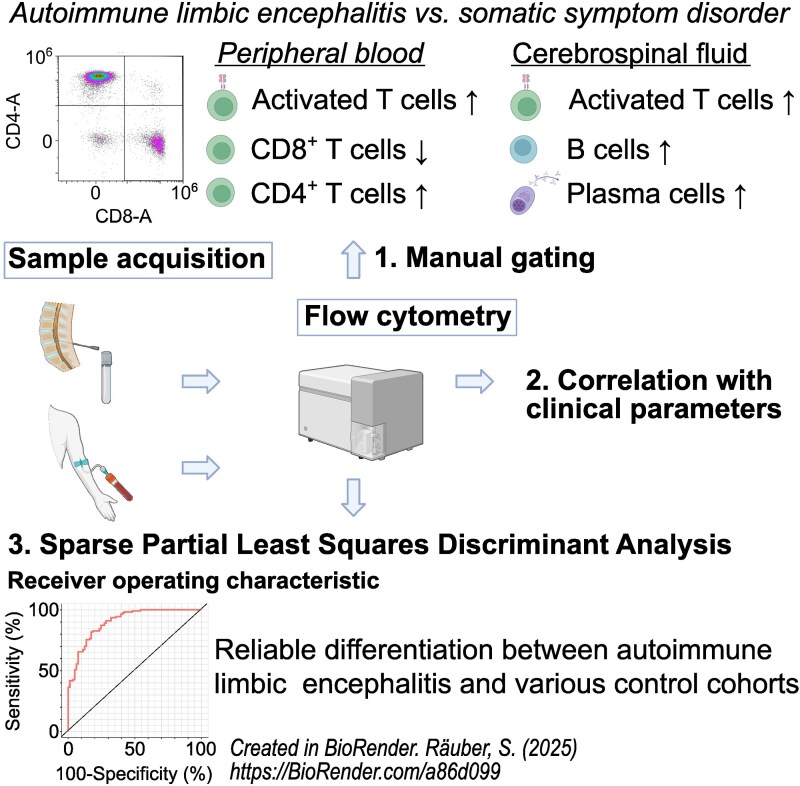
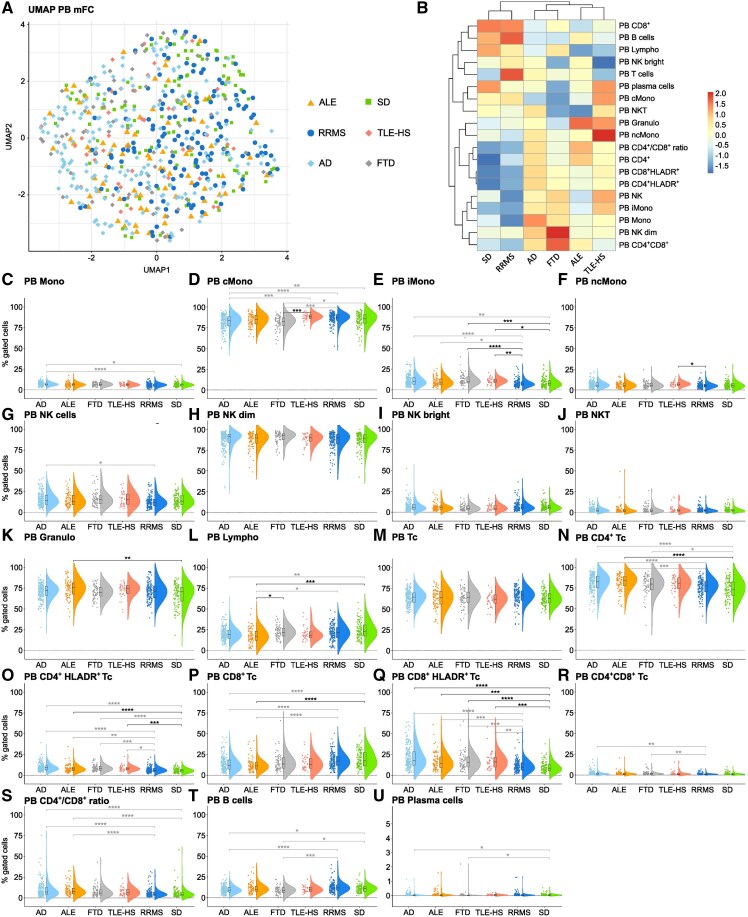
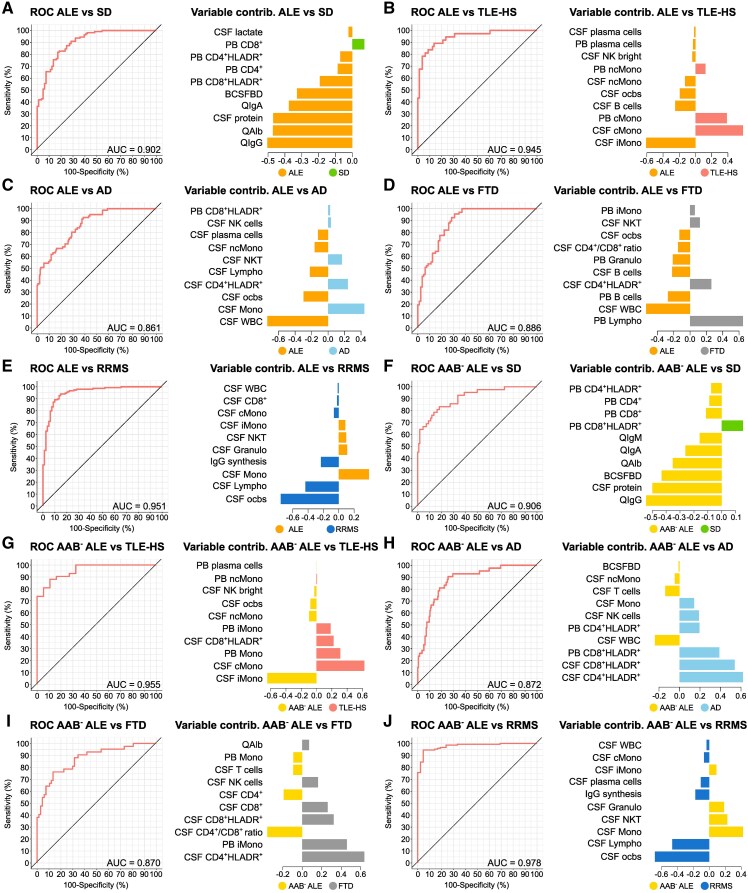
Autoimmune limbic encephalitis is an inflammatory condition confined to the limbic system of the brain that is deemed to be due to a dysregulated immune response. However, the exact pathophysiological mechanisms remain elusive. Diagnosis of autoimmune limbic encephalitis currently relies on clinical consensus criteria. However, diagnostic workup can be challenging, potentially delaying treatment initiation associated with poor clinical outcomes. We retrospectively identified 640 patients (81 autoimmune limbic encephalitis, 148 relapsing-remitting multiple sclerosis, 197 Alzheimer's disease, 67 frontotemporal dementia, 37 temporal lobe epilepsy with hippocampal sclerosis and 110 somatic symptom disorder patients). Applying multidimensional flow-cytometry together with novel computational approaches, we analysed the peripheral blood and cerebrospinal fluid immune cell profiles at different disease stages and performed correlations with clinical parameters (i.e. neuropsychological performance, EEG and MRI). We were able to identify a shared immune signature of autoimmune limbic encephalitis showing similarities in adaptive B and T cell response with other inflammatory central nervous system diseases and in T cell patterns with neurodegenerative disorders. Antibody-negative autoimmune limbic encephalitis showed a pronounced T cell response in peripheral blood similar to temporal lobe epilepsy and hippocampal sclerosis and neurodegenerative disorders differentiating from antibody-positive autoimmune limbic encephalitis and classical inflammatory central nervous system diseases with regard to B and plasma cell response. Longitudinal immune cell phenotyping in autoimmune limbic encephalitis revealed dynamic changes over time mainly affecting the innate, B and plasma cell compartment. Correlation analysis indicated associations between the baseline immune cell profile, especially lymphocytes, and neuropsychological performance, as well as EEG and MRI abnormalities. Applying novel computational approaches, we found that multidimensional flow cytometry together with routine CSF parameters could reliably distinguish autoimmune limbic encephalitis from controls and clinical differential diagnoses. Incorporation of multidimensional flow cytometry parameters showed superior discriminatory ability compared with CSF routine parameters alone. Taken together, autoimmune limbic encephalitis is characterized by a B and T cell dominated intrathecal immune-cell signature corresponding to changes reported in the brain parenchyma and showing similarities with classical inflammatory central nervous system diseases and neurodegenerative disorders. Incorporating clinical parameters and applying novel computational approaches, we could show that multidimensional flow cytometry might be a beneficial complement to the established diagnostic workup of autoimmune limbic encephalitis promoting early diagnosis and facilitating outcome prediction to enhance individualized treatment regimes.

Keywords: differential diagnoses; immune cells; limbic encephalitis; multidimensional flow cytometry.


Conflict of interest statement

S.K. reports research funding from Biogen and has received speakers’ honoraria from Eisai, Jazz Pharma and UCB. The remaining authors report no conflicts of interest.

Figures

Graphical Abstract
Graphical Abstract
Figure 1
Figure 1
Alterations in the peripheral T cell response in ALE and neurodegenerative disorders compared with SD controls. (A) UMAP analysis including peripheral blood mFC parameters of patients with ALE, RRMS, TLE-HS, Alzheimer’s disease, FTD and SD; (B) Heatmap analysis of peripheral blood mFC parameters: the median of each parameter was calculated, centred, scaled, and clustered hierarchically; (C-U) Violin plots with box plots illustrating the peripheral blood mFC parameters of ALE, RRMS, TLE-HS, Alzheimer’s disease, FTD and SD patients. Medians and 25th as well as 75th percentiles are displayed by boxes. The whiskers extend to the smallest and largest values (maximum: 1.5 * IQR from the hinge). ANOVA with post hoc Tukey HSD was used to calculate P-values if normality of data could be assumed; otherwise, P-values were calculated using Kruskal–Wallis test with Dunn post hoc test (P-adjustment method: Benjamini–Hochberg). *P ≤ 0.05, **P ≤ 0.01, ***P ≤ 0.001, ****P ≤ 0.0001. ALE, autoimmune limbic encephalitis; Bc, B cells; cMono, classical monocytes; FTD, frontotemporal dementia; Granulo, granulocytes; iMono, intermediate monocytes; Lympho, lymphocytes; mFC, multidimensional flow cytometry; Mono, monocytes; ncMono; non-classical monocytes; NK, natural killer cells; NKT, Natural killer T cells; PB, peripheral blood; RRMS, relapsing remitting multiple sclerosis; SD, somatic symptom disorder; Tc, T cells; TLE-HS, temporal lobe epilepsy and hippocampal sclerosis; UMAP, uniform manifold approximation and projection for dimension reduction.
Figure 2
Figure 2
ALE and RRMS share a pronounced intrathecal T and B cell response while similarities in T cell patterns were visible between ALE, TLE-HS, Alzheimer’s disease and FTD. (A) UMAP analysis including cerebrospinal fluid mFC parameters of ALE, RRMS, TLE-HS, Alzheimer’s disease, FTD, and SD patients; (B) Heatmap analysis of cerebrospinal fluid mFC parameters: the median of each parameter was calculated, centred, scaled and clustered hierarchically; (C-U) Violin plots with box plots illustrating the cerebrospinal fluid mFC parameters of patients with ALE, RRMS, TLE-HS, Alzheimer’s disease, FTD and SD. Medians and 25th as well as 75th percentiles are displayed by boxes. The whiskers extend to the smallest and largest values (maximum: 1.5 * IQR from the hinge). ANOVA with post hoc Tukey HSD was used to calculate P-values if normality of data could be assumed; otherwise, P-values were calculated using Kruskal–Wallis test with Dunn post hoc test (P-adjustment method: Benjamini–Hochberg). *P ≤ 0.05, **P ≤ 0.01, ***P ≤ 0.001, ****P ≤ 0.0001. ALE, autoimmune limbic encephalitis; Bc, B cells; cMono, classical monocytes; CSF, cerebrospinal fluid; FTD, frontotemporal dementia; Granulo, granulocytes; iMono, intermediate monocytes; Lympho, lymphocytes; mFC, multidimensional flow cytometry; Mono, monocytes; ncMono; non-classical monocytes; NK, natural killer cells; NKT, Natural killer T cells; RRMS, relapsing remitting multiple sclerosis; SD, somatic symptom disorder; Tc, T cells; TLE-HS, temporal lobe epilepsy and hippocampal sclerosis; UMAP, uniform manifold approximation and projection for dimension reduction.
Figure 3
Figure 3
Antibody-negative ALE shows a pronounced peripheral T cell response similar to TLE-HS, and neurodegenerative disorders. (A) UMAP analysis including peripheral blood mFC parameters of patients with antibody-negative ALE, RRMS, TLE-HS, Alzheimer’s disease, FTD and SD; (B) Heatmap analysis of peripheral blood mFC parameters: the median of each parameter was calculated, centred, scaled and clustered hierarchically; (C-U) Violin plots with box plots illustrating the peripheral blood mFC parameters of patients with antibody-negative ALE, RRMS, TLE-HS, Alzheimer’s disease, FTD and SD. Medians and 25th as well as 75th percentiles are displayed by boxes. The whiskers extend to the smallest and largest values (maximum: 1.5 * IQR from the hinge). ANOVA with post hoc Tukey HSD was used to calculate P-values if normality of data could be assumed, otherwise P-values were calculated using Kruskal–Wallis test with Dunn post hoc test (P-adjustment method: Benjamini–Hochberg). *P ≤ 0.05, **P ≤ 0.01, ***P ≤ 0.001, ****P ≤ 0.0001. AAB ALE, autoantibody-negative ALE; ALE, autoimmune limbic encephalitis; cMono, classical monocytes; CSF, cerebrospinal fluid; FTD, frontotemporal dementia; Granulo, granulocytes; iMono, intermediate monocytes; Lympho, lymphocytes; mFC, multidimensional flow cytometry; Mono, monocytes; ncMono; non-classical monocytes; NK, natural killer cells; NKT, natural killer T cells; PB, peripheral blood; RRMS, relapsing remitting multiple sclerosis; SD, somatic symptom disorder; TLE-HS, temporal lobe epilepsy and hippocampal sclerosis; UMAP, uniform manifold approximation and projection for dimension reduction.
Figure 4
Figure 4
Differences in the intrathecal innate and adaptive immune response between patients with antibody-negative ALE, RRMS, TLE-HS, Alzheimer’s disease and FTD. (A) UMAP analysis including cerebrospinal fluid mFC parameters of patients with antibody-negative ALE, RRMS, TLE-HS, Alzheimer’s disease, FTD and SD; (B) Heatmap analysis of cerebrospinal fluid mFC parameters: the median of each parameter was calculated, centred, scaled and clustered hierarchically; (C-U) Violin plots with box plots illustrating the cerebrospinal fluid mFC parameters of patients with antibody-negative ALE, RRMS, TLE-HS, Alzheimer’s disease, FTD and SD. Medians and 25th as well as 75th percentiles are displayed by boxes. The whiskers extend to the smallest and largest values (maximum: 1.5 * IQR from the hinge). ANOVA with post hoc Tukey HSD was used to calculate P-values if normality of data could be assumed; otherwise, P-values were calculated using Kruskal–Wallis test with Dunn post hoc test (P-adjustment method: Benjamini–Hochberg). *P ≤ 0.05, **P ≤ 0.01, ***P ≤ 0.001, ****P ≤ 0.0001. (V) Volcano plot comparing the peripheral blood and cerebrospinal fluid mFC parameters of antibody-negative ALE and antibody-positive ALE patients. The fold change of every single parameter between the two groups is plotted against the corresponding P-value calculated by t-test if normality could be assumed based on the Shapiro–Wilk test; otherwise, Mann–Whitney U-test was used. To adjust for multiple comparisons, the Benjamini–Hochberg procedure was performed. PB parameters are shown as triangles and CSF parameters as circles. Only significant parameters are labelled. P-values < 0.0001 are depicted as 0.0001 and P-values > 0.9999 are shown as 1.0. AAB, autoantibody; ALE, autoimmune limbic encephalitis; Bc, B cells; cMono, classical monocytes; CSF, cerebrospinal fluid; FTD, frontotemporal dementia; Granulo, granulocytes; iMono, intermediate monocytes; Lympho, lymphocytes; mFC, multidimensional flow cytometry; Mono, monocytes; ncMono; non-classical monocytes; NK, natural killer cells; NKT, Natural killer T cells; RRMS, relapsing remitting multiple sclerosis; SD, somatic symptom disorder; Tc, T cells; TLE-HS, temporal lobe epilepsy and hippocampal sclerosis; UMAP, uniform manifold approximation and projection for dimension reduction.
Figure 5
Figure 5
MFC together with CSF routine analysis can reliably distinguish ALE from differential diagnoses and controls. (A-J) ROC analyses of the classification results obtained from sPLS-DA. CSF routine as well as PB and CSF mFC parameters were included in the analysis. In addition, the contribution of the top 10 variables on latent component 1 was visualized. ALE patients (A-E) or antibody-negative ALE patients (F-J) were compared with one control cohort at a time. AAB ALE, autoantibody-negative ALE; AD, Alzheimer’s disease; ALE, autoimmune limbic encephalitis; AUC, area under the curve; BCSFBD, blood-CSF barrier dysfunction; cMono, classical monocytes; contrib. , contribution; CSF, cerebrospinal fluid; FTD, frontotemporal dementia; Granulo, granulocytes; Ig, immunoglobulin; iMono, intermediate monocytes; Lympho, lymphocytes; mFC, multidimensional flow cytometry; Mono, monocytes; ncMono; non-classical monocytes; NK, natural killer cells; NKT, natural killer T cells; PB, peripheral blood; ocbs, oligoclonal bands; QIgA, serum/CSF IgA ratio; QAlb, serum/CSF albumin ratio; QIgG, serum/CSF IgG ratio; QIgM, serum/CSF IgM ratio; ROC, receiver operating characteristic; RRMS, relapsing remitting multiple sclerosis; SD, somatic symptom disorder; sPLS-DA, Sparse Partial Least Squares Discriminant Analysis; TLE-HS, temporal lobe epilepsy and hippocampal sclerosis; WBC, white blood cell count.

Similar articles

References

    1. Graus F, Titulaer MJ, Balu R, et al. A clinical approach to diagnosis of autoimmune encephalitis. Lancet Neurol. 2016;15(4):391–404. - PMC - PubMed
    1. Dalmau J, Graus F. Antibody-mediated encephalitis. N Engl J Med. 2018;378(9):840–851. - PubMed
    1. Van Steenhoven RW, de Vries JM, Bruijstens AL, et al. Mimics of autoimmune encephalitis: Validation of the 2016 clinical autoimmune encephalitis criteria. Neurol Neuroimmunol Neuroinflamm. 2023;10(6):e200148. - PMC - PubMed
    1. Dalmau J, Graus F. Diagnostic criteria for autoimmune encephalitis: Utility and pitfalls for antibody-negative disease. Lancet Neurol. 2023;22(6):529–540. - PubMed
    1. Bhasin A, Haftka-George A. Diagnostic challenges and treatment approach to seronegative autoimmune encephalitis. Cureus. 2024;16(3):e56844. - PMC - PubMed

LinkOut - more resources