. 2025 Apr 16;7(2):fcaf146.
doi: 10.1093/braincomms/fcaf146. eCollection 2025.

Neuroimaging-based data-driven subtypes of spatiotemporal atrophy due to Parkinson's disease

Collaborators, Affiliations

Neuroimaging-based data-driven subtypes of spatiotemporal atrophy due to Parkinson's disease

Zeena Shawa et al. Brain Commun. .

Abstract

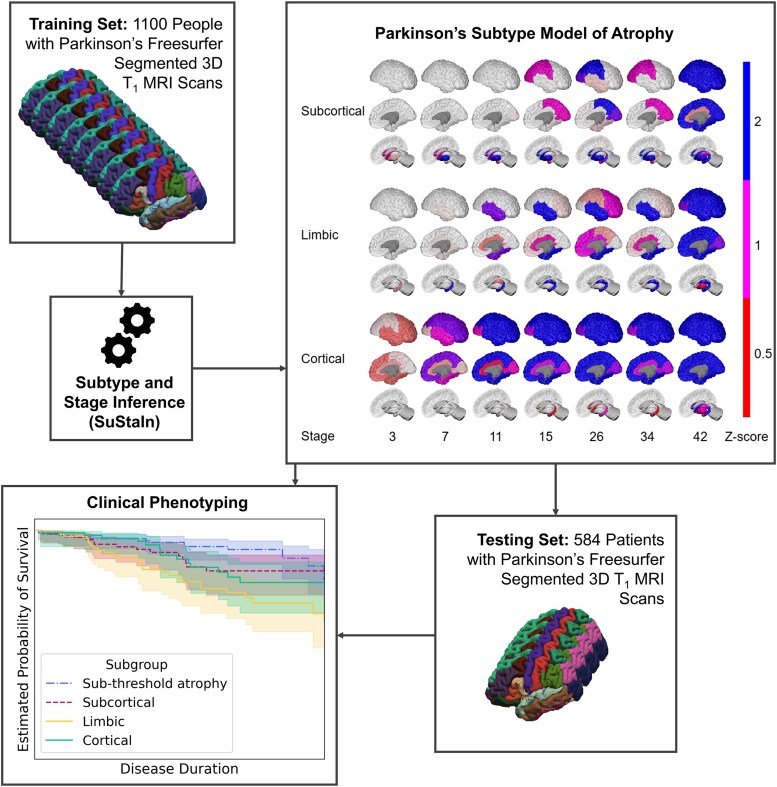
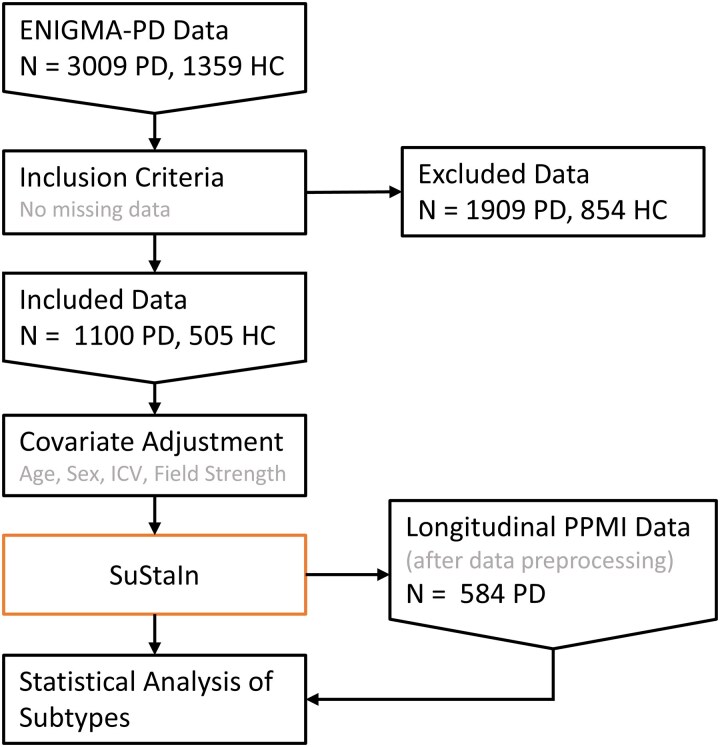
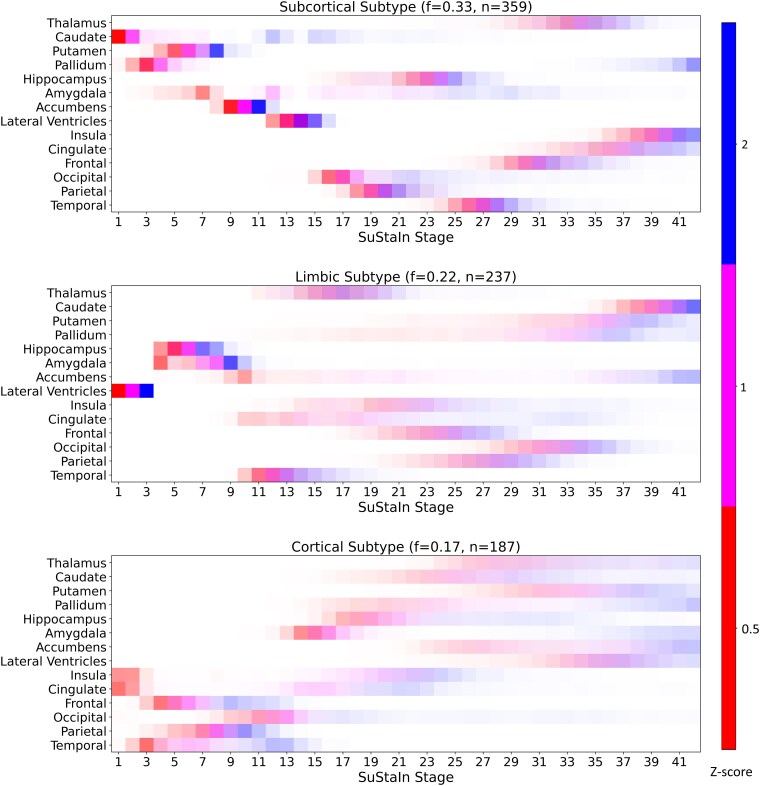
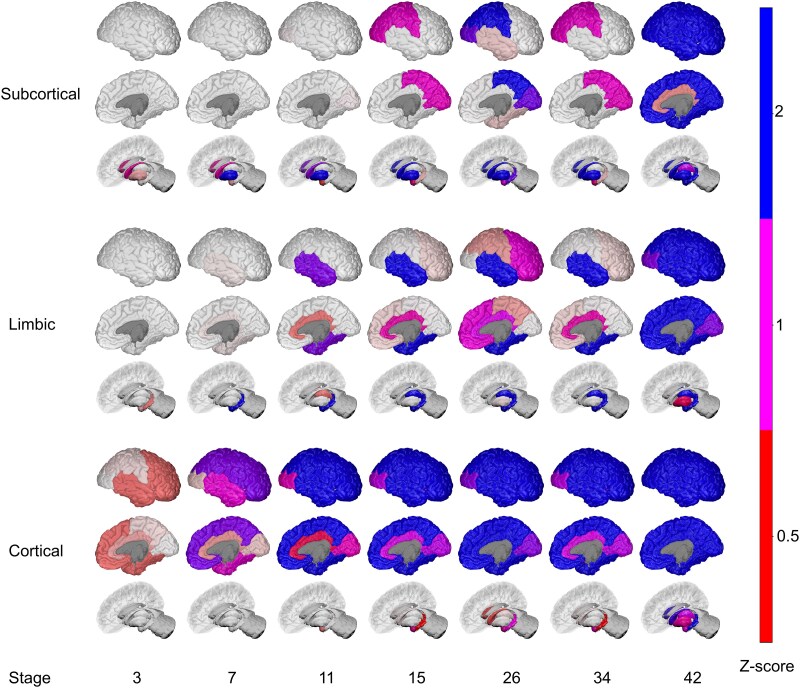
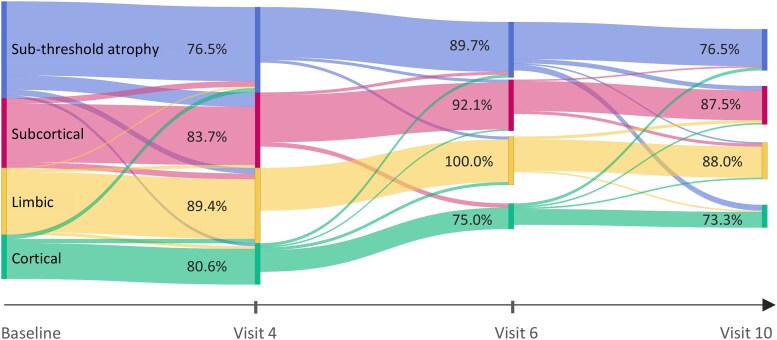
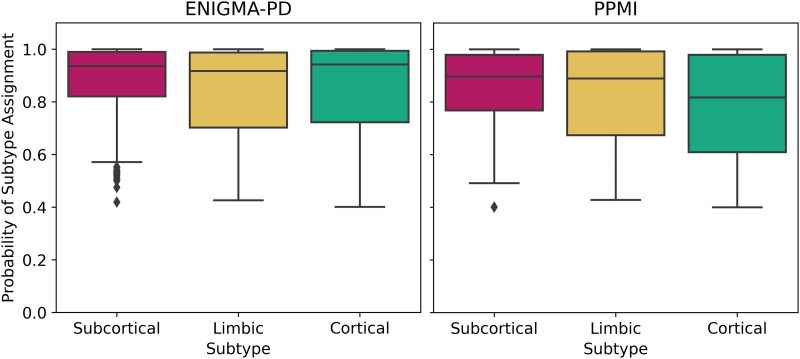
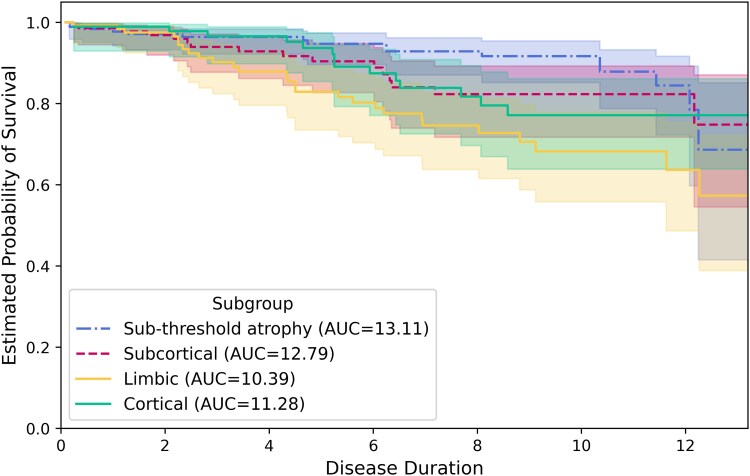
Parkinson's disease is the second most common neurodegenerative disease. Despite this, there are no robust biomarkers to predict progression, and understanding of disease mechanisms is limited. We used the Subtype and Stage Inference algorithm to characterize Parkinson's disease heterogeneity in terms of spatiotemporal subtypes of macroscopic atrophy detectable on T1-weighted MRI-a successful approach used in other neurodegenerative diseases. We trained the model on covariate-adjusted cortical thicknesses and subcortical volumes from the largest known T1-weighted MRI dataset in Parkinson's disease, Enhancing Neuroimaging through Meta-Analysis consortium Parkinson's Disease dataset (n = 1100 cases). We tested the model by analyzing clinical progression over up to 9 years in openly-available data from people with Parkinson's disease from the Parkinson's Progression Markers Initiative (n = 584 cases). Under cross-validation, our analysis supported three spatiotemporal atrophy subtypes, named for the location of the earliest affected regions as: 'Subcortical' (n = 359, 33%), 'Limbic' (n = 237, 22%) and 'Cortical' (n = 187, 17%). A fourth subgroup having sub-threshold/no atrophy was named 'Sub-threshold atrophy' (n = 317, 29%). Statistical differences in clinical scores existed between the no-atrophy subgroup and the atrophy subtypes, but not among the atrophy subtypes. This suggests that the prime T1-weighted MRI delineator of clinical differences in Parkinson's disease is atrophy severity, rather than atrophy location. Future work on unravelling the biological and clinical heterogeneity of Parkinson's disease should leverage more sensitive neuroimaging modalities and multimodal data.

Keywords: ENIGMA-PD; PPMI; clustering; disease progression modelling; neurodegeneration.


Conflict of interest statement

R.S.W. has received speaking and writing honoraria from GE Healthcare, Bial, Omnix pharma and Britannia, and consultancy fees from Therakind and Accenture. N.P.O. is a paid consultant of Queen Square Analytics Limited (UK) on unrelated projects. M.T.M.H. received funding/grant support from Parkinson’s UK, Oxford NIHR BRC, University of Oxford, CPT, Lab10X, NIHR, Michael J Fox Foundation, European Platform for Neurodegenerative Disorders (EPND; H2020), GE Healthcare and the PSP Association. She also received payment for Advisory Board attendance/consultancy for Lundbeck, ESCAPE Bio, Evidera, Manus Neurodynamica, Biogen MA, CuraSen Therapeutics, Roche Products Ltd, JAZZ Pharma, Aventis Pharma. She is an advisory founder of NeuHealth Digital Ltd (company number: 14492037), a digital biomarker platform to remotely manage condition progression for Parkinson’s. The other authors report no competing interests.

Figures

Graphical Abstract
Graphical Abstract
Figure 1
Figure 1
Study flowchart. The ENIGMA-PD data used for training was selected based on having no missing data in age, sex, disease duration and imaging features. Excluded individuals had a median of 6 missing features of interest, with a MAD of 2. Cortical thickness measurements were the most frequently absent feature by a large margin (Supplementary Fig. 8). Covariate adjusted imaging features were the inputs to the SuStaIn algorithm. The trained model was used to subtype and stage PPMI participants, in whom demographic and longitudinal clinical outcomes were compared. SuStaIn, Subtype and Stage Inference; HC, healthy control; ICV, intracranial volume; PD, Parkinson’s disease; ENIGMA, Enhancing Neuroimaging through Meta-Analysis; PPMI, Parkinson’s Progression Markers Initiative; MAD, median absolute deviation.
Figure 2
Figure 2
Data-driven model of Parkinson’s disease atrophy subtypes. Positional Variance Diagrams show accumulating atrophy (left-to-right) in brain regions (vertical axis), as estimated by SuStaIn on data from ENIGMA-PD. The SuStaIn stages correspond to the probabilistic order in which brain regions become abnormal, in disease pseudo time, compared with healthy controls. The model has 42 stages of cumulative abnormality corresponding to 3 z-score events per 14 input features. Subtypes are named Subcortical, Limbic, and Cortical for the location of the earliest atrophy events, which are colour-coded in red (mild, z = 0.5), magenta (moderate, z = 1) and blue (severe, z = 2). Colour intensity corresponds to the model confidence in atrophy event positions (stages) within each subtype sequence, where confidence is sharp, and uncertainty blurry. The fraction of patient data in the training set assigned to each subtype is indicated by f, with the remainder designated as the Sub-threshold atrophy subgroup. SuStaIn, Subtype and Stage Inference; PD, Parkinson’s disease; ENIGMA, Enhancing Neuroimaging through Meta-Analysis.
Figure 3
Figure 3
Visualization of Parkinson’s disease atrophy subtypes model. BrainPainter visualizations of the pattern of neurodegeneration. Colours indicate atrophy severity as z-scores relative to healthy controls: red (z = 0.5, mild), magenta (z = 1, moderate), blue (z = 2, severe). For simplicity, snapshots of only a few select stages (x-axis) are shown per subtype. Stages correspond to the probabilistic order in which brain regions become abnormal in disease pseudo time. Colour intensity corresponds to the model confidence in atrophy event positions (stages) within each subtype sequence, where confidence is sharp, and uncertainty blurry. Colours are blended linearly, indicating overlap between z-score events that overlap. An example of this can be seen at stage 26 of the Subcortical subtype, where magenta (z > 1) and blue (z > 2) mix.
Figure 4
Figure 4
Longitudinal consistency of subtypes in the PPMI test data. A Sankey diagram showing PPMI subtype assignments by study visit. The percentages reflect individuals that are assigned the same subtype since Baseline. Most participant data are consistently assigned to a single subtype. PPMI, Parkinson’s Progression Markers Initiative.
Figure 5
Figure 5
Model-based subtype confidence. Box plots show high confidence in subtype assignment (subtype probability) for most participants in both the training dataset (left: ENIGMA-PD, N = 359, 237 and 187 for subcortical, limbic and cortical, respectively) and the test dataset (right: PPMI, N = 152, 143 and 97 for subcortical, limbic and cortical respectively). PD, Parkinson’s disease; ENIGMA, Enhancing Neuroimaging through Meta-Analysis; PPMI, Parkinson’s Progression Markers Initiative.
Figure 6
Figure 6
Survival analysis for cognitive decline or study withdrawal (PPMI test data). Kaplan–Meier curves for events including MoCA < 21 or withdrawal for any of the following reasons: burden of study procedures (other than travel), decline in health, institutionalized and death. MoCA < 21 has previously been found to be a suitable cutoff for Parkinson’s disease dementia detection., At a disease duration of 0 years, N = 172, 131, 108 and 83, for the Sub-threshold atrophy (blue dot-dash line), Subcortical (red dashed line), Limbic (yellow solid line) and Cortical (green solid line) subgroups, respectively. At a disease duration of 13 years, N = 156, 115, 81 and 69, for the Sub-threshold atrophy, Subcortical, Limbic and Cortical subgroups, respectively. MoCA, Montreal Cognitive Assessment; AUC, area under the curve.

Similar articles

References

    1. Bloem BR, Okun MS, Klein C. Parkinson’s disease. The Lancet. 2021;397(10291):2284–2303. - PubMed
    1. Feigin VL, Nichols E, Alam T, et al. Global, regional, and national burden of neurological disorders, 1990–2016: A systematic analysis for the global burden of disease study 2016. Lancet Neurol. 2019;18(5):459–480. - PMC - PubMed
    1. Deuschl G, Beghi E, Fazekas F, et al. The burden of neurological diseases in Europe: An analysis for the global burden of disease study 2017. Lancet Public Health. 2020;5(10):e551–e567. - PubMed
    1. Lewis SJG, Foltynie T, Blackwell AD, Robbins TW, Owen AM, Barker RA. Heterogeneity of Parkinson’s disease in the early clinical stages using a data driven approach. J Neurol Neurosurg Psychiatry. 2005;76(3):343–348. - PMC - PubMed
    1. Chen-Plotkin AS, Albin R, Alcalay R, et al. Finding useful biomarkers for Parkinson’s disease. Sci Transl Med. 2018;10(454):eaam6003. - PMC - PubMed

LinkOut - more resources