. 2025 Apr 15:19:1547010.
doi: 10.3389/fnins.2025.1547010. eCollection 2025.

Relations between neurometabolism and clinical biomarkers in patients with metabolic disease

Affiliations

Relations between neurometabolism and clinical biomarkers in patients with metabolic disease

Chao-Chao Chen et al. Front Neurosci. .

Abstract

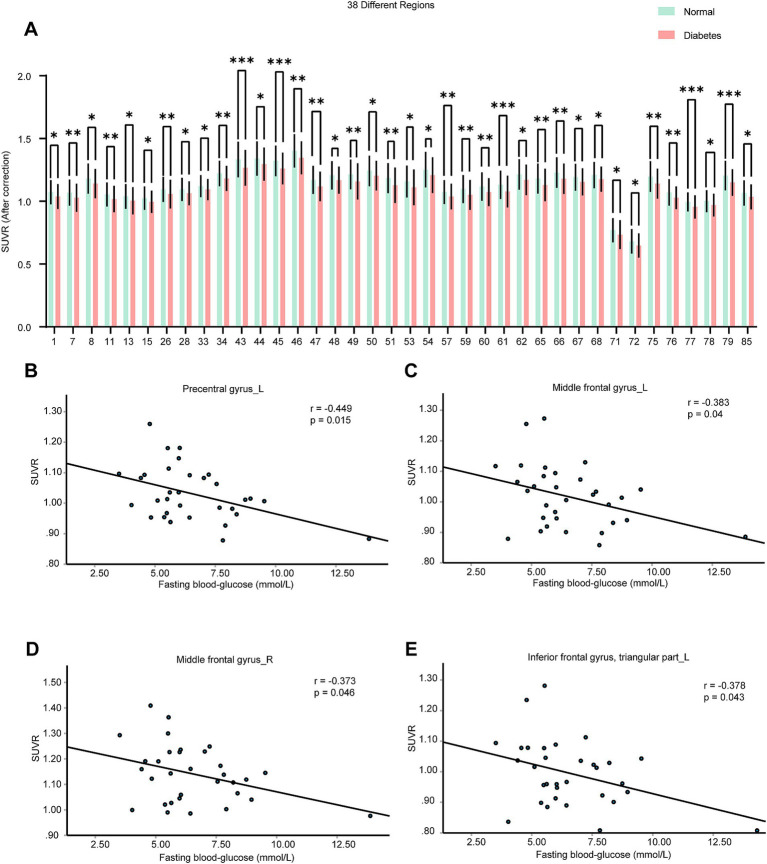
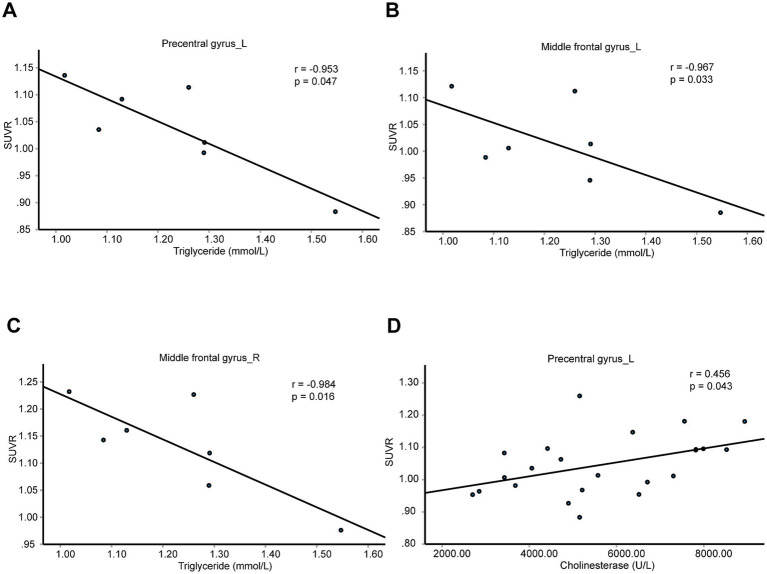
The global prevalence of metabolic diseases, including hypertension, type 2 diabetes mellitus (T2DM), gout, and obesity, has significantly increased over the past two decades. The brain plays a central role in regulating both human behavior and metabolism. Understanding the potential connections among these metabolic diseases and the involvement of the brain in their progression presents an intriguing and critical area of research. In this study, we analyzed PET-CT images and clinical biomarkers from 112 cases of hypertension, 56 cases of T2DM, 11 cases of obesity, and 14 cases of gout. Standardized uptake value ratios (SUVRs) were extracted from various brain regions using the Spatial-Normalization-of-Brain-PET-Images (SNBPI) software. The SUVRs were calculated using the standard methodology, where the mean standardized uptake value (SUV) of each region of interest (ROI) was divided by the mean SUV of the reference region, that is the whole cerebellum. The SNBPI tool was employed for intensity normalization. Partial correlation analysis was conducted to examine the relationships between SUVRs in different brain regions and clinical biomarkers, adjusting for sex, age, and BMI. Brain network metabolic connectivity was assessed using Permutation_IHEP software and visualized with BrainNet Viewer. Our results indicate that SUVRs in most brain regions were decreased in patients with hypertension or T2DM but increased in patients with obesity or gout. Specifically, SUVRs in brain regions associated with blood pressure were correlated with blood uric acid, creatinine, potassium, and apolipoprotein B. SUVRs in brain regions related to blood glucose were associated with blood triglycerides and cholinesterase. SUVRs in BMI-related brain regions correlated with blood urea nitrogen, aspartate aminotransferase, and alkaline phosphatase. SUVRs in brain regions associated with gout were correlated with fasting blood glucose, glutamic oxalacetic transaminase, total bilirubin, and alkaline phosphatase. Furthermore, brain network metabolic connectivity was reduced in patients with hypertension, T2DM, or obesity but increased in patients with gout. Our findings suggest that uric acid may negatively relate with blood pressure and glucose levels, while blood glucose and blood lipid levels may be positively correlated with each other. Gout appears distinct from other metabolic diseases and may offer a protective effect on brain function. The right superior parietal gyrus may be implicated in impaired renal function during the progression of hypertension. The left precentral gyrus and bilateral middle frontal gyri may relate to dyslipidemia and the potential development of atherosclerotic cardiovascular disease in patients with T2DM. In conclusion, our study highlights potential relationships among metabolic diseases and suggests the possible regulatory roles of specific brain regions in the progression of these conditions. These insights could pave the way for novel therapeutic strategies targeting brain metabolism in the management of metabolic diseases.

Keywords: PET-CT; T2DM; clinical biomarkers; gout; hypertension; obesity.


Conflict of interest statement

The authors declare that the research was conducted in the absence of any commercial or financial relationships that could be construed as a potential conflict of interest.

Figures

Figure 1
Figure 1
Brain neurometabolism association to clinical cues in hypertension. (A) The corrected SUVRs of different brain regions of control and hypertension patients were compared using two-tailed unpaired Student’s t test or two-tailed independent Student’s t-test with Welch’s correction. The different number indicate different brain region, which was interpreted in Supplementary Table 3. N = 497 cases for control patients. N = 112 cases for hypertension group. (B–F) The correlations between the SUVRs of different brain regions and systolic blood pressure in hypertension patients were analyzed using partial correlation analysis by setting age, sex, and BMI as control variables. N = 59 cases for hypertension group. Data shown were mean ± SD. *p < 0.05; **p < 0.01; ***p < 0.001.
Figure 2
Figure 2
Brain neurometabolism association to metabolic biomarkers in hypertension. (A–G) The correlations between the SUVRs of different brain regions and blood biochemical indicators in hypertension patients were analyzed using partial correlation analysis by setting age, sex, and BMI as control variables. N = 18 cases in panel (A), 54 cases in panel (B), 65 cases in panel (C), 54 cases in panel (D), 24 cases in panel (E), 66 cases in panel (F), 18 cases in panel (G).
Figure 3
Figure 3
Alterations in brain network connectivity in hypertension. (A) Locations of the left cuneus, left superior occipital gyrus, right superior parietal gyrus, bilateral supramarginal and angular gyri in 3D brain were showed. (B,C) The changes of metabolic connectivity among different brain regions were showed. The changes in metabolic connectivity of the left cuneus, left superior occipital gyrus, right superior parietal gyrus, bilateral supramarginal and angular gyri with other brain regions were annotated in panel (B), and labeled with red font in panel (C). The different number indicate different brain region, which was interpreted in Supplementary Table 3. The color bar indicates the absolute value of magnitude changes in connectivity strength in panel (B) and magnitude changes in connectivity strength in panel (C). N = 154 cases for control patients. N = 112 cases for hypertension group.
Figure 4
Figure 4
Brain neurometabolism association to clinical cues in T2DM. (A) The corrected SUVRs of different brain regions of control and T2DM patients were compared using two-tailed unpaired Student’s t test or two-tailed independent Student’s t-test with Welch’s correction. The different number indicate different brain region, which was interpreted in Supplementary Table 3. N = 497 cases for control patients. N = 56 cases for T2DM group. (B–E) The correlations between the SUVRs of different brain regions and fasting blood-glucose in T2DM patients were analyzed using partial correlation analysis by setting age, sex, and BMI as control variables. N = 32 cases for T2DM group. Data shown were mean ± SD. *p < 0.05; **p < 0.01; ***p < 0.001.
Figure 5
Figure 5
Brain neurometabolism association to metabolic biomarkers in T2DM. (A–D) The correlations between the SUVRs of different brain regions and blood biochemical indicators in T2DM patients were analyzed using partial correlation analysis by setting age, sex, and BMI as control variables. N = 7 cases in panels (A–C). N = 23 cases in panel (D).
Figure 6
Figure 6
Alterations in brain network connectivity in T2DM. (A) Locations of the left precentral gyrus, the left middle frontal gyrus, the right middle frontal gyrus, and the left triangular part of inferior frontal gyrus in 3D brain were showed. (B,C) The changes of metabolic connectivity among different brain regions were showed. The changes in metabolic connectivity of the left precentral gyrus, the left middle frontal gyrus, the right middle frontal gyrus, and the left triangular part of inferior frontal gyrus with other brain regions were annotated in panel (B), and labeled with red font in panel (C). The different number indicate different brain region, which was interpreted in Supplementary Table 3. The color bar indicates the absolute value of magnitude changes in connectivity strength in panel (B) and magnitude changes in connectivity strength in panel (C). N = 165 cases for control patients. N = 56 cases for T2DM group.
Figure 7
Figure 7
Brain neurometabolism association to clinical cues in obese patients. (A) The SUVRs of different brain regions of control and obese patients were compared using two-tailed unpaired Student’s t test or two-tailed independent Student’s t-test with Welch’s correction. The different number indicate different brain region, which was interpreted in Supplementary Table 3. N = 497 cases for control patients. N = 11 cases for obese group. (B–E) The correlations between the SUVRs of different brain regions and BMI in control and obese patients were analyzed using partial correlation analysis by setting age, sex as control variables. N = 446 cases. Data shown were mean ± SD. *p < 0.05.
Figure 8
Figure 8
Alterations in brain network connectivity in obese patients. (A) Locations of bilateral supplementary motor area, left median cingulate and paracingulate gyri, and left paracentral lobule in 3D brain were showed. (B,C) The changes of metabolic connectivity among different brain regions were showed. The changes in metabolic connectivity of bilateral supplementary motor area, left median cingulate and paracingulate gyri, and left paracentral lobule with other brain regions were annotated in panel (B), and labeled with red font in panel (C). The different number indicate different brain region, which was interpreted in Supplementary Table 3. The color bar indicates the absolute value of magnitude changes in connectivity strength in panel (B) and magnitude changes in connectivity strength in panel (C). N = 497 cases for control patients. N = 11 cases for obese group.

Similar articles

References

    1. Alonge K. M., D'Alessio D. A., Schwartz M. W. (2021). Brain control of blood glucose levels: implications for the pathogenesis of type 2 diabetes. Diabetologia 64, 5–14. doi: 10.1007/s00125-020-05293-3, PMID: - DOI - PMC - PubMed
    1. Biessels G. J., Despa F. (2018). Cognitive decline and dementia in diabetes mellitus: mechanisms and clinical implications. Nat. Rev. Endocrinol. 14, 591–604. doi: 10.1038/s41574-018-0048-7, PMID: - DOI - PMC - PubMed
    1. Bullmore E., Sporns O. (2009). Complex brain networks: graph theoretical analysis of structural and functional systems. Nat. Rev. Neurosci. 10, 186–198. doi: 10.1038/nrn2575, PMID: - DOI - PubMed
    1. Carnevale L., Maffei A., Landolfi A., Grillea G., Carnevale D., Lembo G. (2020). Brain functional magnetic resonance imaging highlights altered connections and functional networks in patients with hypertension. Hypertension 76, 1480–1490. doi: 10.1161/HYPERTENSIONAHA.120.15296 - DOI - PubMed
    1. Chen J., Zhang J., Liu X., Wang X., Xu X., Li H., et al. . (2017). Abnormal subcortical nuclei shapes in patients with type 2 diabetes mellitus. Eur. Radiol. 27, 4247–4256. doi: 10.1007/s00330-017-4790-3, PMID: - DOI - PubMed

LinkOut - more resources