. 2025 Apr 15:16:1539039.
doi: 10.3389/fendo.2025.1539039. eCollection 2025.

Assessing the predictive value of time-in-range level for the risk of postoperative infection in patients with type 2 diabetes: a cohort study

Affiliations

Assessing the predictive value of time-in-range level for the risk of postoperative infection in patients with type 2 diabetes: a cohort study

Ying Wu et al. Front Endocrinol (Lausanne). .

Abstract

Aim: To analyze the correlation between preoperative time-in-range (TIR) levels and postoperative infection in patients with type 2 diabetes mellitus (T2DM) and to evaluate the value of the TIR as a predictor of postoperative infection in patients with T2DM.

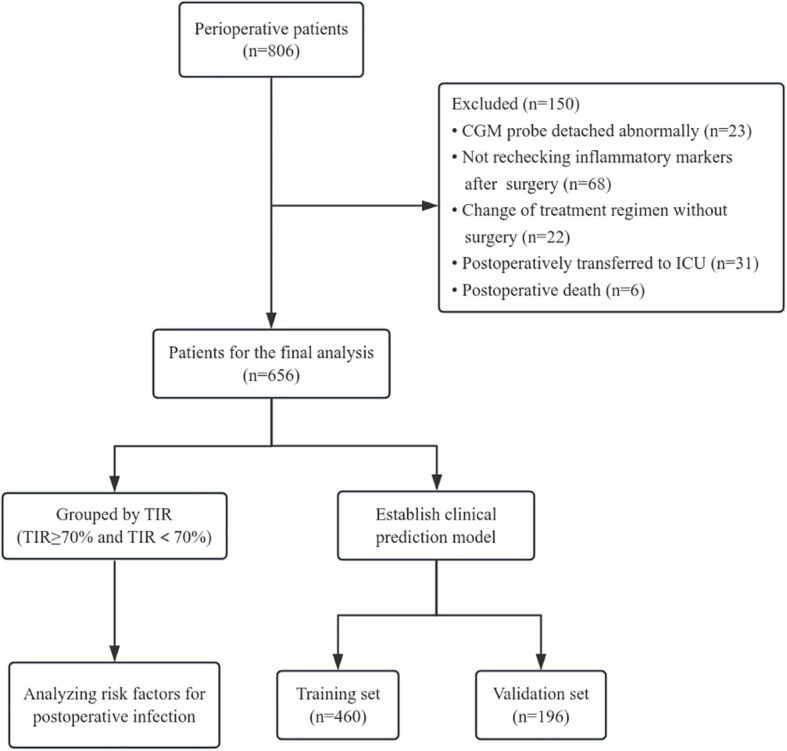
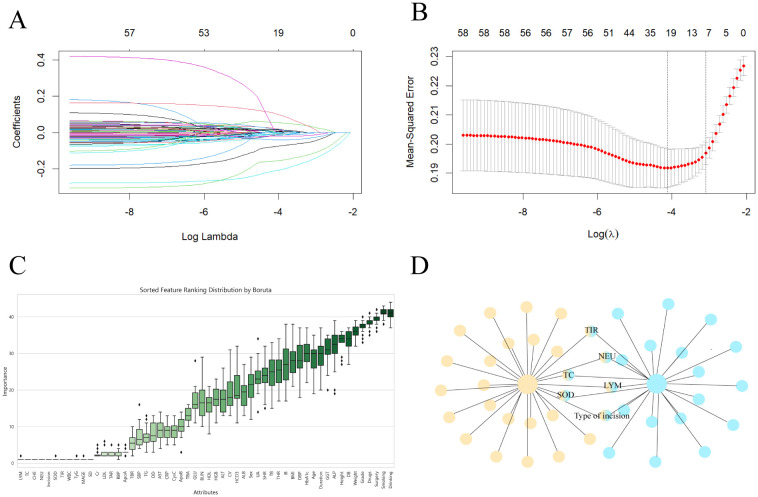
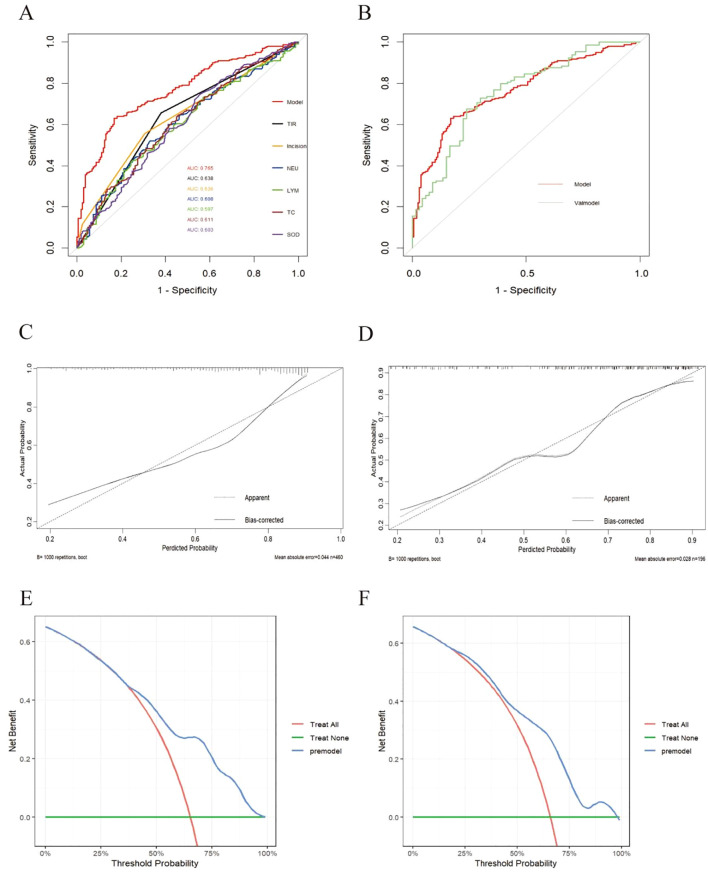
Methods: A total of 656 patients with T2DM during the perioperative period were divided into a TIR standard group (TIR≥70%) and a TIR nonstandard group (TIR<70%) according to the TIR value. Modified Poisson regression was used to analyze postoperative risk factors in patients with T2DM. All patients were subsequently divided into a training set and a validation set at a ratio of 7:3. LASSO regression and the Boruta algorithm were used to screen out the predictive factors related to postoperative infection in T2DM patients in the training set. The discrimination and calibration of the model were evaluated by the area under the receiver operating characteristic curve (ROC) and calibration curve, and the clinical net benefit of the model was evaluated and verified through the decision analysis (DCA) curve. Finally, a forest plot was used for relevant subgroup analysis.

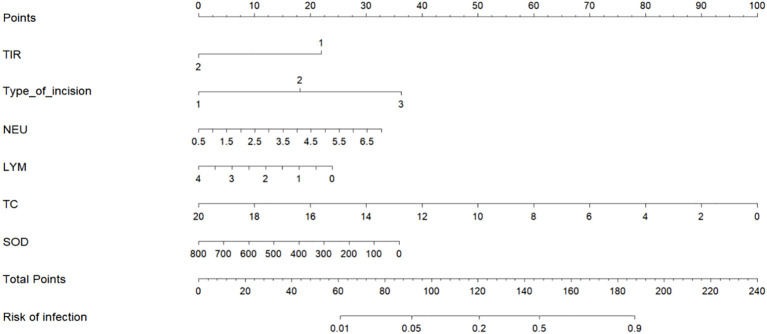
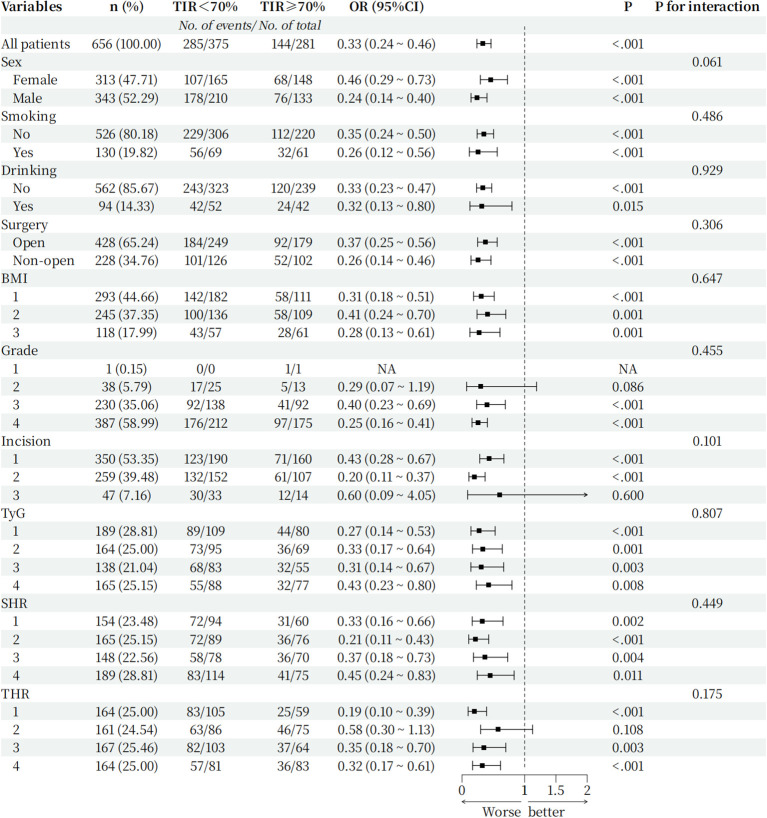
Results: Modified Poisson regression analysis revealed that the TIR was a risk factor for postoperative infection in T2DM patients, and when the TIR was <70%, the risk of postoperative infection increased by 52.2% (P <0.05). LASSO regression and Boruta algorithm screening variables revealed that the TIR, lymphocytes, neutrophils, total serum cholesterol, superoxide dismutase and type of incision were predictive factors for postoperative infection in patients with T2DM (P<0.05). The calibration curve confirmed that the model predictions were consistent with reality, and the decision curve confirmed that the model had better clinical benefits. Finally, the results of the subgroup analysis revealed that in each subgroup, the risk of postoperative infection was greater when the TIR was <70% than when the TIR was ≥70%, and there was no interaction between subgroups.

Conclusion: The TIR is related to postoperative infection and can be used as a new indicator to predict the risk of postoperative infection in patients with type 2 diabetes mellitus.

Keywords: clinical prediction model; postoperative infection; risk factors; time in range; type 2 diabetes.


Conflict of interest statement

The authors declare that the research was conducted in the absence of any commercial or financial relationships that could be construed as a potential conflict of interest.

Figures

Figure 1
Figure 1
Diagram of the steps.
Figure 2
Figure 2
Screen predictive model variables in the training set. (A) LASSO regression pathway. Variable selection using LASSO logistic regression yields coefficient profiles for 56 variables. As the penalty coefficient λ increases, the coefficients of more and more variables are compressed until they are compressed to 0. (B) Cross-validation of LASSO regression. The best penalty coefficient lambda was selected using a twentyfold cross-validation and minimization criterion. The graph has log(lambda) in the horizontal coordinate, binomial deviance in the vertical coordinate, and vertical dashed lines plotted against one standard error criterion. Eight variables with nonzero coefficients were selected by optimal lambda. (C) Boruta. Identify the actual set of features by accurately estimating the importance of each feature. (D) The common subset of LASSO regression and Boruta.
Figure 3
Figure 3
Nomogram of postoperative infection prediction model. The corresponding values of each variable are scored, and the total score is then obtained by summing the scores of all variables, and a vertical line plotted downward from the total score can be labeled to indicate the estimated probability of postoperative infection occurring in a patient with T2DM. TIR: 1: TIR<70% 2: TIR≥70%. Type of incision: 1: Type I incision 2: Type II incision 3: Type III incision.
Figure 4
Figure 4
Validation of the nomogram. (A) Training set model and ROC curves of various indicators. (B) Comparison of ROC curves between training set (model) and validation set. (C) Calibration curve of the postoperative infection prediction model in the training set. The x-axis represents the predicted probability of the model. The y- axis represents the actual probability of occurrence. The diagonal dotted line represents a perfect prediction by an ideal model. The solid line represents the model curve calibrated by 1000 bootstrap resampling methods, a closer fit to the diagonal dotted line represents a better prediction. (D) Calibration curve of the postoperative infection prediction model in the testing set. (E) DCA curve of the postoperative infection prediction model in the training set. The x-axis in the figure represents the threshold probability, the y-axis represents the net benefit rate. The horizontal green solid line indicates that all patients did not receive clinical intervention, the red diagonal line indicates that all patients received clinical intervention, and the blue curve represents the net benefit rate of the prediction model. (F) DCA curve of the postoperative infection prediction model in the testing set.
Figure 5
Figure 5
Hazard ratio for the primary outcome in prespecified subgroups. Incision grouping: 1: Type I incision 2: Type II incision 3: Type III incision; BMI grouping (Grouped by range criteria): 1: BMI<24 kg/m2 2: 24kg/m2≤BMI<28 kg/m2 3: BMI≥28 kg/m2; TyG grouping(Grouped by quartile): 1: TyG ≤ 3.20 2: 3.20<TyG ≤ 3.67 3: 3.67<TyG ≤ 4.07 4: TyG>4.07; SHR grouping(Grouped by quartile): 1: SHR ≤ 0.60 2: 0.60<SHR ≤ 0.80 3: 0.80<SHR ≤ 1.00 4: SHR>1.00; THR grouping (Grouped by quartile): 1: THR ≤ 0.97 2: 0.97<THR ≤ 1.50 3: 1.50<THR ≤ 2.37 4: THR>2.37.

Similar articles

References

    1. Drayton DJ, Birch RJ, D’Souza-Ferrer C, Ayres M, Howell SJ, Ajjan RA. Diabetes mellitus and perioperative outcomes: a scoping review of the literature. Br J Anaesth. (2022) 128:817–28. doi: 10.1016/j.bja.2022.02.013 - DOI - PMC - PubMed
    1. Lung BE, Bisogno M, Kanjiya S, Komatsu DE, Wang ED. Early postoperative complications and discharge time in diabetic patients undergoing total shoulder arthroplasty. J Orthop Surg Res. (2019) 14:9. doi: 10.1186/s13018-018-1051-3 - DOI - PMC - PubMed
    1. Chen X, Wu M, Hu Q, Cheng X. Incidence and risk factors for poor perioperative blood glucose management in patients with diabetic foot: a retrospective study. Ann Palliat Med. (2021) 10:12300–9. doi: 10.21037/apm-21-3095 - DOI - PubMed
    1. Lima R, Fernandes DR, Garcia R, Carvalho L, Silveira R, Teixeira C. Correlation between time on target and glycated hemoglobin in people with diabetes mellitus: systematic review. Rev Lat Am Enfermagem. (2023) 31:e4088. doi: 10.1590/1518-8345.6655.4088 - DOI - PMC - PubMed
    1. Advani A. Positioning time in range in diabetes management. Diabetologia. (2020) 63:242–52. doi: 10.1007/s00125-019-05027-0 - DOI - PubMed

LinkOut - more resources