

A Maximum Entropy Model of the Distribution of Dengue Serotype in Mexico
- PMID: 40303721
- PMCID: PMC12016891
- DOI: 10.1155/2023/3823879
A Maximum Entropy Model of the Distribution of Dengue Serotype in Mexico
Abstract
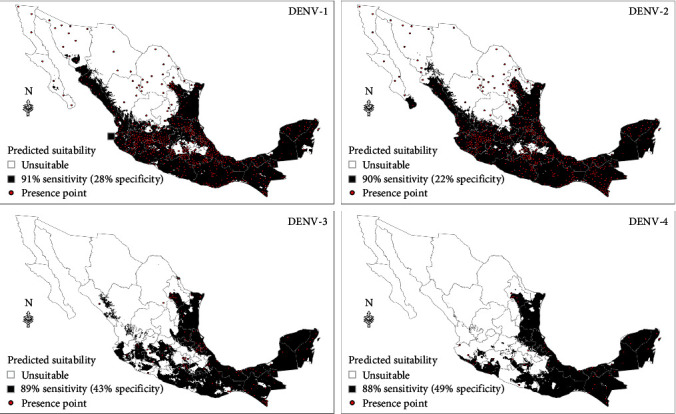
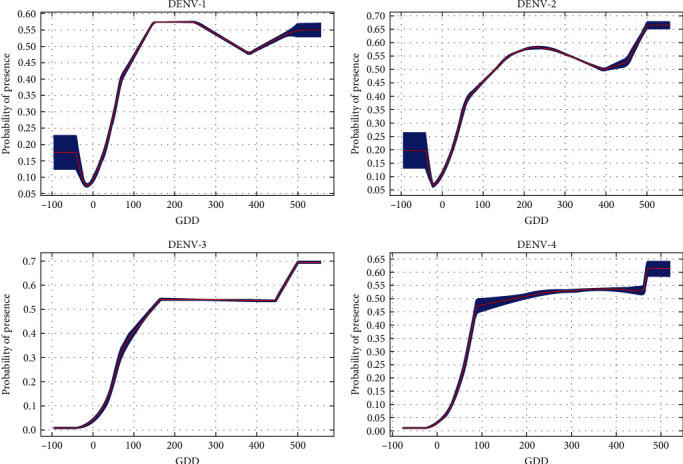
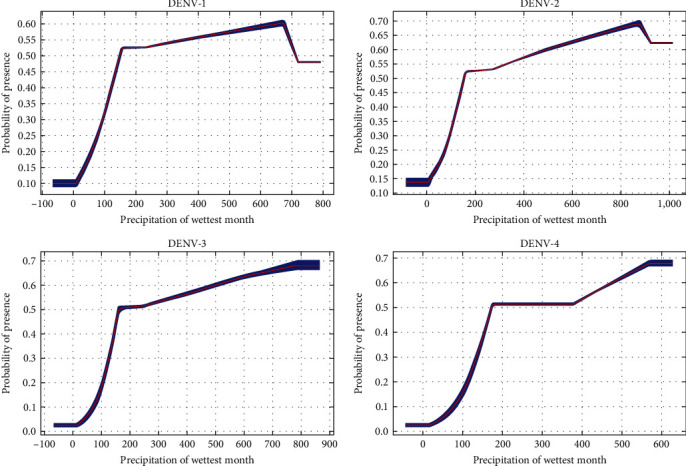
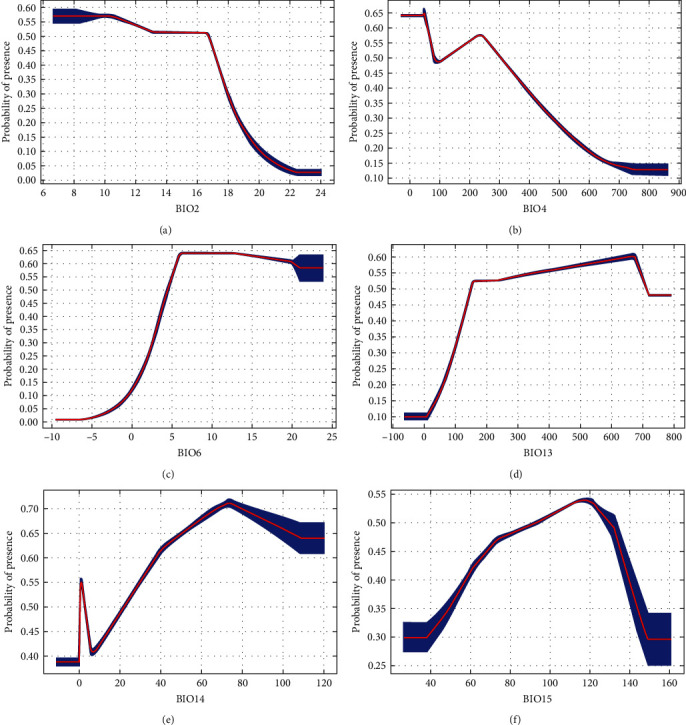
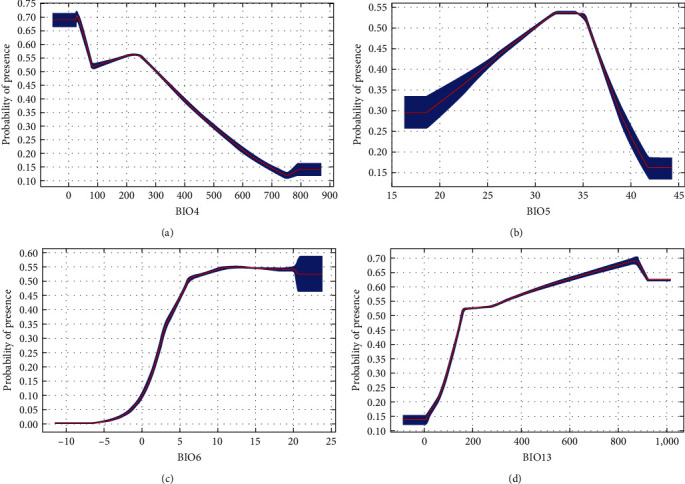
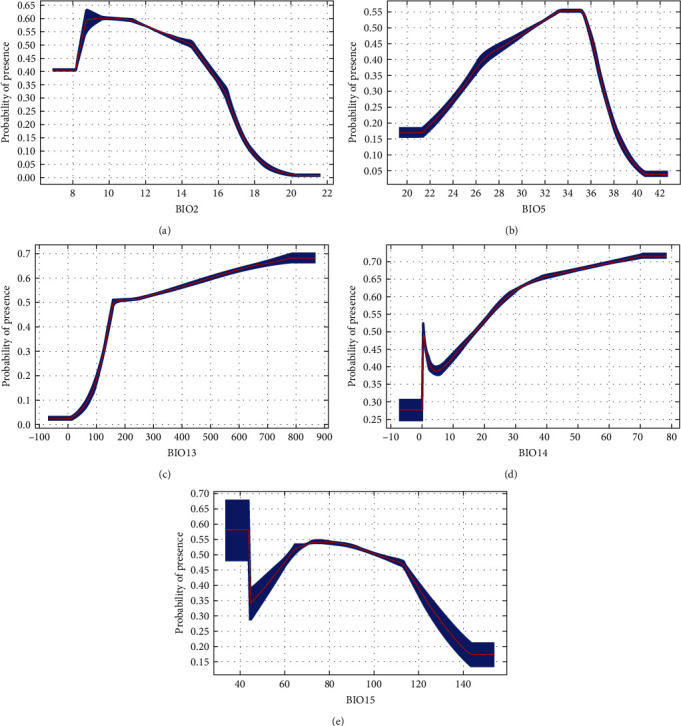
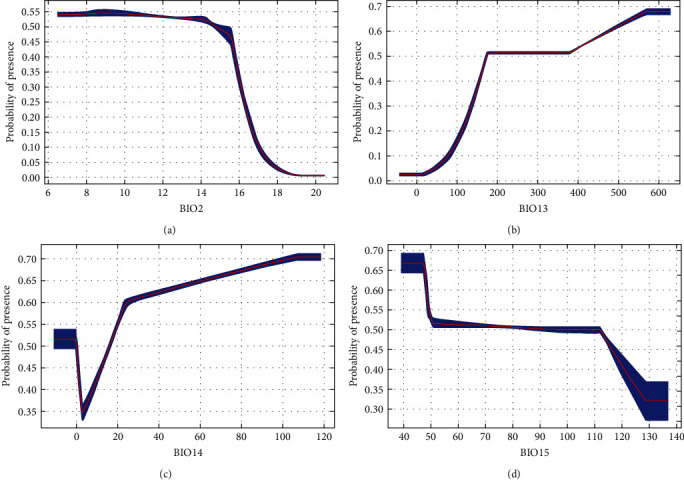
Pathogen strain diversity is an important driver of the trajectory of epidemics. The role of bioclimatic factors on the spatial distribution of dengue virus (DENV) serotypes has, however, not been previously studied. Hence, we developed municipality-scale environmental suitability maps for the four dengue virus serotypes using maximum entropy modeling. We fit climatic variables to municipality presence records from 2012 to 2020 in Mexico. Bioclimatic variables were explored for their environmental suitability to different DENV serotypes, and the different distributions were visualized using three cutoff probabilities representing 90%, 95%, and 99% sensitivity. Municipality-level results were then mapped in ArcGIS. The overall accuracy for the predictive models was 0.69, 0.68, 0.75, and 0.72 for DENV-1, DENV-2, DENV-3, and DENV-4, respectively. Important predictors of all DENV serotypes were the growing degree days for December, January, and February, which are an indicator of higher temperatures and the precipitation of the wettest month. The minimum temperature of the coldest month between -5°C and 20°C was found to be suitable for DENV-1 and DENV-2 serotypes. Respectively, above 700-900 mm of rainfall, the suitability for DENV-1 and DENV-2 begins to decline, while higher humidity still favors DENV-3 and DENV-4. The sensitivity concerning the suitability map was developed for Mexico. DENV-1, DENV-2, DENV-3, and DENV-4 serotypes will be found more commonly in the municipalities classified as suitable based on their respective sensitivity of 91%, 90%, 89%, and 85% in Mexico. As the microclimates continue to change, specific bioclimatic indices may be used to monitor potential changes in DENV serotype distribution. The suitability for DENV-1 and DENV-2 is expected to increase in areas with lower minimum temperature ranges, while DENV-3 and DENV-4 will likely increase in areas that experience higher humidity. Ongoing surveillance of municipalities with predicted suitability of 89% and 85% should be expanded to account for the accurate DENV serotype prevalence and association between bioclimatic parameters.
Copyright © 2023 Esther Annan et al.
Conflict of interest statement
The authors declare that they have no conflicts of interest.
Figures
Similar articles
-
Episodes of the epidemiological factors correlated with prevailing viral infections with dengue virus and molecular characterization of serotype-specific dengue virus circulation in eastern India.Infect Genet Evol. 2018 Mar;58:40-49. doi: 10.1016/j.meegid.2017.12.005. Epub 2017 Dec 13. Infect Genet Evol. 2018. PMID: 29247706
-
The spatial and temporal scales of local dengue virus transmission in natural settings: a retrospective analysis.Parasit Vectors. 2018 Feb 2;11(1):79. doi: 10.1186/s13071-018-2662-6. Parasit Vectors. 2018. PMID: 29394906 Free PMC article.
-
Retrospective Analysis of Severe Dengue by Dengue Virus Serotypes in a Population with Social Security, Mexico 2023.Viruses. 2024 May 13;16(5):769. doi: 10.3390/v16050769. Viruses. 2024. PMID: 38793650 Free PMC article.
-
Circulating dengue virus serotypes and vertical transmission in Aedes larvae during outbreak and inter-outbreak seasons in a high dengue risk area of Sri Lanka.Parasit Vectors. 2021 Dec 23;14(1):614. doi: 10.1186/s13071-021-05114-5. Parasit Vectors. 2021. PMID: 34949219 Free PMC article.
-
The prevalence of dengue virus serotypes in asymptomatic blood donors reveals the emergence of serotype 4 in Saudi Arabia.Virol J. 2017 Jun 9;14(1):107. doi: 10.1186/s12985-017-0768-7. Virol J. 2017. PMID: 28599678 Free PMC article.
References
MeSH terms
LinkOut - more resources
Full Text Sources
Medical
Research Materials
