

Assessing Surveillance of Wildlife Diseases by Determining Mammal Species Vulnerability to Climate Change
- PMID: 40303742
- PMCID: PMC12016766
- DOI: 10.1155/2023/7628262
Assessing Surveillance of Wildlife Diseases by Determining Mammal Species Vulnerability to Climate Change
Abstract
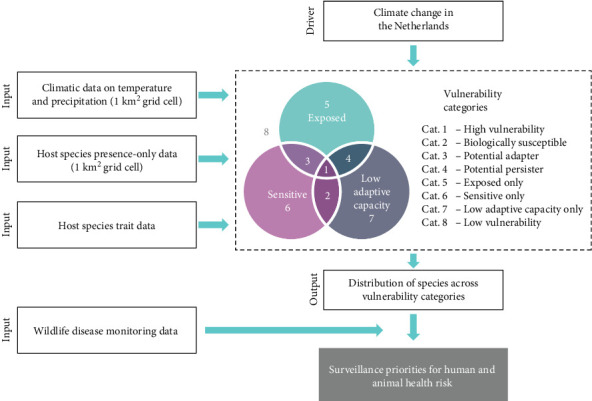
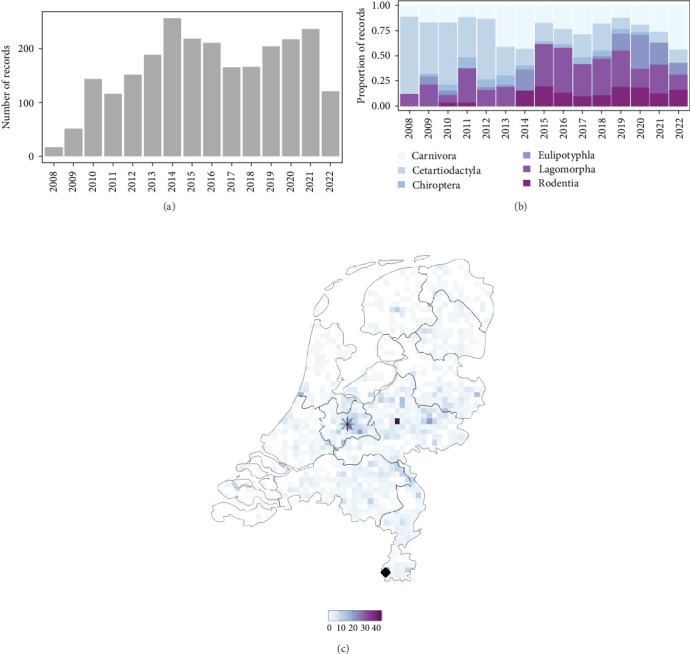
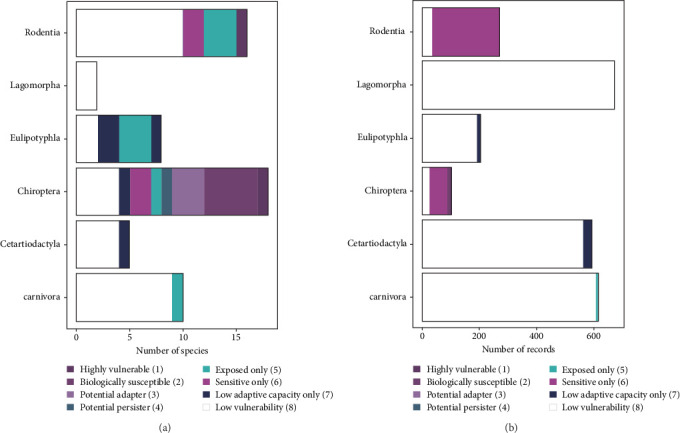
Climate change is one of the drivers of wildlife-borne disease emergence, as it can affect species abundance and fitness, host immunocompetence, and interactions with pathogens. To detect emerging wildlife-borne diseases, countries may implement general wildlife-disease surveillance systems. Such surveillance exists in the Netherlands. However, it is unclear how well it covers host species vulnerable to climate change and consequently disease emergence in these species. Therefore, we performed a trait-based vulnerability assessment (TVA) to quantify species vulnerability to climate change for 59 Dutch terrestrial mammals. Species' vulnerability was estimated based on the magnitude of climatic change within the species' distribution (exposure), the species' potential to persist in situ (sensitivity), and the species' ability to adjust (adaptive capacity). Using these vulnerability categories, we identified priority species at risk for disease emergence due to climate change. Subsequently, we assessed the frequency of occurrence of these priority species compared to other mammal species examined in general wildlife disease surveillance during 2008-2022. We identified 25% of the mammal species to be highly exposed, 24% to be highly sensitive, and 22% to have a low adaptive capacity. The whiskered myotis and the garden dormouse were highly vulnerable (i.e., highly exposed, highly sensitive, and low adaptive capacity), but they are rare in the Netherlands. The Western barbastelle, the pond bat, and the Daubenton's myotis were potential adapters (highly exposed, highly sensitive, and high adaptive capacity). Species vulnerable to climate change were relatively poorly represented in current general surveillance. Our research shows a comprehensive approach that considers both exposures to climate change and ecological factors to assess vulnerability. TVAs, as presented in this study, can easily be adapted to include extra drivers and species, and we would therefore recommend surveillance institutes to consider integrating these types of assessments for evaluating and improving surveillance for wildlife-borne disease emergence.
Copyright © 2023 S. R. Wijburg et al.
Conflict of interest statement
The authors declare that they have no conflicts of interest.
Figures
Similar articles
-
Climate change: effects on animal disease systems and implications for surveillance and control.Rev Sci Tech. 2008 Aug;27(2):339-54. Rev Sci Tech. 2008. PMID: 18819664 Review.
-
Climate change and animal health in Africa.Rev Sci Tech. 2008 Aug;27(2):551-62. Rev Sci Tech. 2008. PMID: 18819677 Review.
-
Integrated approaches and empirical models for investigation of parasitic diseases in northern wildlife.Emerg Infect Dis. 2008 Jan;14(1):10-7. doi: 10.3201/eid1401.071119. Emerg Infect Dis. 2008. PMID: 18258071 Free PMC article.
-
Assessing Mammal Exposure to Climate Change in the Brazilian Amazon.PLoS One. 2016 Nov 9;11(11):e0165073. doi: 10.1371/journal.pone.0165073. eCollection 2016. PLoS One. 2016. PMID: 27829036 Free PMC article.
-
Implementing wildlife disease surveillance in the Netherlands, a One Health approach.Rev Sci Tech. 2016 Dec;35(3):863-874. doi: 10.20506/rst.35.3.2575. Rev Sci Tech. 2016. PMID: 28332644 Review.
References
MeSH terms
LinkOut - more resources
Full Text Sources
Medical
