

Integrative analysis of m6A-SNPs and single-cell RNA sequencing reveals key drivers of endocrine combined with CDK4/6 inhibitor therapy resistance in ER+ breast cancer
- PMID: 40303916
- PMCID: PMC12038269
- DOI: 10.3389/fphar.2025.1590363
Integrative analysis of m6A-SNPs and single-cell RNA sequencing reveals key drivers of endocrine combined with CDK4/6 inhibitor therapy resistance in ER+ breast cancer
Abstract
Background: Endocrine therapy combined with CDK4/6 inhibitors remains a standard treatment for ER+ breast cancer, yet resistance is a prevalent challenge. This study explores the role of N6-methyladenosine (m6A) modifications, influenced by m6A-SNPs, in shaping therapy resistance, utilizing single-cell RNA sequencing to delineate the underlying molecular mechanisms.
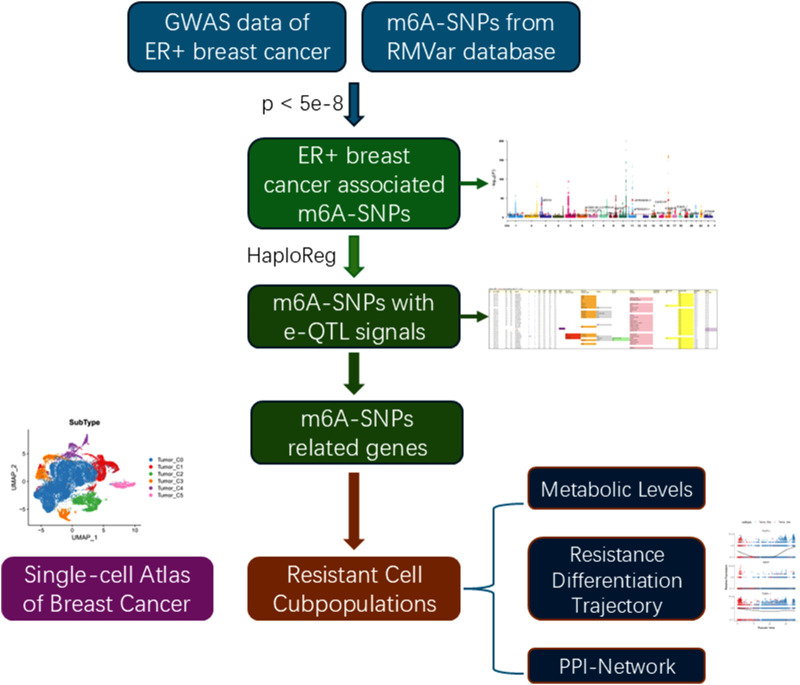
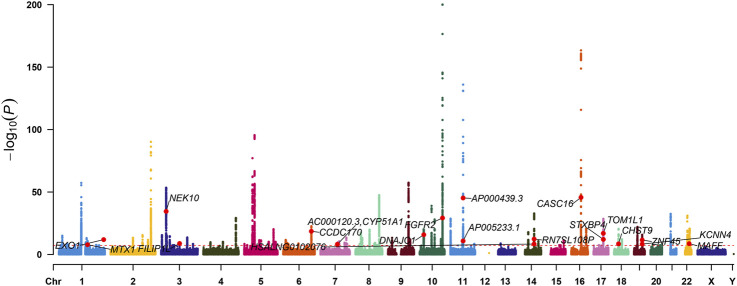
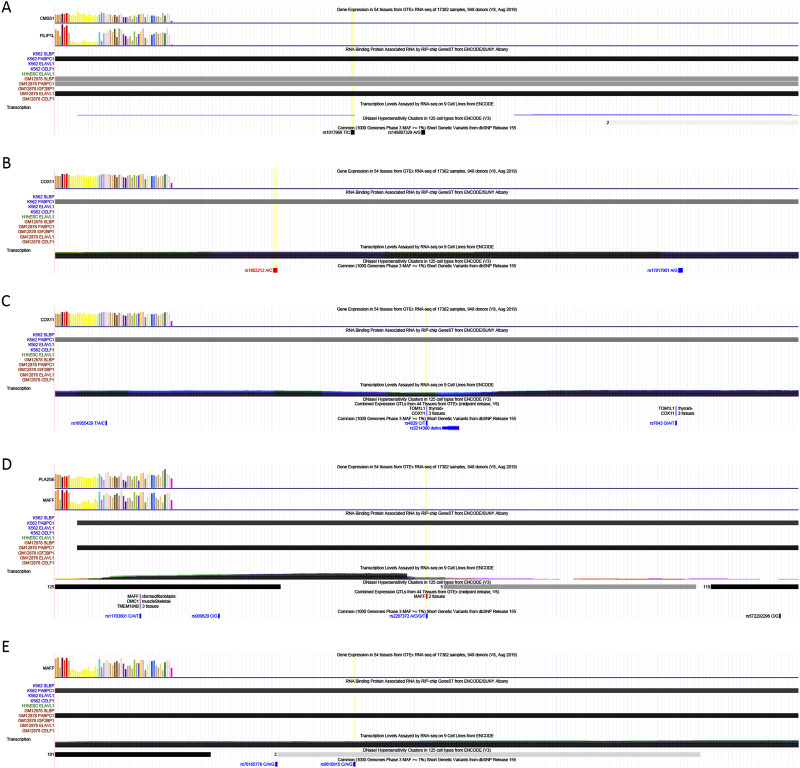
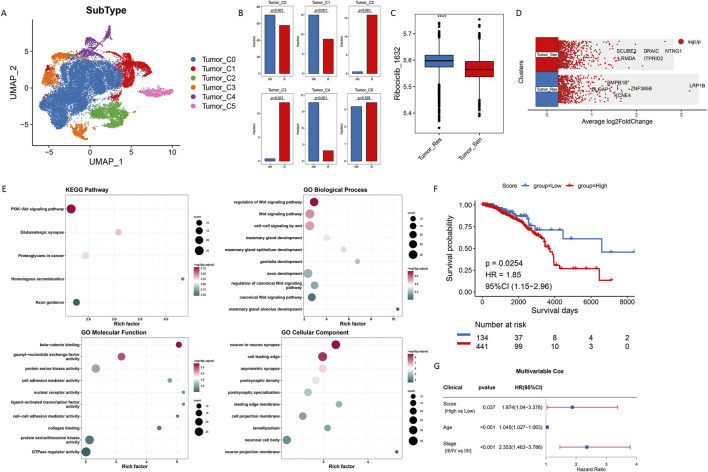
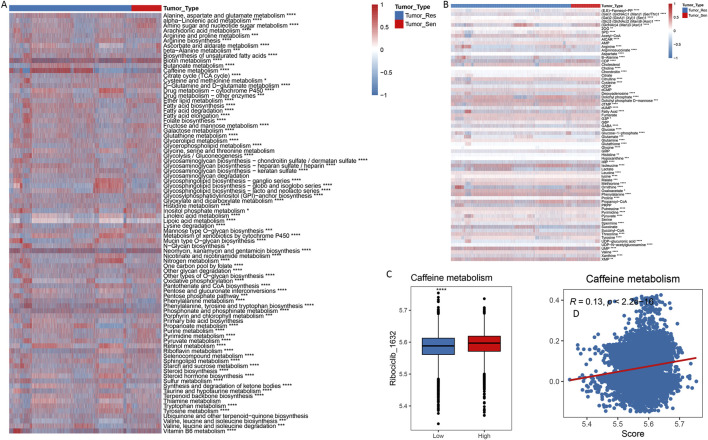
Methods: We integrated genome-wide association study data with single-cell transcriptomic profiles from ER+ breast cancer patients, focusing on differences between resistant and sensitive responses to CDK4/6 inhibitors. m6A-SNPs were identified and analyzed for their impact on gene expression and interactions with RNA-binding proteins, with a particular focus on their roles within key cellular pathways.
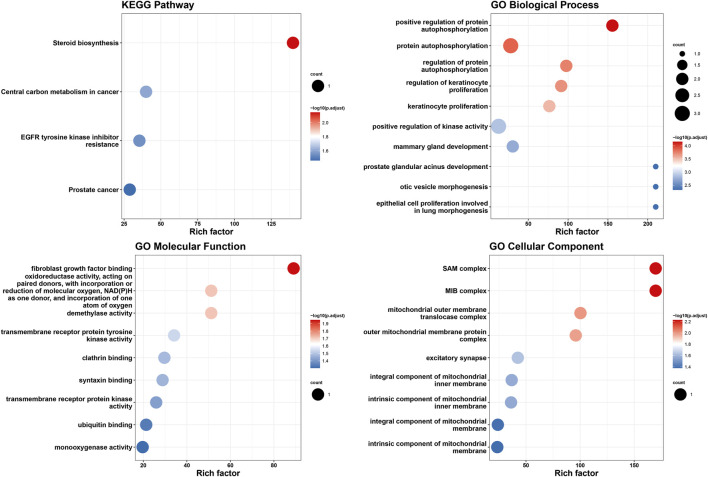
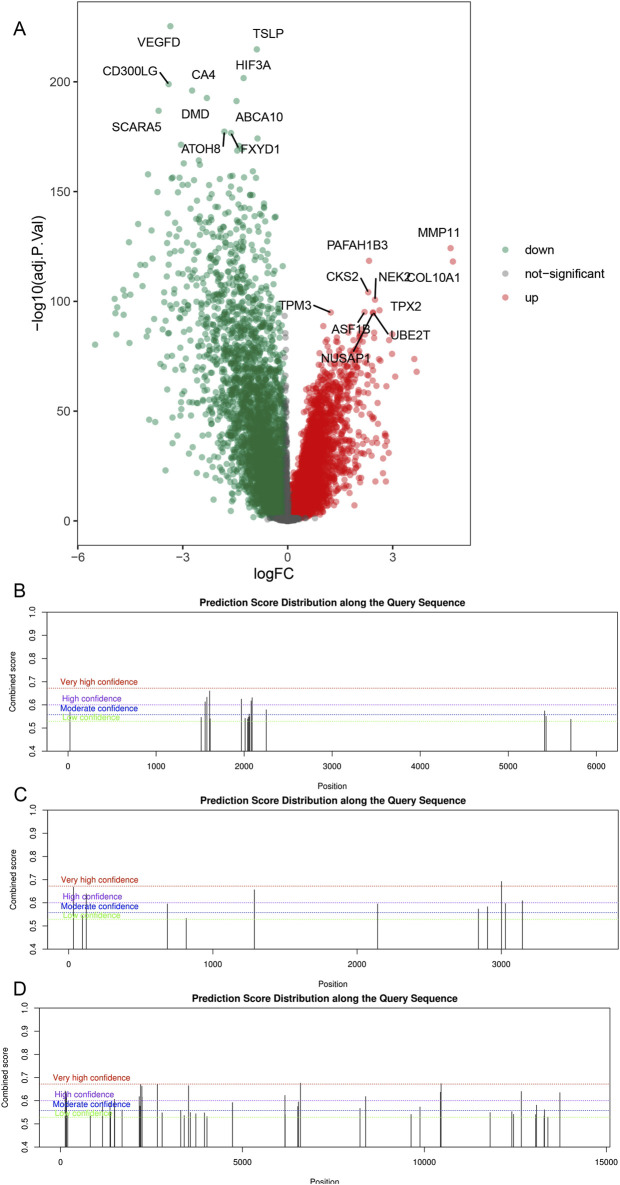
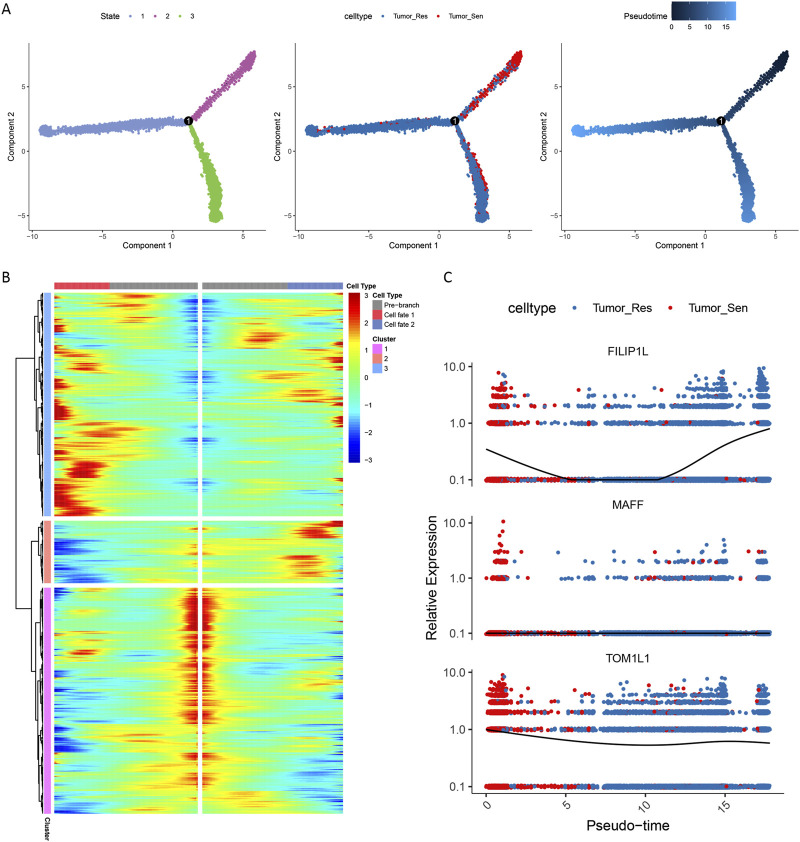
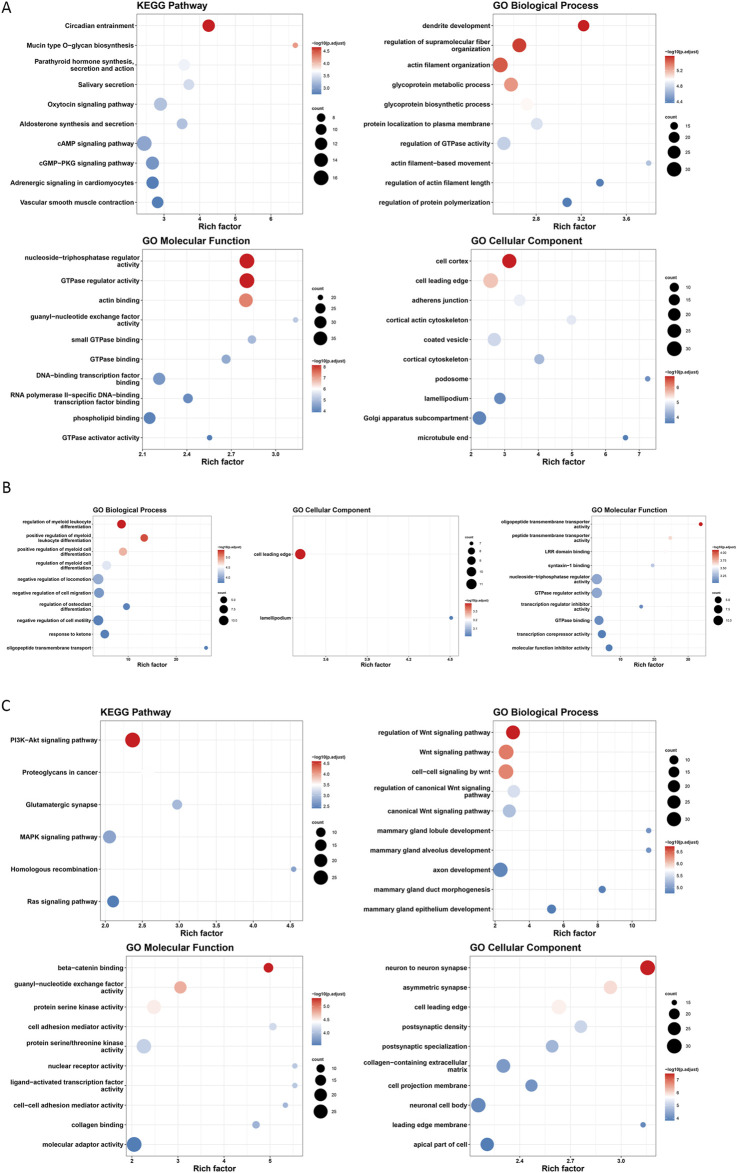
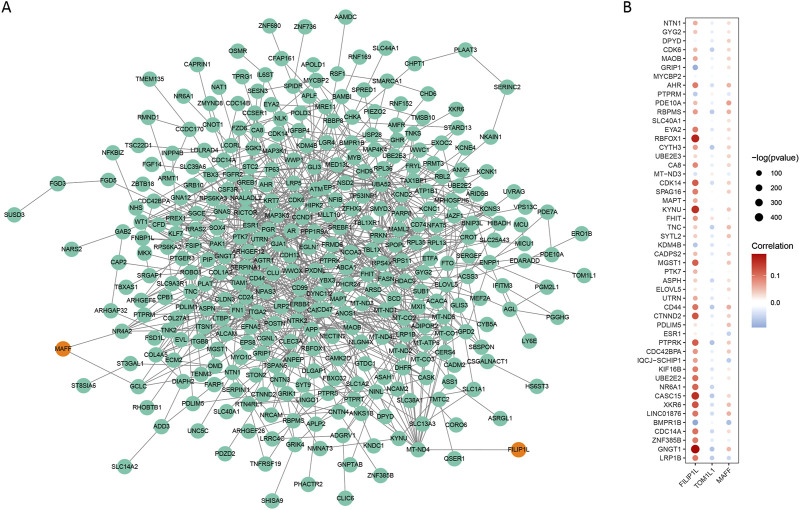
Results: The study identified crucial m6A-SNPs associated with therapy resistance. Notably, changes in the expression of FILIP1L and TOM1L1, related to these SNPs, were mapped using pseudotime trajectory analysis, which traced the evolution from sensitive to resistant cellular states. FILIP1L and TOM1L1 exhibited dynamic expression changes along the trajectory, correlating with significant shifts in cell fate decisions. These findings underscore their potential roles as mediators in the development of resistance, particularly through their involvement in the PI3K-Akt and Wnt signaling pathways, critical in cancer progression and drug resistance.
Conclusion: Our findings emphasize the importance of m6A-SNPs in influencing resistance to therapy in ER+ breast cancer. The dynamic regulation of FILIP1L and TOM1L1 along the developmental trajectory of tumor cells from sensitivity to resistance provides insights into the molecular complexity of therapy resistance. These results pave the way for developing targeted therapies that modify m6A-driven pathways, offering new strategies to counteract resistance and improve patient outcomes.
Keywords: CDK4/6 inhibitor; ER+ breast cancer; m6A methylation; single nucleotide polymorphism; therapy resistance.
Copyright © 2025 Ming, Zhang, Wu, Zhan, Huang and Liu.
Conflict of interest statement
The authors declare that the research was conducted in the absence of any commercial or financial relationships that could be construed as a potential conflict of interest.
Figures
Similar articles
-
Targeting activated PI3K/mTOR signaling overcomes acquired resistance to CDK4/6-based therapies in preclinical models of hormone receptor-positive breast cancer.Breast Cancer Res. 2020 Aug 14;22(1):89. doi: 10.1186/s13058-020-01320-8. Breast Cancer Res. 2020. PMID: 32795346 Free PMC article.
-
N6-Methyladenosine (m6A) Sequencing Reveals Heterodera glycines-Induced Dynamic Methylation Promoting Soybean Defense.Phytopathology. 2024 Jul;114(7):1612-1625. doi: 10.1094/PHYTO-12-23-0474-R. Epub 2024 Jul 3. Phytopathology. 2024. PMID: 38478699
-
Elacestrant (RAD1901) exhibits anti-tumor activity in multiple ER+ breast cancer models resistant to CDK4/6 inhibitors.Breast Cancer Res. 2019 Dec 18;21(1):146. doi: 10.1186/s13058-019-1230-0. Breast Cancer Res. 2019. PMID: 31852484 Free PMC article.
-
N6-Methyladenosine methylation modification in breast cancer: current insights.J Transl Med. 2024 Oct 28;22(1):971. doi: 10.1186/s12967-024-05771-x. J Transl Med. 2024. PMID: 39468547 Free PMC article. Review.
-
Resistance Mechanisms to Combined CDK4/6 Inhibitors and Endocrine Therapy in ER+/HER2- Advanced Breast Cancer: Biomarkers and Potential Novel Treatment Strategies.Cancers (Basel). 2021 Oct 27;13(21):5397. doi: 10.3390/cancers13215397. Cancers (Basel). 2021. PMID: 34771560 Free PMC article. Review.
References
LinkOut - more resources
Full Text Sources
Miscellaneous