. 2025 Feb 13:48:55-70.
doi: 10.1016/j.bioactmat.2025.02.010. eCollection 2025 Jun.

cGAMP-targeting injectable hydrogel system promotes periodontal restoration by alleviating cGAS-STING pathway activation

Affiliations

cGAMP-targeting injectable hydrogel system promotes periodontal restoration by alleviating cGAS-STING pathway activation

Xiang Liu et al. Bioact Mater. .

Abstract

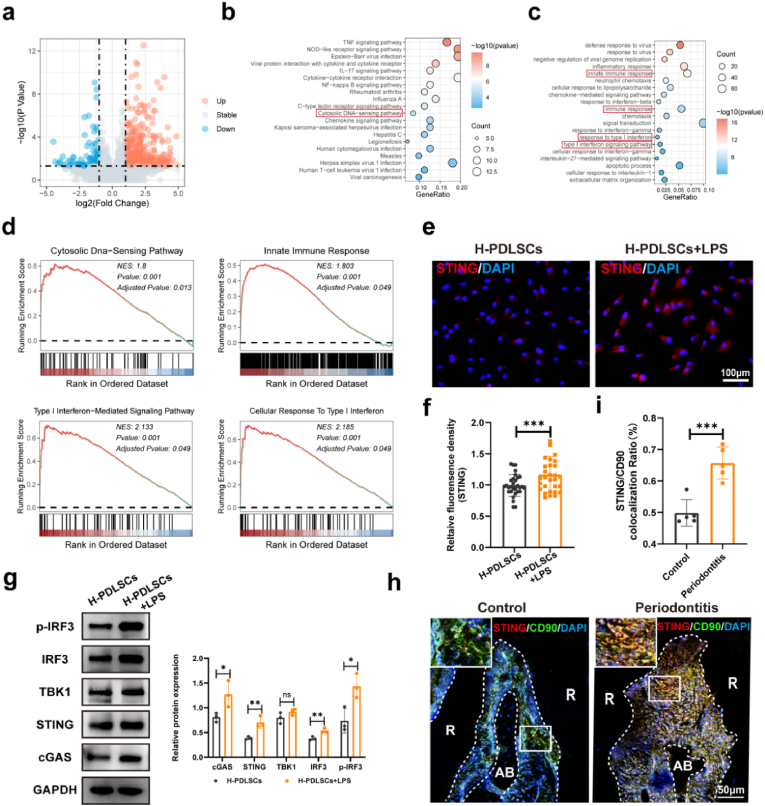
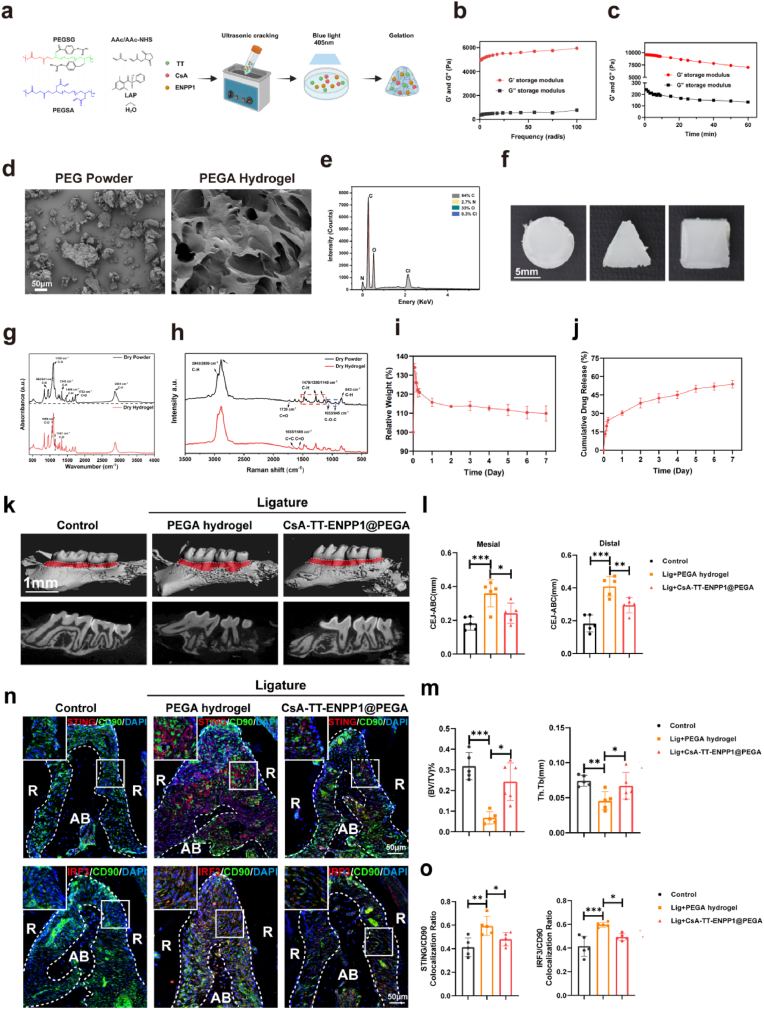
The impaired function of periodontal ligament stem cells (PDLSCs) impedes restoration of periodontal tissues. The cGAS-cGAMP-STING pathway is an innate immune pathway that sensing cytosolic double-stranded DNA (dsDNA), but its role in regulating the function of PDLSCs is still unclear. In this study, we found that mitochondrial DNA (mtDNA) was released into the cytoplasm through the mitochondrial permeability transition pore (mPTP) in PDLSCs upon inflammation, which binds to cGAS and activated the STING pathway by promoting the production of cGAMP, and ultimately impaired the osteogenic differentiation of PDLSCs. Additionally, it is first found that inflammation can down-regulate the level of the ATP-binding cassette membrane subfamily member C1 (ABCC1, a cGAMP exocellular transporter) and ectonucleotide pyrophosphatase/phosphodiesterase 1 (ENPP1, a cGAMP hydrolase), which further aggravated the accumulation of intracellular cGAMP, leading to the persistent activation of the cGAS-STING pathway and thus the impaired the differentiation capacity of PDLSCs. Furthermore, we designed a hydrogel system loaded with a mPTP blocker, an ABCC1 agonist and ENPP1 to promote periodontal tissue regeneration by modulating the production, exocytosis, and clearance of cGAMP. In conclusion, our results highlight the profound effects, and specific mechanisms, of the cGAS-STING pathway on the function of stem cells and propose a new strategy to promote periodontal tissue restoration based on the reestablishment of cGAMP homeostasis.

Keywords: Inflammatory environment; Injectable hydrogel system; Osteogenic differentiation; Periodontal ligament stem cells; cGAMP homeostasis; cGAS-STING pathway.


Conflict of interest statement

The authors declare that they have no known competing financial interests or personal relationships that could have appeared to influence the work reported in this paper.

Figures

Image 1
Graphical abstract
Fig. 1
Fig. 1
Schematic representation of how CsA-ABCC1-ENPP1@PEGA hydrogel restore the cGAMP homeostasis, and thus block cGAS-STING pathway to rescue the function of PDLSCs to facilitate periodontal recovery.
Fig. 2
Fig. 2
The cGAS-STING pathway was activated in PDLSCs under inflammatory conditions. (a) Volcano plot of gene expression in H-PDLSCs and H-PDLSCs + LPS. (b) The KEGG pathway enrichment analysis (c) GO enrichment and (d) GSEA analysis after LPS treatment. (e) IF and quantitative analysis (f) of STING in H-PDLSCs and H-PDLSCs + LPS. Scale bar, 100 μm. n = 30 cells in each group (10 cells quantified per replicate). (g) WB analysis of proteins involved in the cGAS-STING pathway. (h) IF staining of PDLSCs (CD90, green) and STING (red) in periodontal tissueand. R: root, AB: alveolar bone. Scale bar, 50 μm. (i) Quantified the expression of STING in (h).
Fig. 3
Fig. 3
Inhibiting cGAS-STING pathway improved PDLSC osteogenic differentiation and periodontal restoration. (a) siRNA-mediated STING knockdown improved the osteogenic differentiation of H-PDLSCs + LPS cells. (b) Schematic diagram of the treatment of STING−/− mice. (c) IF staining of PDLSCs (CD90, green) and IRF3 (red) in the periodontal tissue of mice from the different treatment groups. R: root, AB: alveolar bone. Scale bar, 50 μm. (d) Representative Macro-CT images of the alveolar bone of mice. (e) Quantitative analysis of the CEJ-ABC, BV/TV % and Th.N. (f) WB analysis of proteins involved in the cGAS-STING pathway after H151 treatment. (g) Alizarin Red staining and quantitative analysis of mineralized nodules after H151 treatment. (h) Schematic diagram of C176 treatment of ligature-induced periodontitis in C57 mice. (i) Representative images of Macro-CT and H&E is staining of the alveolar bone of mice from different treatment groups. The red color indicates root exposure. R: root, AB: alveolar bone. Scale bar, 1 mm. (j) Quantitative analysis of the CEJ-ABC, BV/TV % and Th.Tb. ∗P < 0.05, ∗∗P < 0.01, ∗∗∗P < 0.001, ns, not significant.
Fig. 4
Fig. 4
cGAS-STING pathway activation was associated with cytoplasmic release of mitochondrial DNA. (a) Mitochondrial respiratory capacity analysis (oxygen consumption rate; OCR) measured with a Seahorse XFe24 analyzer. (b) Representative images of mitochondria stained with Mito Tracker. Scale bar, 10 μm. (c) Mitochondrial morphology (branch length and number per cell) analysis (n = 10 cells in each group). (d) IF and quantitative analysis of MitoSox staining. Scale bar, 100 μm. n = 30 cells in each group (10 cells quantified per replicate). (e) IF and quantitative analysis of ▲Ψm (TMRM staining). Scale bar, 50 μm. n = 30 cells in each group (10 cells quantified per replicate). (f) IF and quantitative analysis of 8-OHdG staining. Scale bar, 50 μm. n = 30 cells in each group (10 cells quantified per replicate). (g) IF staining of mitochondria (Mito Tracker, red) and DNA (anti-dsDNA antibody, green). White boxed regions in the panels are enlarged. The white arrows indicate dsDNA outside mitochondria. Scale bar, 10 μm. (h) Co-localization analysis of data from (g). (i) qRT-PCR analysis to detect the source of cytosolic DNA. (j) WB analysis of proteins in the cGAS-STING pathway after mtDNA depletion. (k) Alizarin Red staining and quantitative analysis of mineralized nodules. ∗P < 0.05, ∗∗P < 0.01, ∗∗∗P < 0.001, ns, not significant.
Fig. 5
Fig. 5
Inflammatory stimulation triggers mtDNA release into the cytoplasm via the mPTP channel. (a) Apoptosis was detected by PI staining and flow cytometry. (b) WB analysis of BAX, VDAC, and HK2 expression. (c) Representative TEMs of H-PDLSCs and H-PDLSCs + LPS. Structures colored yellow indicate mitochondria, Structures delineated with red dashed line are endoplasmic reticulum, green arrows indicate matrix particle. Scale bar, 500 nm. (d) The mitochondrial Ca2+ was determined by Rhod-2 AM staining and quantitative analysis by flow cytometry. Scale bar, 10 μm. (e) The mPTP opening was determined by Calcein AM and quantitative analysis of MFI by flow cytometry. Scale bar, 10 μm. (f) WB analysis of proteins in the cGAS-STING pathway after CsA treatment. (g) Alizarin Red staining and quantitative analysis of mineralized nodules. (h) Representative Macro-CT images and H&E is staining of the alveolar bone of mice from different treatment groups. R: root, AB: alveolar bone. (i) Quantitative analysis of the CEJ-ABC, BV/TV % and Th.Tb. ∗P < 0.05, ∗∗P < 0.01, ∗∗∗P < 0.001, ns, not significant.
Fig. 6
Fig. 6
Disturbance of cGAMP homeostasis results in intracellular cGAS-STING pathway activation. (a) ELISA analysis of the extracellular and intracellular cGAMP levels in the H-PDLSC and H-PDLSC + LPS groups over time. (b) Expression of ABCC1 mRNA quantified by qRT-PCR. (c, d) WB analysis of ABCC1 expression. (e) Expression of ENPP1 mRNA quantified by qRT-PCR. (f) ABCC1 agonist TT promotes extracellular transport of cGAMP. (g) Extracellular cGAMP detection after combination application of TT and ENPP1. (h) WB analysis of the cGAS-STING pathway after combination application of TT and ENPP1. (i) AR staining and quantitative analysis of mineralized nodules. ∗P < 0.05, ∗∗P < 0.01, ∗∗∗P < 0.001, ns, not significant.
Fig. 7
Fig. 7
CsA-TT-ENPP1@PEGA hydrogel restores cGAMP homeostasis and facilitates periodontal regeneration. (a) Schematic diagram of PEGA hydrogel synthesis. (b) Variation of the storage modulus and loss modulus (G′ and G’’) of the PEGA hydrogel under 5 % strain. (c) Variation of the storage modulus and loss modulus (G'and G”) in a time sweep of the PEGA hydrogel under 5 % strain and 6 rad/s (d) SEM images of PEG powder and PEGA hydrogel. Scale bar, 50 μm. (e) EDS spectrum of PEGA. (f) Photographs of injectable PEGA hydrogel on different 3D patterns in vitro. Scale bar, 5 mm. (g) FTIR spectra and (h) Raman spectra of PEG powder and the PEGA hydrogel. (i) Swelling and degradation curves of the PEGA hydrogel in PBS. (i) Cumulative release profile of DOX from the PEGA hydrogel. (k) Representative Micro-CT images of the alveolar bone of mice from different treatment groups. Scale bar, 1 mm. (l) Quantitative analysis of the CEJ-ABC. (m) Quantitative analysis of the BV/TV % and Th.Tb. (n) IF staining of PDLSCs (CD90, green) and STING (STING, red) in the periodontal tissue of mice from the different treatment groups. R: root, AB: alveolar bone. (o) Colocalization analysis of CD90 positive cells and STING positive cells. ∗P < 0.05, ∗∗P < 0.01, ∗∗∗P < 0.001, ns, not significant.

References

    1. Xin L., et al. Four-Octyl itaconate ameliorates periodontal destruction via Nrf2-dependent antioxidant system. Int. J. Oral Sci. 2022;14(1):27. - PMC - PubMed
    1. Rosier B.T., Marsh P.D., Mira A. Resilience of the oral microbiota in Health: mechanisms that prevent dysbiosis. J. Dent. Res. 2018;97(4):371–380. - PubMed
    1. Di Stefano M., et al. Impact of oral microbiome in periodontal Health and periodontitis: a critical review on prevention and treatment. Int. J. Mol. Sci. 2022;23(9) - PMC - PubMed
    1. Lei F., et al. Treatment of inflammatory bone loss in periodontitis by stem cell-derived exosomes. Acta Biomater. 2022;141:333–343. - PubMed
    1. Zhai Q., et al. Dental stem cell and dental tissue regeneration. Front. Med. 2019;13(2):152–159. - PubMed

LinkOut - more resources