. 2025 Apr 15:15:1523137.
doi: 10.3389/fonc.2025.1523137. eCollection 2025.

The TFRC as a prognostic biomarker and potential therapeutic target in cervical cancer: a preliminary study

Affiliations

The TFRC as a prognostic biomarker and potential therapeutic target in cervical cancer: a preliminary study

Jing Wang et al. Front Oncol. .

Abstract

Background: Early detection and treatment of CIN or early-stage cervical cancer lead to better clinical outcomes compared to treating advanced-stage patients. Thus, specific biomarkers for the diagnosis and prognosis of CIN and early-stage cervical cancer should be urgently explored.

Methods: We analyzed tumor based on genes closely related to OS in the database with GSE63514, GSE7803, GSE9750 and TCGA data sets, the top 20 core genes were screened out. Notably, transferrin receptor (TFRC) emerged as a prioritized candidate due to its dual role in cellular iron homeostasis and oncogenic signaling. However, the exact role of TFRC in the development and progression of cervical cancer remains unclear. We then used various bioinformatics methods and mathematical models to analyze those data, aiming to investigate the clinical significance of TFRC in cervical cancer and illustrate its association with tumor immunity. In addition, the molecular function and mechanisms of TFRC were revealed by gene ontology, Kyoto Encyclopedia of Genes and Genomes, and gene set enrichment analysis. Immunohistochemistry was employed to assess TFRC protein expression in 19 cervical cancers, 16 HSILs and 15 normal cervical tissues.

Results: TFRC was highly expressed in CESC in the TCGA and GSE9750 datasets. Meanwhile, the expression of TFRC was correlated with pathological stage, lymph node metastasis, malignant degree of cervical lesions and HPV infection status. Our analysis confirmed that TFRC expression was higher in CESC tissues compared to normal cervical tissues, and it was also elevated in HSIL relative to normal tissues, as determined by IHC staining. Increased TFRC expression was linked to decreased overall survival (OS) (p = 0.024), disease-specific survival (DSS) (p = 0.009), and progression-free interval (PFI) (p = 0.007) in CESC patients. In different clinical stages, pathological T stages, and pathological N stages, higher TFRC expression was significantly associated with worse survival for OS and DSS. We constructed a nomogram model, TFRC contributed significantly to the prognosis and exhibited good predictive power for the OS and the DSS. Finally, we confirmed that immunosuppression in cervical cancer is closely related to high TFRC expression.

Conclusions: TFRC exhibits significant diagnostic and prognostic value in cervical cancer.

Keywords: TFRC; bioinformatics; cervical cancer; cervical intraepithelial neoplasia; immune cell infiltration.


Conflict of interest statement

The authors declare that the research was conducted in the absence of any commercial or financial relationships that could be construed as a potential conflict of interest.

Figures
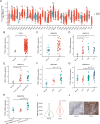
Figure 1
Figure 1
Pan-cancer TFRC expression analysis. (A) The mRNA expression of TFRC in 33 tumors in TCGA_GTEx samples. (B) TFRC expression in tumor and normal tissues in cervical cancer from TCGA data. (C) TFRC expression in normal cervical surface epithelium and cervical cancer epithelial component from GSE9750. (D) TFRC expression in normal cervical surface epithelium and cervical cancer epithelial component (IB1, IB2 and IIA) from GSE7410. (E) TFRC expression in normal cervical surface epithelium and cervical cancer epithelial component (with/without LN) from GSE7410. (F) TFRC expression in normal cervical surface epithelium, high-grade squamous intraepithelial lesions (HSIL) and cervical cancer epithelial component from GSE7803. (G) TFRC expression in normal cervical surface epithelium, low-grade squamous intraepithelial lesions (LSIL), high-grade squamous intraepithelial lesions (HSIL) and cervical cancer epithelial component from GSE63514. (H) TFRC expression in normal cervical surface epithelium (HPV negative), non-malignant with HPV16 and cervical cancer epithelial component (with HPV16) from GSE67522. (I) TFRC expression in tumor and normal tissues in cervical cancer from HPA data. (J) The IHC images of TFRC in normal and tumor tissues extracted from the HPA. *p < 0.05, **p < 0.01, and ***p < 0.001.
Figure 2
Figure 2
Correlation between TFRC expression and cancer prognosis. (A–C) Kaplan–Meier analysis of overall survival(HR=1.73, p = 0.024), disease specific survival(HR=2.10, p = 0.009) and progress free interval(HR=1.93, p = 0.007) in TCGA. (D-F) Kaplan–Meier analysis of clinical stage(HR=1.76, p = 0.019), pathological T stage (HR=1.81, p = 0.041), and pathological N stage(p = 0.053) in CESC for OS. (G-I) Kaplan–Meier analysis of clinical stage(HR=2.14, p = 0.007), pathological T stage(HR=2.21, p = 0.021), and pathological N stage (p = 0.051) in CESC for DSS. (J-L) Kaplan–Meier analysis of clinical stage (HR=1.97, p = 0.006), pathological T stage (HR=2.03, p = 0.011), and pathological N stage (p = 0.140) in CESC for PFI. Results with COX p <0.05 are shown.
Figure 3
Figure 3
Nomogram models were established and evaluated in cervical cancer. (A) Establishment of a nomogram model incorporating TFRC expression for OS. (B) Calibration curves were used to evaluate the nomogram model for OS at 1-year, 3-year, and 5-year. (C) Building a nomogram model containing TFRC expression for DSS. (D) The 1-year, 3-year and 5-year calibration curves were used to evaluate the prediction accuracy of the nomogram model for DSS.
Figure 4
Figure 4
Function and pathway enrichment analyses of TFRC in cervical cancer. (A) A volcano plot of the 6,652 differential genes in cervical cancer. (B) Significant KEGG pathways of the top 100 genes most positively correlated with TFRC. (C-E) Gene Ontology terms of the top 100 genes most positively correlated with TFRC, including biological processes (BP), molecular function (MF), and cell component (CC). (F-I) Significant GSEA results of the top 100 genes most positively correlated with TFRC, including KEGG pathways and Reactome pathways.
Figure 5
Figure 5
Association between immune cell infiltration and TFRC expression in cervical cancer. (A, B) Immune cell infiltration level in the TFRC high expression group and TFRC low expression group in TCGA cohort. (C) The abundance of different cell types calculated by MCPCOUNTER was shown in the heatmap. There were significant differences between TFRC expression, tumor stage, grade, and immune cell invasion.
Figure 6
Figure 6
Association between immune cell infiltration and TFRC expression in pan-cancer. Immune cell infiltration level in the TFRC high expression group and TFRC low expression group in TISIDB database (A). Correlations between TFRC and immunoinhibitors (B), immunostimulators (C), MHC molecules (D), chemokines (E), receptors (F) are shown in heatmaps, calculated by TISIDB database, where red and blue represent positive and negative correlations, respectively; Color shades represent strong correlations.
Figure 7
Figure 7
The correlation of TFRC expression and immune cell infiltration. (A–C) Heatmaps of correlations between TFRC expression and Cancer associated fibroblast, T cells CD8+, and B cell in TIMER2 database, respectively. (D-F) The link between TFRC expression and Cancer associated fibroblast, T cells CD8+, and B cell in XCELL algorithms. (G-I) The effect of immune cells infiltration on OS was related to the expression of TFRC.
Figure 8
Figure 8
Expression of TFRC in cervical tissue. (A-C) IHC representative images of TFRC in normal cervical tissues. (D-F) images of TFRC in high-grade squamous intraepithelial lesions (HSIL). (G-I) IHC representative image of TFRC expression in cervical cancer tissue. (J) Positive area ratio of the IHC image shown. ****p < 0.0001.

References

    1. Sung H, Ferlay J, Siegel RL, Laversanne M, Soerjomataram I, Jemal A, et al. . Global cancer statistics 2020: GLOBOCAN estimates of incidence and mortality worldwide for 36 cancers in 185 countries. CA Cancer J Clin. (2021) 71:209–49. doi: 10.3322/caac.21660 - DOI - PubMed
    1. Logel M, El-Zein M, Franco EL, Gonzalez E. Species-level characterization of the cervicovaginal microbiota and its role in human papillomavirus-associated cervical carcinogenesis. J Med Virol. (2024) 96:e29764. doi: 10.1002/jmv.29764 - DOI - PubMed
    1. Illah O, Olaitan A. Updates on HPV vaccination. Diagnostics (Basel). (2023) 13. doi: 10.3390/diagnostics13020243 - DOI - PMC - PubMed
    1. Chan CK, Aimagambetova G, Ukybassova T, Kongrtay K, Azizan A. Human papillomavirus infection and cervical cancer: epidemiology, screening, and vaccination-review of current perspectives. J Oncol. (2019) 2019:3257939. doi: 10.1155/2019/3257939 - DOI - PMC - PubMed
    1. Zhao Q, Yang S, Hao S, Chen Z, Tang L, Wu Z, et al. . Identification of transcriptionally-active human papillomavirus integrants through nanopore sequencing reveals viable targets for gene therapy against cervical cancer. J Med Virol. (2024) 96:e29769. doi: 10.1002/jmv.29769 - DOI - PubMed

LinkOut - more resources