. 2025 Apr 22;53(8):gkaf347.
doi: 10.1093/nar/gkaf347.

PRMT5 promotes full-length HTT expression by repressing multiple proximal intronic polyadenylation sites

Affiliations

PRMT5 promotes full-length HTT expression by repressing multiple proximal intronic polyadenylation sites

Manisha Yadav et al. Nucleic Acids Res. .

Abstract

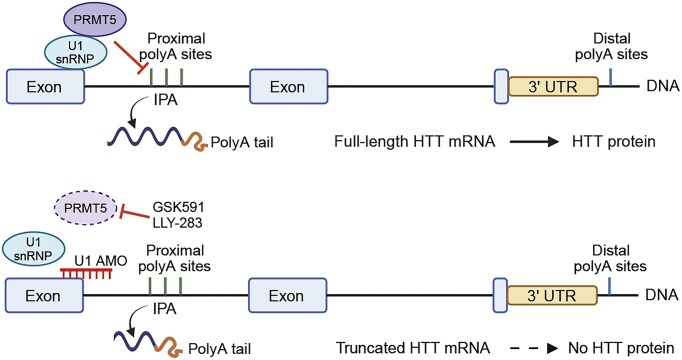
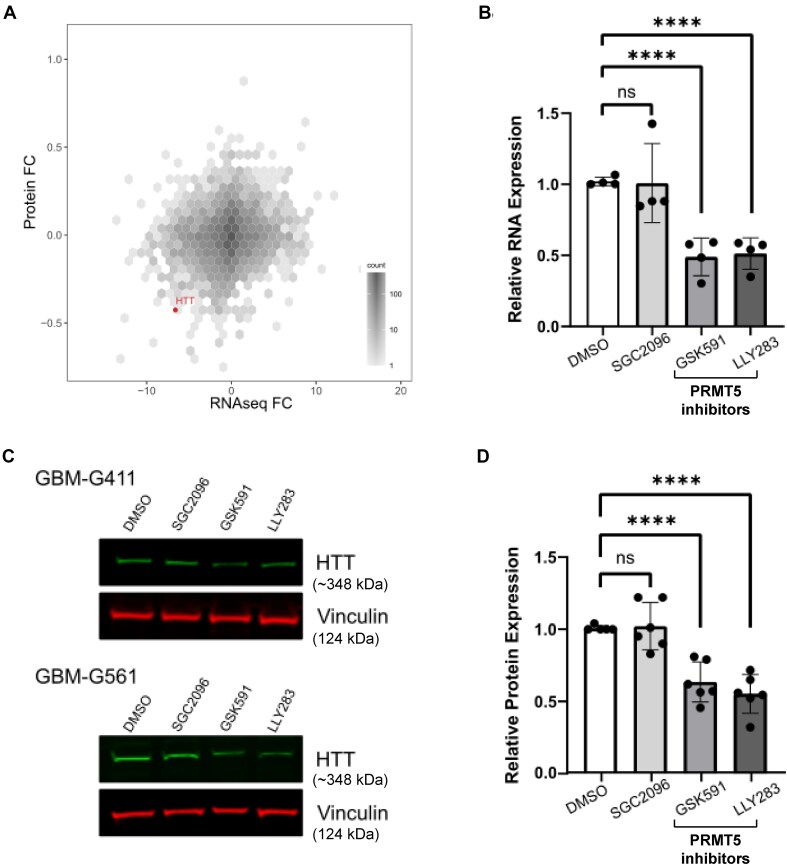
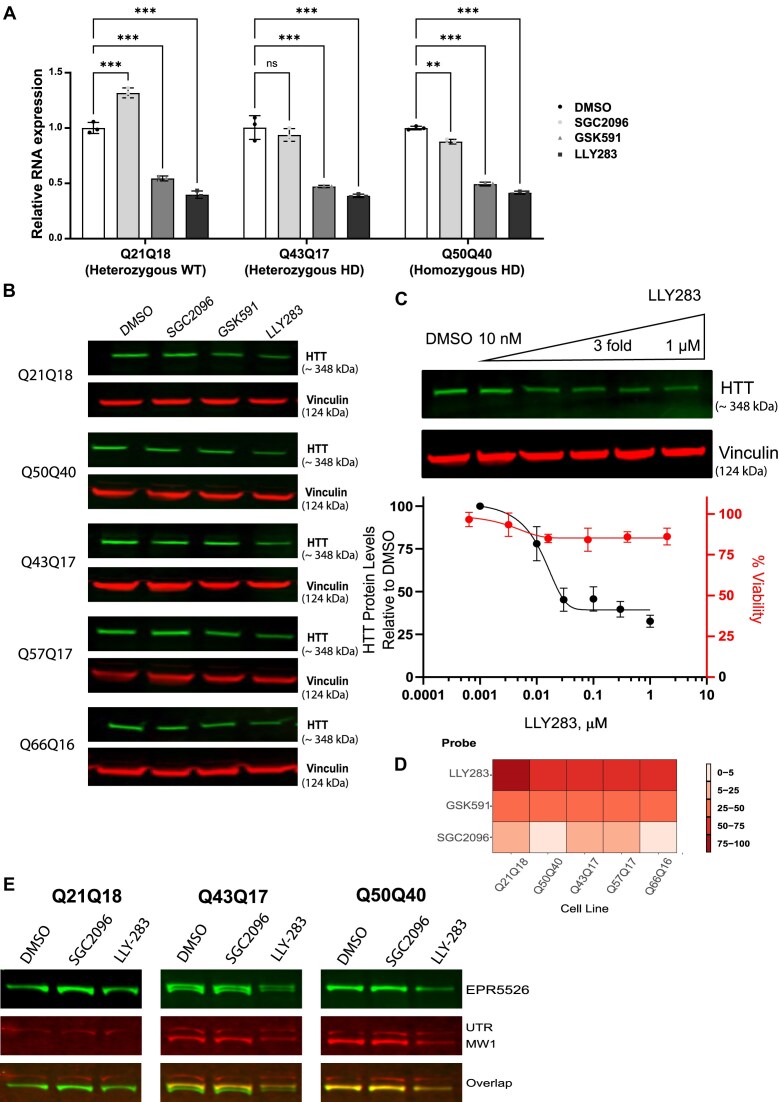
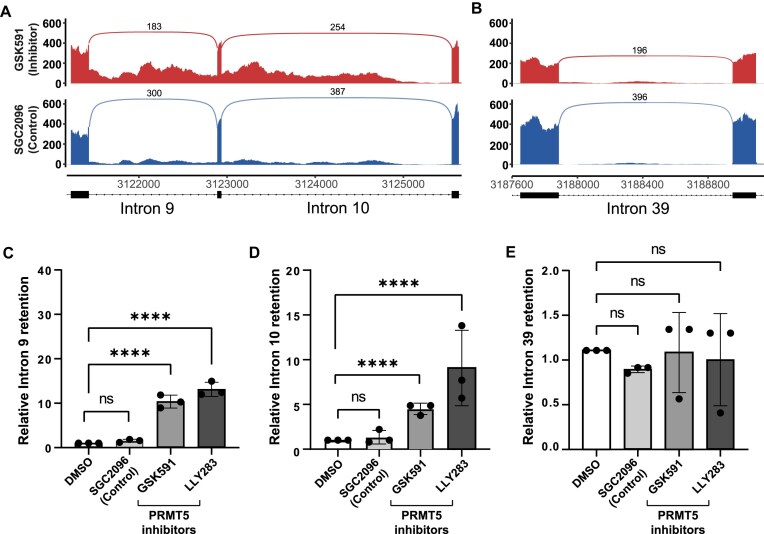
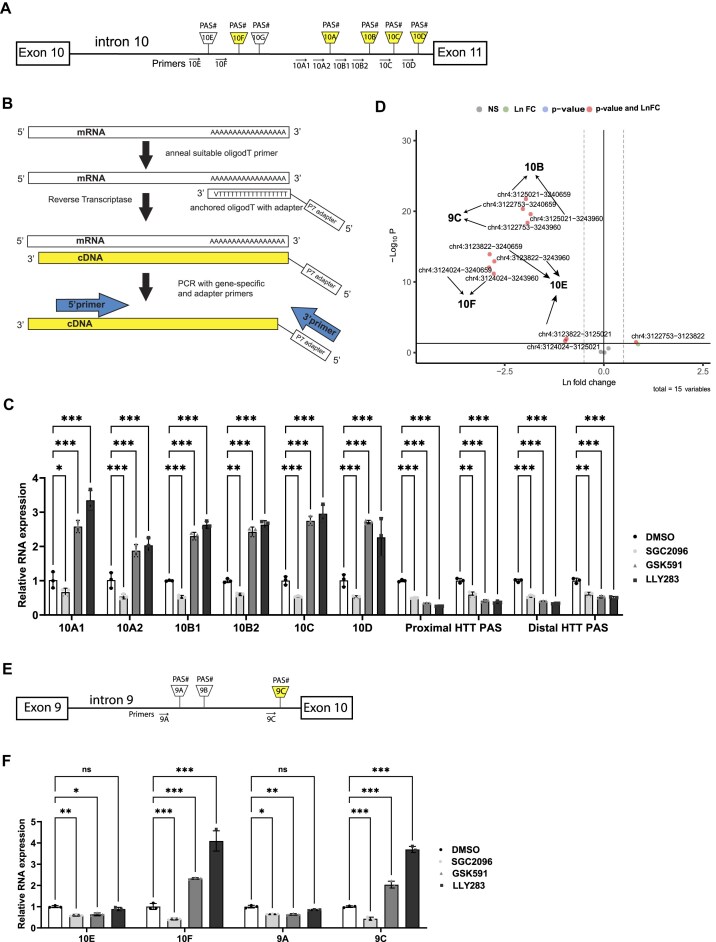
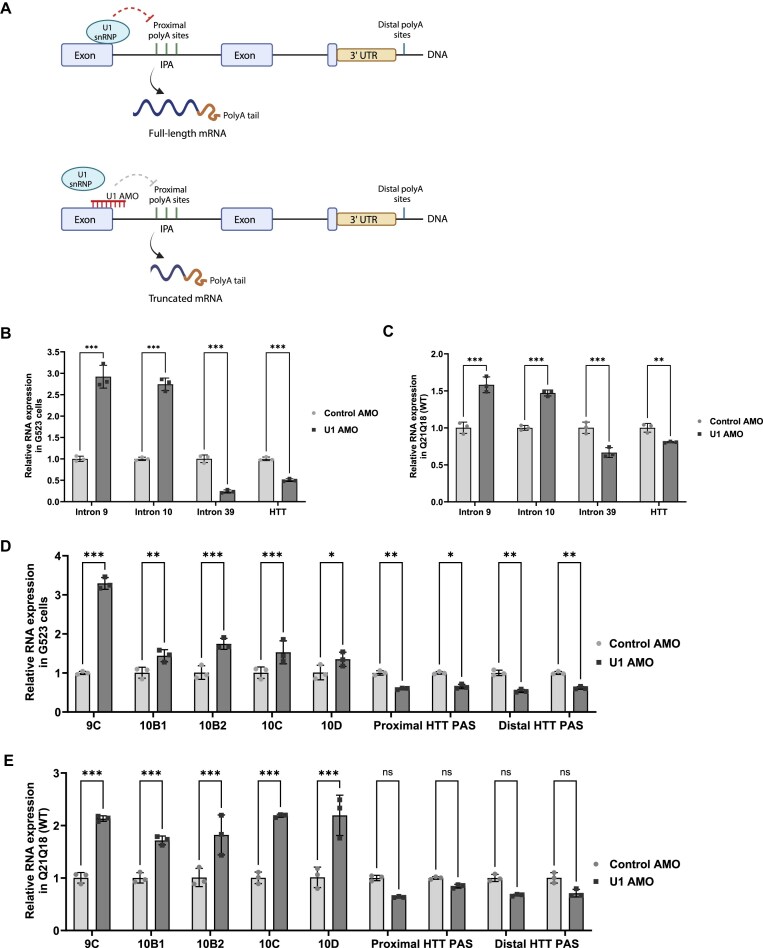
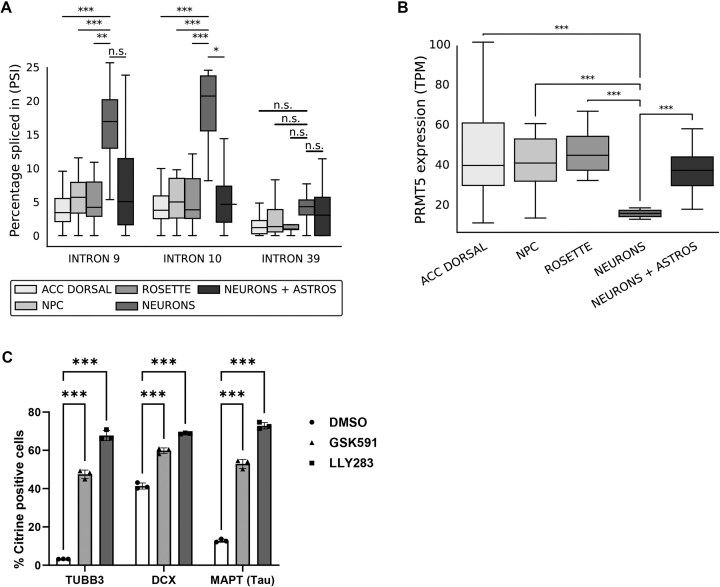
Expansion of the CAG trinucleotide repeat tract in exon 1 of the Huntingtin (HTT) gene causes Huntington's disease (HD) through the expression of a polyglutamine-expanded form of the HTT protein. This mutation triggers cellular and biochemical pathologies, leading to cognitive, motor, and psychiatric symptoms in HD patients. Targeting HTT splicing with small molecule drugs is a compelling approach to lowering HTT protein levels to treat HD, and splice modulators are currently being tested in the clinic. Here, we identify PRMT5 as a novel regulator of HTT messenger RNA (mRNA) splicing and alternative polyadenylation. PRMT5 inhibition disrupts the splicing of HTT introns 9 and 10, leading to the activation of multiple proximal intronic polyadenylation sites within these introns and promoting premature termination, cleavage, and polyadenylation of the HTT mRNA. This suggests that HTT protein levels may be lowered due to this mechanism. We also detected increasing levels of these truncated HTT transcripts across a series of neuronal differentiation samples, which correlated with lower PRMT5 expression. Notably, PRMT5 inhibition in glioblastoma stem cells potently induced neuronal differentiation. We posit that PRMT5-mediated regulation of intronic polyadenylation, premature termination, and cleavage of the HTT mRNA modulates HTT expression and plays an important role during neuronal differentiation.


Conflict of interest statement

None declared.

Figures

Graphical Abstract
Graphical Abstract
Figure 1.
Figure 1.
PRMT5 inhibitor treatment in GBM cell lines causes lowering of HTT protein and RNA. (A) Integration of RNA-sequencing and proteomics analysis following PRMT5 inhibition in three independent patient-derived GBM lines showing HTT protein and RNA levels are both reduced with PRMT5 inhibitors GSK591 and LLY283. The graph represents average fold change (log2) after PRMT5 inhibition, combining all three G561, G564, and G583 cell lines and both PRMT5 inhibitors, GSK591 and LLY-283, against SGC2096 (negative control) (n = 3). Gene density is represented by color intensity (“counts,” log10). (B) RT-qPCR analysis of patient-derived GBM cell lines treated with DMSO, 1 μM SGC2096 (negative control), 1 μM GSK591 (PRMT5 inhibitor), and 1 μM LLY-283 (PRMT5 inhibitor) for 5–7 days, n = 3–5 biological replicates of G523, G411, and G561. PRMT5 inhibitors resulted in a significant lowering of total HTT expression levels relative to DMSO-treated cells. Data are the mean ± standard error of the mean (SEM) of four independent biological replicates, each comprising four technical replicates. Statistical significance was calculated using two-way ANOVA with Dunnett’s multiple comparisons test compared to the mean of DMSO-treated cells. ns: not significant P value = .997, ****P value < .0001. (C) Representative western blots of G411 and G561 showing significant lowering of HTT protein levels upon treatment with 1 μM GSK591 or 1 μM LLY-283. The full blots are shown in Supplementary Fig. S1. (D) Western blot quantification is shown as a bar graph. HTT protein levels were normalized to vinculin and plotted relative to levels observed with DMSO control treatment. Data are the mean ± SEM of four independent biological replicates of G523, G411, and G561. Statistical significance was calculated using two-way ANOVA with Dunnett’s multiple comparisons test compared to the mean of DMSO-treated cells. ns P value = .921, ****P value < .0001.
Figure 2.
Figure 2.
PRMT5 inhibitors lower HTT in control and HD fibroblasts at both the RNA and protein level. (A) Barplot showing relative HTT mRNA expression by RT-qPCR analysis in the indicated TruHD fibroblast cell lines treated with DMSO, 1 μM SGC2096 (negative control), 1 μM GSK591 (PRMT5 inhibitor), and 1 μM LLY-283 (PRMT5 inhibitor) for 5 days. Data were analyzed using two-way ANOVA. Data are shown as mean ± standard deviation (sd); n = 3 technical replicates. ***P < .001, **P < .01, *P < .05, ns: not significant. (B) Representative western blot of HTT and vinculin showing consistent HTT lowering upon treatment with 1 μM LLY-283 in homozygous, (Q50Q40), heterozygous (Q43Q17, Q57Q17, and Q66Q16), and control (Q21Q18) fibroblasts. The uncropped western blots are shown in Supplementary Fig. S4. (C) Top panel: western blot analysis of HTT and vinculin in control and HD fibroblasts after 5 days of treatment with LLY-283 at different concentrations. See also Supplementary Fig. S4. Bottom panel: cell viability study of Q43Q17 HD fibroblasts showing no cell death within the concentration range of LLY-283 used in experiments. (D) Heatmap comparing the relative HTT protein lowering in HD (Q50Q40, Q43Q17, Q57Q17, and Q66Q16) and WT (Q21Q18) fibroblasts when treated with 1 μM PRMT5 inhibitors (LLY-283 or GSK591) or negative control (SGC2096).N = 4–8 biological replicates. (E) Representative western blot probed by antibody EPR5526 for total HTT protein levels and MW1 for mutant HTT levels in HD fibroblasts. PRMT5 inhibition lowered total HTT levels in HD fibroblasts expressing mutant HTT (Q50Q40, Q43Q17) and control fibroblasts expressing WT HTT (Q21Q18). Utrophin (UTRN) was used as a loading control. The full blots are shown in Supplementary Fig. S5.
Figure 3.
Figure 3.
Increase in specific intronic sequences in the HTT transcript after PRMT5 chemical inhibition. (A) Intron retention data in the HTT gene presented as sashimi plots [62] were extracted from bulk RNA-seq data from patient-derived GBM stem cells treated with 1 μM GSK591 or SGC2096 as described previously [17]. (B) Intron retention data for HTT intron 39 as a control. For both panels (A) and (B), x-axis represents the genomic coordinates along the chromosome and y-axis shows the normalized read count at each position. The lines with numbers connecting the individual exons represent the number of reads that map to the exon–exon junction. Bar plots showing the relative expression of (C) intron 9, (D) intron 10, and (E) intron 39 as relative fold change (y-axis) across different conditions (x-axis). Data are the mean ± SEM of three independent biological replicates, each comprising four technical replicates. Statistical significance was calculated using two-way ANOVA with Dunnett’s multiple comparisons test compared to the mean of DMSO-treated cells. P value ≥ .05 is considered insignificant. ****P value < .0001.
Figure 4.
Figure 4.
PRMT5 inhibition induces activation of APA sites in HTT introns 9 and 10. (A) Schematic of intron 10 APA sites detected in this study by visual scanning for polyA motifs and scRNA-seq data analysis. (B) Schematic of the RT-qPCR-based approach for the detection and validation of 3′ cDNA ends. (C) RT-qPCR validation of the potential APA sites using RNA from GBM cells treated with the indicated compounds. For reference, we designed two primers specific for each of the 2 canonical HTT PAS sites (indicated as proximal and distal PAS). Data were analyzed using two-way ANOVA. Data are shown as mean ± SD; n = 3 technical replicates. ***P < .001, **P < .01, *P < .05, ns: not significant. (D) Volcano plot of APA events identified in HTT gene using scRNA-seq data from GBM cells treated with LLY-283 or DMSO for all the APA pairs between proximal and distal PA sites. Fifteen pairwise APA events were observed for the HTT gene. The x-axis denotes the natural logarithm (Ln) fold change of distal to proximal PAs utilization. Hence, the negative values indicate proximal PAs usage, and positive values indicate distal PAs usage. We see significant usage of intronic PA sites located in Intron 9 (chr4: 3 122 753) and 10 (chr4: 3 125 021) of the HTT gene for the LLY-283-treated cell lines compared to the controls. (E) Schematic of potential PAS sites mapping in HTT intron 9. Yellow indicates sites that have been experimentally validated. (F.) RT-qPCR validation of HTT introns 9 and 10 (additional) PAS sites. Data were analyzed using two-way ANOVA. Data are shown as mean ± SD; n = 3 technical replicates. Asterisks indicate statistical significance based on calculated P-values. ***P < .001, **P < .01, *P < .05, ns: not significant.
Figure 5.
Figure 5.
U1 snRNP inhibition results in PCPA in HTT introns 9 and 10. (A) Schematic depicting the effect of U1 snRNP in suppressing proximal intronic polyadenylation (IPA) leading to mRNA PCPA and the effect of U1 AMO in promoting IPA and PCPA. Created with BioRender.com (https://BioRender.com/jknh0zu). RT-qPCR validation with primers specific for the indicated HTT introns in G523 GBM (B) and WT Q21Q18 fibroblast (C) cells transfected with 7.5 μM U1 AMO or control AMO for 3 days. Effect of U1 AMO on the intron 9 and 10 cryptic APA sites using RNA from G523 GBM (D) and Q21Q18 fibroblast (E) cells transfected with the U1 or control AMO. For reference, we used two primers specific for each of the two canonical HTT sites (indicated as proximal and distal PAS). Data were analyzed using two-way ANOVA. Data are shown as mean ± SD; n = 3 technical replicates. Asterisks indicate statistical significance. ***P < .001, **P < .01, *P < .05, ns: not significant.
Figure 6.
Figure 6.
Increased expression of truncated, APA HTT isoforms correlates with lower PRMT5 levels during neuronal differentiation. (A) Boxplot showing the percentage spliced-in (PSI, y-axis) values for each of the evaluated HTT introns (x-axis) across four distinct stages of neuronal development (early differentiating cells represented as ACC dorsal in white, NPC in light gray, rosettes in medium gray, neurons in gray, and a mixture of neurons plus astrocytes in dark gray). The bars indicate the statistical significance calculated when comparing neurons with other tissues using two-sample independent t-test with unequal variance, with asterisks indicating a P-value < .05 and a ΔPSI (PSIneuron − PSItarget) >10. (B) Boxplot showing the expression in transcripts per million (TPM, y-axis) for PRMT5 across the same four different cell types in distinct stages of neuronal development as in panel (A) above. The bars indicate the statistical significance calculated when comparing neurons with other tissues, with asterisks indicating a P-value < .05 and a log2FoldChange(ExpNeuron / ExpTarget) >1 or <−1. (C) PRMT5 inhibition in GBM stem cells induces neuronal differentiation. Tubulin βIII (TUBB3), Doublecortin (DCX), and MAPT (Tau)-Citrine fluorescence reporter assays in GBM stem cell line G523 showing robust induction of neuronal differentiation after treatment with either 1 μM GSK591 or 1 μM LLY-283 for 14 days. Cells were collected and processed by flow cytometry at 14 days of treatment. Data were analyzed using two-way ANOVA. Data are shown as mean ± SD; n = 3 biological replicates. Asterisks indicate statistical significance. ***P < .001, **P < .01, *P < .05, ns: not significant.

Similar articles

References

    1. Bates GP, Dorsey R, Gusella JF et al. . Huntington disease. Nat Rev Dis Primers. 2015; 1:15005.10.1038/nrdp.2015.5. - DOI - PubMed
    1. Shaw E, Mayer M, Ekwaru P et al. . Epidemiology and economic burden of Huntington’s disease: a Canadian provincial public health system perspective. J Med Econ. 2022; 25:212–9.10.1080/13696998.2022.2033493. - DOI - PubMed
    1. Coppen EM, van der Grond J, Roos RAC Atrophy of the putamen at time of clinical motor onset in Huntington’s disease: a 6-year follow-up study. J Clin Mov Disord. 2018; 5:2.10.1186/s40734-018-0069-3. - DOI - PMC - PubMed
    1. Neueder A, Landles C, Ghosh R et al. . The pathogenic exon 1 HTT protein is produced by incomplete splicing in Huntington’s disease patients. Sci Rep. 2017; 7:4408–10.10.1038/s41598-017-01510-z. - DOI - PMC - PubMed
    1. Schultz JL, Neema M, Nopoulos PC Unravelling the role of huntingtin: from neurodevelopment to neurodegeneration. Brain. 2023; 146:4408–10.10.1093/brain/awad353. - DOI - PMC - PubMed

MeSH terms

LinkOut - more resources