Deciphering the Role of Putative Novel miRNAs Encoded From the Newly Found Genomic Regions of T2T-CHM13 in the Progression of Collecting Duct Renal Cell Carcinoma
- PMID: 40304310
- PMCID: PMC12042112
- DOI: 10.1002/cam4.70925
Deciphering the Role of Putative Novel miRNAs Encoded From the Newly Found Genomic Regions of T2T-CHM13 in the Progression of Collecting Duct Renal Cell Carcinoma
Abstract
Background: Collecting duct renal cell carcinoma (cdRCC) is a rare and aggressive renal cancer subtype. The molecular mechanisms underlying cdRCC remain poorly understood, which presents a significant challenge for the development of effective treatment strategies. Advances in genome sequencing, particularly the discovery of new genomic regions in the T2T-CHM13 reference genome, have provided an opportunity to expand our understanding of this disease.
Aims: Our study specifically aims to investigate the role of miRNAs encoded by these regions, proposing them as potential epigenetic regulators in the pathogenesis of cdRCC.
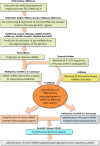
Methods: We used bioinformatic pipelines and small RNA-seq data analysis to predict novel miRNAs from the newly discovered genomic regions of T2T-CHM13. RNA-seq analysis of cdRCC tumors was performed to identify differentially expressed genes, and target prediction tools were used to find miRNA-mRNA interactions. Functional enrichment analyses were conducted to characterize the biological pathways affected.
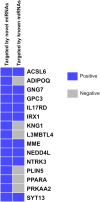
Results and discussion: Using computational approaches, we predicted 156 novel miRNAs from T2T-CHM13's newly resolved sequences. RNA-seq and miRNA-mRNA interaction analyses identified 345 downregulated genes targeted by novel miRNAs and 395 downregulated genes targeted by known miRNAs. A comprehensive functional enrichment analysis of these perturbed genes revealed distinctive pathways, including cGMP-PKG signaling, calcium signaling, adipocytokine signaling, PPAR signaling, and apelin signaling, all of which are implicated in tumorigenesis. Furthermore, Gene Ontology analysis linked miRNA-targeted genes to disrupted cell-cell junctions and adhesion, providing a mechanistic explanation for aggressive invasion and metastasis in cdRCC. Additionally, a significant number of the target genes involved in metabolic and ion transport pathways were perturbed, explaining metabolic alterations in the cancer cells. We also identified 15 tumor suppressor genes downregulated by novel miRNAs, 6 of which were uniquely targeted, highlighting the potential of these miRNAs as cdRCC-specific biomarkers.
Conclusion: In conclusion, our study offers valuable insights into cdRCC biology from an epigenetic perspective, laying the groundwork for future research aimed at developing targeted therapies.
Keywords: T2T‐CHM13; cancer; carcinoma; collecting duct; epigenetic modulator; miRNA; novel; tumor‐suppressor.
© 2025 The Author(s). Cancer Medicine published by John Wiley & Sons Ltd.
Conflict of interest statement
The authors declare no conflicts of interest.
Figures


Similar articles
-
Biomarker identification in clear cell renal cell carcinoma based on miRNA-seq and digital gene expression-seq data.Gene. 2018 Mar 20;647:205-212. doi: 10.1016/j.gene.2017.12.031. Epub 2017 Dec 15. Gene. 2018. PMID: 29253611
-
Identification of genes and pathways involved in kidney renal clear cell carcinoma.BMC Bioinformatics. 2014;15 Suppl 17(Suppl 17):S2. doi: 10.1186/1471-2105-15-S17-S2. Epub 2014 Dec 16. BMC Bioinformatics. 2014. PMID: 25559354 Free PMC article.
-
New mechanistic insights of clear cell renal cell carcinoma from integrated miRNA and mRNA expression profiling studies.Biomed Pharmacother. 2019 Mar;111:821-834. doi: 10.1016/j.biopha.2018.12.099. Epub 2019 Jan 4. Biomed Pharmacother. 2019. PMID: 30616081
-
The role of natural products versus miRNA in renal cell carcinoma: implications for disease mechanisms and diagnostic markers.Naunyn Schmiedebergs Arch Pharmacol. 2024 Sep;397(9):6417-6437. doi: 10.1007/s00210-024-03121-8. Epub 2024 May 1. Naunyn Schmiedebergs Arch Pharmacol. 2024. PMID: 38691151 Review.
-
MicroRNAs Associated with Von Hippel-Lindau Pathway in Renal Cell Carcinoma: A Comprehensive Review.Int J Mol Sci. 2017 Nov 22;18(11):2495. doi: 10.3390/ijms18112495. Int J Mol Sci. 2017. PMID: 29165391 Free PMC article. Review.
References
-
- Seo A. N., Yoon G., and Ro J. Y., “Clinicopathologic and Molecular Pathology of Collecting Duct Carcinoma and Related Renal Cell Carcinomas,” Advances in Anatomic Pathology 24 (2017): 65–77. - PubMed
-
- Chen J., Cai D., Gong K., and Zhu S., “Collecting Duct Carcinoma of the Kidney: Analysis of 74 Cases From Multiple Centers,” Urology 164 (2022): 163–168. - PubMed
MeSH terms
Substances
LinkOut - more resources
Full Text Sources
Medical

