. 2025 Jun 3;13(6):e0019225.
doi: 10.1128/spectrum.00192-25. Epub 2025 Apr 30.

Microbial and metabolic profiles associated with HPV infection and cervical intraepithelial neoplasia: a multi-omics study

Affiliations

Microbial and metabolic profiles associated with HPV infection and cervical intraepithelial neoplasia: a multi-omics study

Xiaowen Pu et al. Microbiol Spectr. .

Abstract

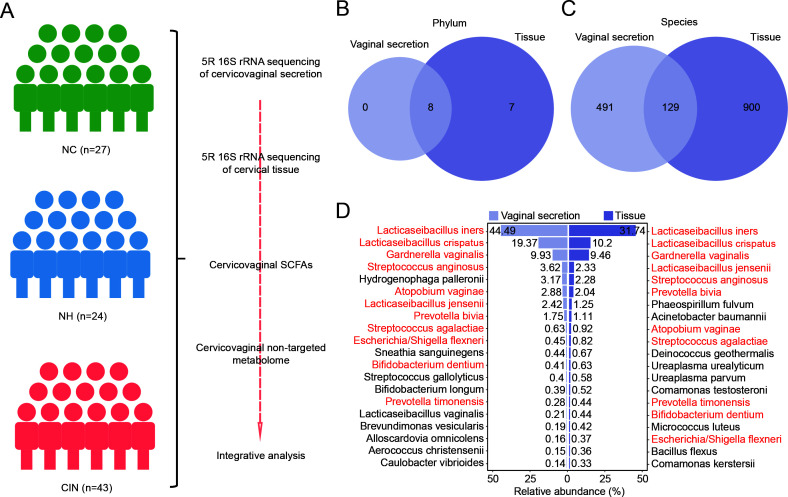
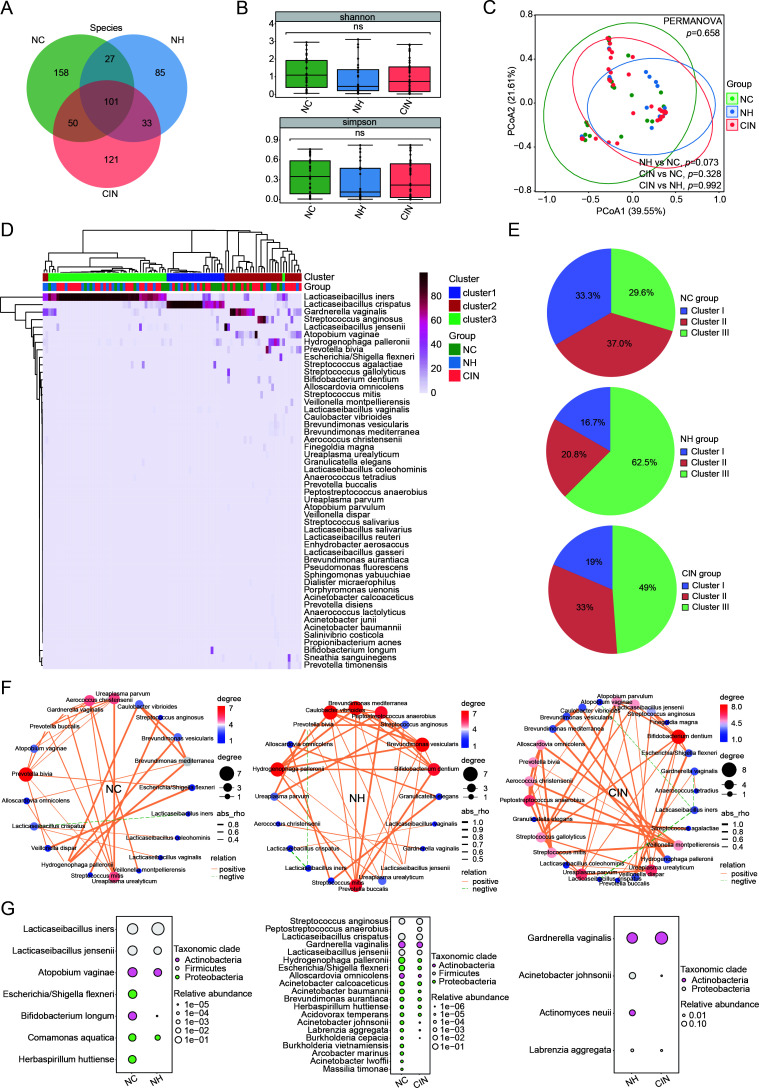
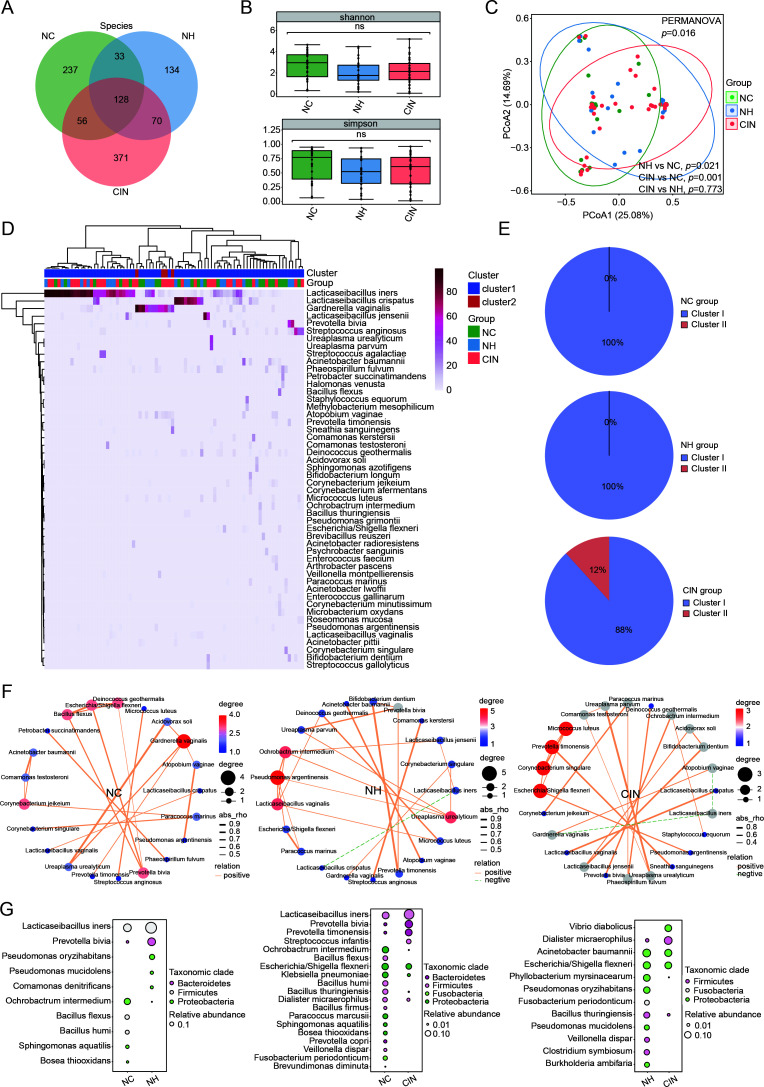
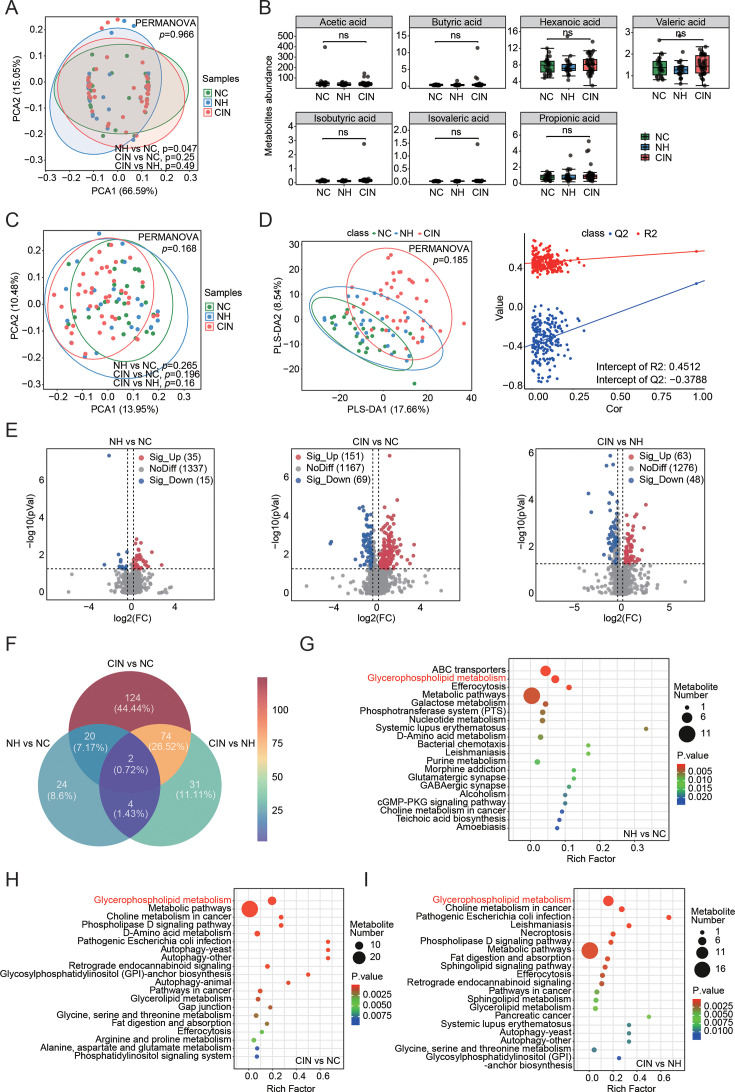
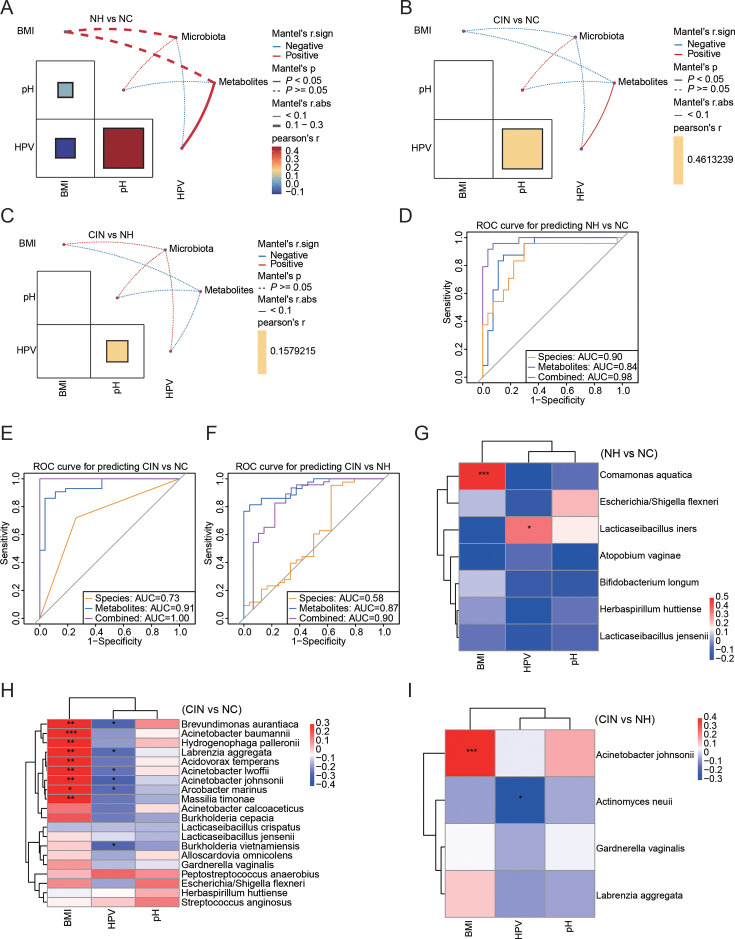
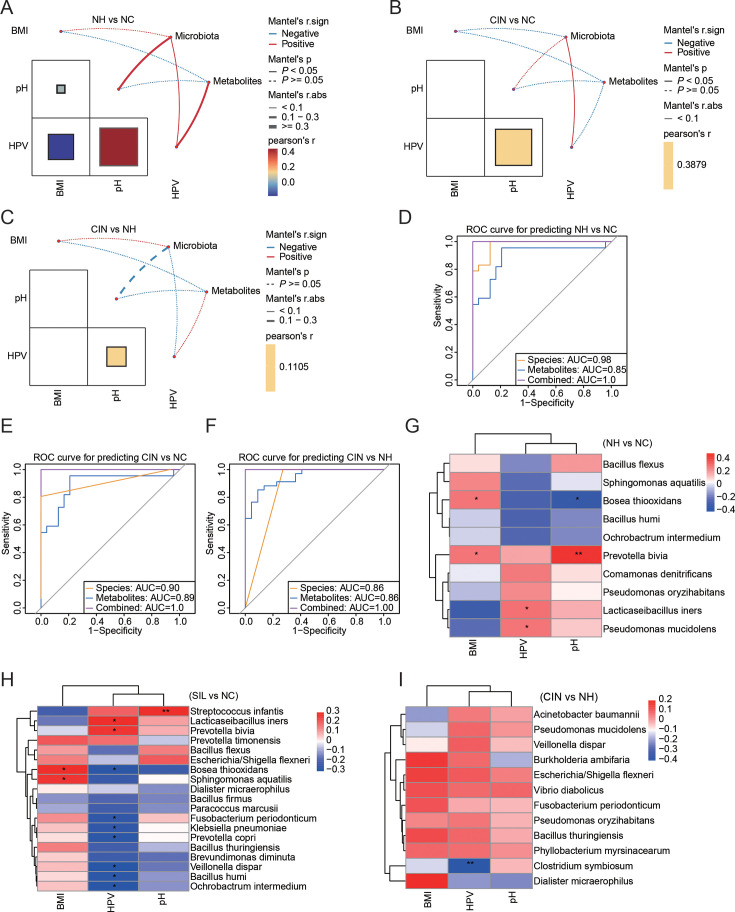
Cervical cancer is the most common malignancy of the female reproductive system, with the incidence of human papillomavirus (HPV) being a crucial factor in its pathogenesis. Emerging evidence indicates that cervicovaginal microbiota may influence HPV persistence and cervical intraepithelial neoplasia (CIN). However, the interplay between cervicovaginal and cervical tissue microbiomes and their association with HPV infection and CIN remains poorly understood. In this cross-sectional study, we analyzed the microbiota profiles of cervicovaginal and cervical tissue via five-region 16S rRNA gene metabarcoding, along with cervicovaginal metabolites, including short-chain fatty acids (SCFAs) and non-targeted metabolomic data, from 94 women. Key species, particularly Lacticaseibacillus and various anaerobes, are vital components of the microbiota found in both cervicovaginal secretions and cervical tissue, despite notable differences in microbial composition. The CIN group exhibited significant differences in microbial diversity and composition compared to the control groups, with key species such as Lacticaseibacillus iners and Prevotella bivia associated with HPV status and CIN progression. Metabolomic analysis revealed alterations in glycerophospholipid metabolism, but not in SCFAs, with correlations observed between metabolites and HPV status. Notable associations, including P. bivia-PE(18:1/0:0)-HPV and Fusobacterium periodonticum-PI(40:6)-HPV, were identified. Our findings emphasize the critical roles of cervicovaginal and cervical tissue microbiomes in HPV infection and CIN development, highlighting specific microbial species and metabolic pathways for early detection and therapeutic targets.

Importance: Cervical cancer is the most prevalent malignancy in the female reproductive system, with human papillomavirus (HPV) persistency being a critical factor in its pathogenesis. This study highlights the significant yet often overlooked role of cervicovaginal secretion and cervical tissue microbiota in influencing HPV infection and the progression of cervical intraepithelial neoplasia (CIN). By employing a multi-omics approach, we elucidated distinct microbiota profiles in cervical tissues compared to cervicovaginal secretions, revealing a complex interplay between specific bacterial species (notably Lacticaseibacillus and anaerobes) and metabolomic changes associated with glycerophospholipid metabolism. Our findings address a significant gap in understanding the interplay between cervicovaginal secretion and cervical intratissue microbiomes, HPV infection, and CIN.

Keywords: HPV; cervical intraepithelial neoplasia; metabolome; microbiome.


Conflict of interest statement

The authors declare no conflict of interest.

Figures

Fig 1
Fig 1
Comparative analysis of the 5R 16S rRNA gene sequencing from cervicovaginal secretion and cervical tissue samples. (A) Workflow of the study. Participants underwent 5R 16S rRNA gene sequencing for cervicovaginal secretion and cervical tissue, alongside non-targeted and targeted metabolomic analyses of SCFAs. Data integration was performed for microbiome and metabolome insights. (B–C) Venn diagrams depicting shared and unique microbiota distribution at the phylum (B) and species (C) levels. (D) The butterfly diagram illustrates the top 20 bacterial species identified in cervicovaginal secretion and cervical tissue, emphasizing shared species in red.
Fig 2
Fig 2
Bacterial diversity and composition analysis of cervicovaginal secretion. (A) Venn diagrams comparing bacterial species across NC, NH, and CIN groups. (B) Alpha diversity assessed via Shannon (top) and Simpson (bottom) indices. Mann-Whitney U-test was used for P-value calculations (between pairs). (C) PCoA of beta diversity based on Bray-Curtis distances with significance assessed through PERMANOVA (three groups) and Mann-Whitney U-test (two groups). (D) Heatmap of the 50 most abundant bacterial species across 94 samples. (E) Visualization of bacterial clusters within analyzed groups. (F) Pearson’s correlation analysis of the top 30 bacterial species across groups, displaying only correlations with |rho| > 0.2 and P < 0.05. Node size indicates species abundance; line colors reflect positive (orange) and negative (green) correlations. (G) Bubble diagrams show differentially abundant bacterial species identified via Mann-Whitney U-test (P < 0.05) among group comparisons.
Fig 3
Fig 3
Bacterial diversity and structure analysis of cervical tissue. (A) Venn diagrams comparing bacterial species in NC, NH, and CIN women. (B) Alpha diversity assessed via Shannon (top) and Simpson (bottom) indices. Mann-Whitney U-test was used for P-value calculations (between pairs). (C) PCoA of beta diversity based on Bray-Curtis distances with significance assessed through PERMANOVA (three groups) and Mann-Whitney U-test (two groups). (D) Heatmap representation of the top 50 bacterial species across 80 cervical tissue samples. (E) Cluster visualization for specified groups. (F) Pearson’s correlation analysis of the top 30 bacterial species across groups, displaying only correlations with |rho| > 0.2 and P < 0.05. Node size indicates species abundance; line colors reflect positive (orange) and negative (green) correlations. (G) Bubble diagrams illustrate DABs identified via Mann-Whitney U-test.
Fig 4
Fig 4
Metabolic profiling of the cervicovaginal metabolome. (A) PCA plots showing Bray-Curtis distances for NC, NH, and CIN concerning SCFAs, with P-values derived from PERMANOVA for three groups and Mann-Whitney U-test for pairwise group comparisons. (B) Box plots depicting SCFA levels among NC, NH, and CIN participants. (C) PCA plots utilizing Bray-Curtis distances for NC, NH, and CIN relate to non-targeted metabolomics, with statistical significance assessed through the PERMANOVA test for three groups and the Mann-Whitney U-test for pairwise group comparisons. (D) PLS-DA comparison among NC, NH, and CIN, validated with a 200-time permutation test. (E) Volcano plots signify metabolic alterations; red dots represent upregulated metabolites, blue for downregulated. Significant metabolites are determined by VIP score (VIP >1, P < 0.05, |fold change (FC)| > 1.2). (F) Venn diagram illustrating unique and shared differential metabolites across groups. (G–I) Bubble charts detail the top 20 enriched KEGG pathways linked to differential metabolites in each comparison group.
Fig 5
Fig 5
Correlation analysis between altered metabolites, cervicovaginal bacteria, and clinical indices. (A–C) Correlation assessments of clinical indices (BMI, pH, HPV status) against altered metabolites and cervicovaginal DABs. (D–F) ROC curves featuring DABs and metabolites as discriminatory signatures across groups. (G–I) Pearson’s correlation analysis between DABs and clinical indices per group. Significant values are noted as *P < 0.05, **P < 0.01, ***P < 0.001.
Fig 6
Fig 6
Correlation analysis of altered metabolites, cervical tissue bacteria, and clinical indices. (A–C) Correlation assessments of clinical indices (BMI, pH, HPV status) against altered metabolites and cervical tissue DABs. (D–F) ROC curves featuring DABs and metabolites as discriminatory signatures across groups. (G–I) Pearson’s correlation analysis between DABs and clinical indices per group. Significant values are noted as *P < 0.05, **P < 0.01, ***P < 0.001.

Similar articles

References

    1. Mattiuzzi C, Lippi G. 2020. Cancer statistics: a comparison between World Health Organization (WHO) and Global Burden of Disease (GBD). Eur J Public Health 30:1026–1027. doi:10.1093/eurpub/ckz216 - DOI - PubMed
    1. Han B, Zheng R, Zeng H, Wang S, Sun K, Chen R, Li L, Wei W, He J. 2024. Cancer incidence and mortality in China, 2022. J Natl Cancer Cent 4:47–53. doi:10.1016/j.jncc.2024.01.006 - DOI - PMC - PubMed
    1. Perkins RB, Wentzensen N, Guido RS, Schiffman M. 2023. Cervical cancer screening: a review. JAMA 330:547–558. doi:10.1001/jama.2023.13174 - DOI - PubMed
    1. Zhang Y, Wu X, Li D, Huang R, Deng X, Li M, Du F, Zhao Y, Shen J, Chen Y, Zhang P, Hu C, Xiao Z, Wen Q. 2024. HPV-associated cervicovaginal microbiome and host metabolome characteristics. BMC Microbiol 24. doi:10.1186/s12866-024-03244-1 - DOI - PMC - PubMed
    1. Xu H, Liu L, Xu F, Liu M, Song Y, Chen J, Zhan H, Zhang Y, Xu D, Chen Y, Lu M, Chen D. 2022. Microbiome-metabolome analysis reveals cervical lesion alterations. Acta Biochim Biophys Sin (Shanghai) 54:1552–1560. doi:10.3724/abbs.2022149 - DOI - PMC - PubMed

MeSH terms