

Ultra-high resolution imaging of laminar thickness in face-selective cortex in autism
- PMID: 40304890
- PMCID: PMC12356732
- DOI: 10.3758/s13415-025-01298-w
Ultra-high resolution imaging of laminar thickness in face-selective cortex in autism
Abstract
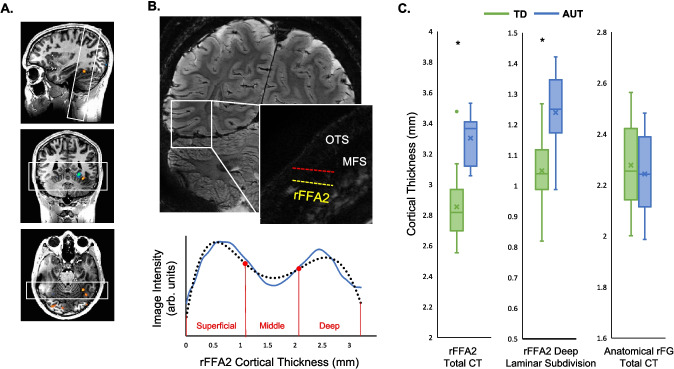
Gray matter cortical thickness (CT) is related to perceptual abilities. The fusiform face area (FFA) (Kanwisher et al., The Journal of Neuroscience: The Official Journal of the Society for Neuroscience, 17, 4302-4311, 1997) in the inferior temporal lobe is defined by its face selectivity, and the CT of the FFA correlates with the ability to make difficult visual decisions (Bi et al., Current Biology, 24, 222-227, 2014; McGugin et al., Journal of Cognitive Neuroscience, 28, 282-294, 2016, Journal of Cognitive Neuroscience, 32, 1316-1329, 2020). In McGugin et al. Journal of Cognitive Neuroscience, 32, 1316-1329, (2020), individuals with better face recognition had relatively thinner FFAs, whereas those with better car recognition had thicker FFAs. This opposite correlation effect (OCE) for faces and cars was pronounced when we look selectively at the deepest laminar subdivision of the FFA. The OCE is thought to arise because car and face recognition abilities are fine-tuned by experience during different developmental periods. Given autism's impact on face recognition development, we predicted the OCE would not appear in autistic individuals. Our results replicate the OCE in total FFA thickness and in deep layers in neurotypical adults. Importantly, we find a significant reduction of these effects in adults with autism. This supports the idea that the OCE observed in neurotypical adults has a developmental basis. The abnormal OCE in autism is specific to the right FFA, suggesting that group differences depend on local specialization of the FFA, which did not occur in autistic individuals.
Keywords: Autism; Face recognition; Individual differences; MRI.
© 2025. The Author(s).
Conflict of interest statement
Declarations. Competing interests: The authors have no competing interests to declare that are relevant to the contents of this article. Ethics approval: Approval was obtained from the Vanderbilt University IRB under ID #150182. Consent to participate: Informed consent was obtained by all individual participants. Consent for publication: Not applicable.
Figures


Similar articles
-
The Lived Experience of Autistic Adults in Employment: A Systematic Search and Synthesis.Autism Adulthood. 2024 Dec 2;6(4):495-509. doi: 10.1089/aut.2022.0114. eCollection 2024 Dec. Autism Adulthood. 2024. PMID: 40018061 Review.
-
The Effect of Labeling During Simulated Contact on Attitudes Toward Autistic Adults.Autism Adulthood. 2025 Feb 5;7(1):93-99. doi: 10.1089/aut.2023.0081. eCollection 2025 Feb. Autism Adulthood. 2025. PMID: 40151654
-
Differently different?: A commentary on the emerging social cognitive neuroscience of female autism.Biol Sex Differ. 2024 Jun 13;15(1):49. doi: 10.1186/s13293-024-00621-3. Biol Sex Differ. 2024. PMID: 38872228 Free PMC article. Review.
-
"I Wish This Tool Was Available to Me Sooner": Piloting a Workplace Autism Disclosure Decision-Aid Tool for Autistic Youth and Young Adults.Autism Adulthood. 2024 Sep 16;6(3):331-344. doi: 10.1089/aut.2023.0054. eCollection 2024 Sep. Autism Adulthood. 2024. PMID: 39371357
-
Adapting Safety Plans for Autistic Adults with Involvement from the Autism Community.Autism Adulthood. 2025 May 28;7(3):293-302. doi: 10.1089/aut.2023.0124. eCollection 2025 Jun. Autism Adulthood. 2025. PMID: 40539213
References
-
- Achenbach & Rescorla. (2010). Manual for the ASEBA School Age Forms and Profiles. Research Center for Children, Youth, and Families. University of Vermont.
-
- Baranek, G. T., Woynaroski, T. G., Nowell, S., Turner-Brown, L., DuBay, M., Crais, E. R., & Watson, L. R. (2017). Cascading effects of attention disengagement and sensory seeking on social symptoms in a community sample of infants at-risk for a future diagnosis of autism spectrum disorder. Developmental Cognitive Neuroscience,29, 30–40. 10.1016/j.dcn.2017.08.006 - PMC - PubMed
MeSH terms
Grants and funding
- 5UL1TR002243-03/Vanderbilt Institute for Clinical and Translational Research, Vanderbilt University Medical Center
- Hobbs/Vanderbilt Kennedy Center, Vanderbilt University Medical Center
- 1840896/Division of Behavioral and Cognitive Sciences
- S10 OD030389/OD/NIH HHS/United States
- UL1 TR002243/TR/NCATS NIH HHS/United States
LinkOut - more resources
Full Text Sources
