. 2025 May 27;44(5):115603.
doi: 10.1016/j.celrep.2025.115603. Epub 2025 Apr 29.

Functional characterization of the ATOH1 molecular subtype indicates a pro-metastatic role in small cell lung cancer

Affiliations

Functional characterization of the ATOH1 molecular subtype indicates a pro-metastatic role in small cell lung cancer

Alessia Catozzi et al. Cell Rep. .

Abstract

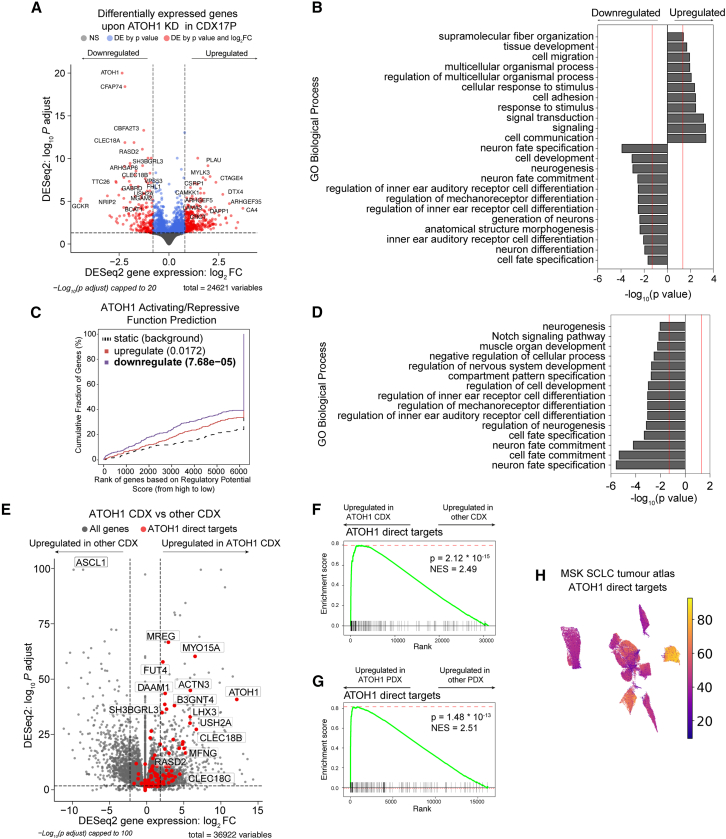
Molecular subtypes of small cell lung cancer (SCLC) have been described based on differential expression of the transcription factors (TFs) ASCL1, NEUROD1, and POU2F3 and immune-related genes. We previously reported an additional subtype based on expression of the neurogenic TF ATOH1 within our SCLC circulating tumor cell-derived explant (CDX) model biobank. Here, we show that ATOH1 protein is detected in 7 of 81 preclinical models and 16 of 102 clinical samples of SCLC. In CDX models, ATOH1 directly regulates neurogenesis and differentiation programs, consistent with roles in normal tissues. In ex vivo cultures of ATOH1+ CDXs, ATOH1 is required for cell survival. In vivo, ATOH1 depletion slows tumor growth and suppresses liver metastasis. Our data validate ATOH1 as a bona fide lineage-defining TF of SCLC with cell survival and pro-metastatic functions. Further investigation exploring ATOH1-driven vulnerabilities for targeted treatment with predictive biomarkers is warranted.

Keywords: ATOH1; CDX; CP: Cancer; CTC-derived explant models; SCLC; SCLC molecular subtype; metastasis; small cell lung cancer.


Conflict of interest statement

Declaration of interests F.B. declares advisory board honoraria, speaker fees, and research funding from Amgen. C.D. declares research funding/educational research grants from AstraZeneca, Astex Pharmaceuticals, Biomodal, Bioven, Amgen, Carrick Therapeutics, Merck AG, Taiho Oncology, GSK, Bayer, Boehringer Ingelheim, Roche, BMS, Novartis, Celgene, Epigene Therapeutics Inc, Angle PLC, Menarini, Clearbridge Biomedics, Thermo Fisher Scientific, and Neomed Therapeutics; consultancy and/or advisory board honoraria from Biocartis, Merck, AstraZeneca, GRAIL, Boehringer Ingelheim, and VHIO; and personal remuneration from IFOM. C.M.R. has consulted for Amgen, AstraZeneca, Daiichi Sankyo, Hoffman-La Roche, and Jazz; serves on the scientific advisory boards of Auron, DISCO, and Earli and received royalty payments for DLL3-directed therapeutics licensing. J.M.C. consulted for Sonata Therapeutics.

Figures

None
Graphical abstract
Figure 1
Figure 1
ATOH1 is expressed in a transcriptionally distinct subset of SCLC CDXs, PDXs, and established cell lines (A) Heatmap illustrating expression levels of ASCL1, NEUROD1, ATOH1, and POU2F3 in the SCLC CDX biobank, annotated by SCLC subtype and NE score., Gene expression is shown as log2(transcripts per million [TPM]+1). (B) Unbiased principal-component analysis (PCA) of SCLC CDX annotated by SCLC molecular subtypes. Blue, ASCL1; pink, NEUROD1; yellow, ATOH1; green, POU2F3. (C) Representative IHC images for ATOH1, ASCL1, NEUROD1, and POU2F3 in CDX models of different SCLC molecular subtypes. Scale bars: 50 μm. (D) Quantification of ATOH1 expression in 2 CDX tumors in a panel of CDX models. Open circles show expression levels for individual biological replicates, mean value is shown with error bars representing +/-SD. (E and F) Violin plot representing expression of the indicated NE and non-NE TFs in SCLC established cell lines (E) and the SCLC CDX and PDX biobank (F); ATOH1-expressing HCC33 and CORL24 (E) and LX424 and LX443 (F) are highlighted in red. Gene expression is reported as log2(TPM+1). Insets: representative images of ATOH1 and NEUROD1 IHC staining for HCC33 (E) and LX424, LX443 (F). (G) Boxplot of MYCL copy number (CN), reported as CN ratio (log2(CN/2)) in CDXs grouped by molecular subtype (ATOH1 or other). Each dot represents a CDX, mean is illustrated in the box plot; statistics are reported as per Wilcoxon rank-sum exact test. (H) Quantification of MYCL expression by IHC in 2 CDX tumors in a panel of CDX models belonging to different SCLC molecular subtypes (annotated below). Open circles show expression level for individual biological replicates, mean value is shown with error bars represting +/- S.D. (I) Chemosensitivity scores of the SCLC CDX biobank according to pRECIST criteria, colored by SCLC molecular subtypes. Yellow, ATOH1; blue, ASCL1; pink, NEUROD1. Data are reported after 1 cycle of cisplatin/etoposide treatment and as average of 3 mice for 29 CDXs (STAR Methods). Statistical analysis was performed with a Fisher’s exact test between ATOH1 CDXs and the remaining CDXs; p = 0.0049.
Figure 2
Figure 2
ATOH1 protein is expressed in SCLC clinical samples (A) Uniform manifold approximation and projection (UMAP) plots of single-cell RNA-seq (scRNA-seq) from SCLC biopsies from the publicly available Memorial Sloan Kettering (MSK) SCLC Atlas, reporting expression of ATOH1 (left) and NEUROD1 (right). Gene expression is reported in units of log2(X + 1), where X = normalized counts. (B) Representative IHC images for ATOH1, ASCL1, and NEUROD1 in SCLC tissue biopsies presenting with single, dual, or triple positivity (annotated). Scale bars: 50 uM. (C) Pie chart illustrating the prevalence of ATOH1+ (>5% positive tumor cells) clinical specimens (n = 16/102). (D) Venn diagram illustrating overlap of ASCL1, ATOH1, and NEUROD1 expression in 102 clinical specimens as detected by IHC. Positivity was determined as >1.5% positive tumor cells for ASCL1 and NEUROD1; positivity for ATOH1 was determined as in (C).
Figure 3
Figure 3
High-confidence ATOH1 binding sites are located at promoter and distal regulatory regions and are enriched for E box motifs (A) Schematic of the DOX-inducible knockdown (KD) system: without DOX, EGFP and shRNAs targeting ATOH1 (ShATOH1) or Renilla luciferase (ShRen) are not expressed; upon induction with DOX, both EGFP and ShATOH1 or ShRen are expressed. (B) Nuclear fractionation validating ATOH1 KD with the in-house ATOH1 antibody SY0287 in CDX17P ShRen, ShATOH1#1, and ShATOH1#3 upon treatment with DOX for 7 days. (C) Western blot showing ATOH1 expression (detected with the Ptech antibody) in the samples processed for ChIP-seq. (D) Heatmap of ChIP-seq signal for consensus peak sets SY0287 in ATOH1-competent (gray) and -depleted (red) CDX17P, generated with the generateEnrichedHeatmap function within profileplyr v.1.8.1. (E) ATOH1 binding peaks at the ATOH1 locus, highlighting ATOH1 binding peaks at the ATOH1 downstream enhancer (light green), which are lost upon ATOH1 depletion. Dark green, ChIP-seq tracks for H3K4me3 at the ATOH1 locus. Peaks were visualized with the Integrated Genomics Viewer genome browser. (F) Volcano plot of ATOH1 differentially bound regions (by false discovery rate [FDR] < 0.05) in ATOH1-competent vs. ATOH1-depleted CDX17P. Significant peaks are highlighted in pink (17,738). (G) Relative frequency of ATOH1 differentially bound peaks in regulatory genetic regions. (H) Motif enrichment analysis of ATOH1 differentially bound peaks with MEME ChIP. The mouse Atoh1 E box-associated motif (AtEAM50) is reported for comparison with the Atoh1 DNA binding motif and basic-helix-loop-helix (bHLH) motif. (I) Centrimo analysis of the location of enriched motifs in ATOH1 differentially bound peaks.
Figure 4
Figure 4
Identification of the ATOH1 targetome and gene signature (A) Volcano plot illustrating differentially expressed (DE) genes upon ATOH1 depletion (DOX treatment for 6 days) in CDX17P. Gray, not significant; blue, significant by p value; red, significant by p < 0.01 and log2(fold change) > 0.8 or < −0.8. Dotted lines represent thresholds for determining significant gene expression changes (p < 0.01 and log2(fold change) > 0.8 or < −0.8). The most significant DE genes are labeled. (B) Bar plot illustrating the top 20 biological processes up- and downregulated upon ATOH1 KD in CDX17P. Analysis was performed with gProfiler2. (C) Prediction of ATOH1 transcriptional function after integration of ChIP-seq and RNA-seq with BETA. ATOH1 KD results in downregulation of genes with ATOH1 binding sites identified in ChIP-seq (p = 7.68 × 10⁻⁵) and with predicted function in promoting transcription. (D) Bar plot illustrating biological processes (performed with gProfiler2) associated with ATOH1 target genes identified in (C). (E) Volcano plot illustrating genes enriched in 4 ATOH1 CDXs compared to the whole CDX biobank (n = 35). The ATOH1 gene signature (i.e., ATOH1 target genes) is highlighted in red. Dotted lines represent thresholds for determining significant gene expression changes (p < 0.01 and log2(fold change) > 2 or < −2). (F) Gene set enrichment analysis (GSEA) for ATOH1 direct targets in 4 ATOH1 CDXs vs. the rest of the biobank (n = 35). NES, normalized enrichment score. (G) GSEA for ATOH1 direct targets in 2 ATOH1 PDXs vs. the rest of the MSK PDX biobank (n = 40) (p = 1.48 × 10⁻¹³). GSEA was performed with Fgsea. (H) UMAP of cumulative expression of ATOH1 direct targets in scRNA-seq of SCLC tumor biopsies. ATOH1 target gene expression is highest in the only ATOH1-expressing tumor (identified in Figure 2A).
Figure 5
Figure 5
ATOH1 is necessary for SCLC cell survival in vitro (A) Schematic of ATOH1 KD induction. ATOH1 KD was established after 7 days of induction with 1 μg/mL doxycycline (DOX). Cells were cultured for 14 days with DOX (red line, +) or without DOX as controls; after the initial 7 days of DOX induction, an aliquot of cells was plated without DOX to restore ATOH1 expression (blue line, W). Untreated parental cells served as additional control (black line, -). (B) Western blot validation of ATOH1 depletion and restoration in the conditions specified in (A). ShRen was treated with DOX for 14 days, and untreated ShRen, ShATOH1#1, and ShATOH1#3 were used as controls. Statistics are reported as two-tailed unpaired t tests across the indicated conditions. (C) Relative cell viability measured with CellTiter-Glo (Promega) upon ATOH1 KD (red) and restoration (blue) compared to uninduced controls (black). n = 8 independent experiments. (D) Flow cytometry quantification of cell cycle progression using 2′-deoxy-5-ethynyluridine (EdU; CDX17P and HCC33) and propidium iodide (PI) incorporation (CDX30P). Data were normalized to DOX-untreated parental controls by subtracting the proportion of cells in S phase in untreated cells from that of DOX-treated cells (Δ % S phase = % S phaseDOX-treated − % S phaseuntreated); ShATOH1 conditions were compared to ShRen controls. CDX17P, n = 4 ShRen, n = 3 ShATOH1#1 and #3; CDX30P, n = 5; HCC33, n = 2 ShRen, n = 3 ShATOH1#1 and #3 independent experiments. (E) Flow cytometry quantification of cell death after 14 days of DOX induction of ATOH1 KD, normalized as in (D). Total cell death is reported as the sum of apoptotic and necrotic cells. CDX17P: n = 4; CDX30P: n = 4 ShRen, n = 7 ShATOH1#1, n = 5 ShATOH1#3; HCC33: n = 2 ShRen, n = 3 ShATOH1#1 and #3 independent experiments. (F) As in (E), reporting total caspase-3+ cells. (G) Flow cytometry quantification of cell death (defined in E) after 7 days of DOX-induction of ATOH1 KD in CDX17P. n = 3 independent experiments. (C–G) p values are reported as per two-tailed unpaired t test. (H and I) ShATOH1#1 CDX17P (H) and CDX30P (I) cells were treated with (red) or without (black) DOX and with or without ferrostatin-1 (1 μM), necrosulfonamide (NSA; 100 nM), or Z-VAD-FMK/Q-VD-OPh (20 μM) and the indicated combinations for 7 days. Cell viability was measured with CellTiter-Glo, normalized to vehicle-treated, DOX-untreated cells and reported as fold change. Statistics are reported as per one-way ANOVA test with Dunnett’s test correction for multiple comparisons between DOX-treated conditions with and without programmed cell death inhibitors. Data are shown as mean ± SD.
Figure 6
Figure 6
ATOH1 depletion decreases tumor growth kinetics and metastasis in vivo (A) In vivo study design to investigate subcutaneous (s.c.) tumor growth and metastasis after s.c. tumor resection. CDX17P ShRen and ShATOH1#3 (ShATOH1) were injected s.c. into NSG mice and left for 19 days for tumor establishment. Mice were then fed either a standard diet (control arms, n = 3) or DOX-supplemented food (experimental arms, n = 15), and s.c. tumor growth was assessed. Tumors were surgically resected when at 500–800 mm3 to allow for metastatic dissemination. Mice were kept on the study for 28 days or until s.c. tumors reached maximum size, whichever came first. (B) Tumor growth curves from day of first tumor measurement to s.c. tumor resection (STAR Methods) for mice implanted with ShRen and ShATOH1 cells and fed a DOX-supplemented diet. Black, ShRen fed a DOX diet; red, ShATOH1#3 fed a DOX diet. 15 mice per cohort; data reported as mean ± SD. Dotted lines indicate when tumors from each cohort reached 500 mm3: ShRen, 14 ± 3 days; ShATOH1, 21 ± 5 days. (C) Quantification of tumor growth curves slopes in (B). Shades of gray, control cohort fed a standard diet for study duration. p values were calculated with ANOVA test, and slope of the curve is reported as mean ± SD per cohort. (D) Kaplan-Meier curve of time to surgical resection of s.c. tumor or maximum 800 mm3 for inoperable tumors. Control arms, fed a standard diet, are reported in scales of gray. p values were calculated with log rank Mantel-Cox test. (E) Quantification of metastatic dissemination to the liver in 3 mice fed a standard diet, 5 ShRen and 15 ShATOH1 tumor-bearing mice fed a DOX diet underwent surgical resection of s.c. tumors and survived on the study thereafter for at least 22 days. Data are shown as percentage of animals displaying metastatic dissemination (disseminated tumor cells and micro/macro-metastases, red) or no metastatic dissemination in the liver (blue). Metastases were identified by human mitochondrion staining. (F) Representative images of human mitochondria, GFP and ATOH1 IHC staining in liver from ShRen DOX-fed and ShATOH1#3 DOX-fed cohorts. Scale bars: 200 μm for human mitochondria and GFP; 100 μm for ATOH1. (G and H) Quantification of GFP (G) and ATOH1 (H) IHC staining in metastases from 2 DOX-untreated ShRen, 3 DOX-untreated ShATOH1#3, 4 ShRen DOX-fed, and 6 ShATOH1#3 DOX-fed mice. Data are geometric mean ± geometric SD. p values are reported as per two-tailed unpaired Mann Whitney U test. (I) In vivo study design to investigate development of metastasis following intracardiac implantation. Prior to cell implantation, ATOH1 depletion was DOX induced for 4 days in vitro, followed by sorting GFP+, viable cells by flow cytometry. Untreated control cells were sorted exclusively for viable cells. Animals in DOX-treated cohorts were fed a DOX-supplemented diet 24 h before implantation and kept on that diet until the endpoint. Animals in the uninduced control groups were given a standard diet. Animals from all 4 cohorts (ShRen with or without DOX and ShATOH1 with or without DOX) were removed at onset of symptoms (i.e., distended abdomen; detailed in STAR Methods) or after 70 days. (J) Kaplan-Meier curve of time to sacrifice. Control cohorts, fed a standard diet, are reported in scales of gray. p values were calculated with log rank Mantel-Cox test. (K) Quantification of metastatic liver dissemination for each cohort. Data are shown as in (D). (L) Quantification of metastatic liver cells per cohort. Metastatic cells were identified based on human mitochondrion staining. Data are shown as mean ± SD. p values were calculated with a two-tailed unpaired Mann Whitney U test. (M and N) Quantification of GFP (M) and ATOH1 (N) IHC staining in metastases from 5 DOX-untreated ShRen, 5 DOX-untreated ShATOH1, 5 ShRen DOX-fed mice, and 1 ShATOH1#3 DOX-fed mouse. Data are shown as geometric mean ± geometric SD. No statistical test could be performed, as ShATOH1 contained only one value.

Update of

References

    1. Gazdar A.F., Bunn P.A., Minna J.D. Small-cell lung cancer: what we know, what we need to know and the path forward. Nat. Rev. Cancer. 2017;17:725–737. doi: 10.1038/nrc.2017.87. - DOI - PubMed
    1. Forman D. International Agency for Research on Cancer; 2014. Cancer Incidence in Five Continents: Volume X.
    1. American Cancer Society. Cancer Facts & Figures. 2022;2022 https://www.cancer.org
    1. Sabari J.K., Lok B.H., Laird J.H., Poirier J.T., Rudin C.M. Unravelling the biology of SCLC: implications for therapy. Nat. Rev. Clin. Oncol. 2017;14:549–561. doi: 10.1038/nrclinonc.2017.71. - DOI - PMC - PubMed
    1. Bunn P.A., Jr., Minna J.D., Augustyn A., Gazdar A.F., Ouadah Y., Krasnow M.A., Berns A., Brambilla E., Rekhtman N., Massion P.P., et al. Small Cell Lung Cancer: Can Recent Advances in Biology and Molecular Biology Be Translated into Improved Outcomes? J. Thorac. Oncol. 2016;11:453–474. doi: 10.1016/j.jtho.2016.01.012. - DOI - PMC - PubMed

MeSH terms

Substances

LinkOut - more resources