

Comparing lagged impacts of mobility changes and environmental factors on COVID-19 waves in rural and urban India: A Bayesian spatiotemporal modelling study
- PMID: 40305435
- PMCID: PMC12043145
- DOI: 10.1371/journal.pgph.0003431
Comparing lagged impacts of mobility changes and environmental factors on COVID-19 waves in rural and urban India: A Bayesian spatiotemporal modelling study
Abstract
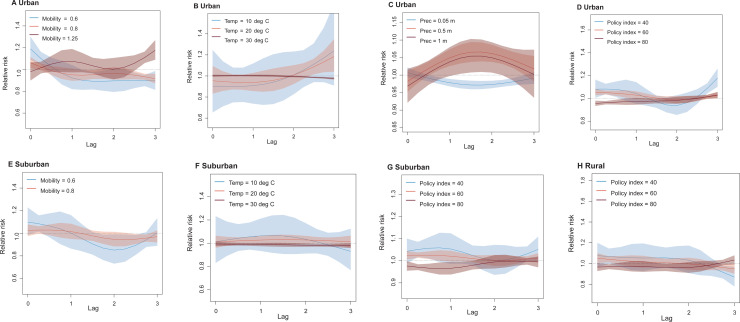
Previous research in India has identified urbanisation, human mobility and population demographics as key variables associated with higher district level COVID-19 incidence. However, the spatiotemporal dynamics of mobility patterns in rural and urban areas in India, in conjunction with other drivers of COVID-19 transmission, have not been fully investigated. We explored travel networks within India during two pandemic waves using aggregated and anonymized weekly human movement datasets obtained from Google, and quantified changes in mobility before and during the pandemic compared with the mean baseline mobility for the 8-week time period at the beginning of 2020. We fit Bayesian spatiotemporal hierarchical models coupled with distributed lag non-linear models (DLNM) within the integrated nested Laplace approximation (INLA) package in R to examine the lag-response associations of drivers of COVID-19 transmission in urban, suburban and rural districts in India during two pandemic waves in 2020-2021. Model results demonstrate that recovery of mobility to 99% that of pre-pandemic levels was associated with an increase in relative risk of COVID-19 transmission during the Delta wave of transmission. This increased mobility, coupled with reduced stringency in public intervention policy and the emergence of the Delta variant, were the main contributors to the high COVID-19 transmission peak in India in April 2021. During both pandemic waves in India, reduction in human mobility, higher stringency of interventions, and climate factors (temperature and precipitation) had 2-week lag-response impacts on the [Formula: see text] of COVID-19 transmission, with variations in drivers of COVID-19 transmission observed across urban, rural and suburban areas. With the increased likelihood of emergent novel infections and disease outbreaks under a changing global climate, providing a framework for understanding the lagged impact of spatiotemporal drivers of infection transmission will be crucial for informing interventions.
Copyright: © 2025 Cleary et al. This is an open access article distributed under the terms of the Creative Commons Attribution License, which permits unrestricted use, distribution, and reproduction in any medium, provided the original author and source are credited.
Conflict of interest statement
The authors have declared that no competing interests exist.
Figures


Update of
-
Comparing lagged impacts of mobility changes and environmental factors on COVID-19 waves in rural and urban India: a Bayesian spatiotemporal modelling study.medRxiv [Preprint]. 2024 Jun 14:2024.06.12.24308871. doi: 10.1101/2024.06.12.24308871. medRxiv. 2024. Update in: PLOS Glob Public Health. 2025 Apr 30;5(4):e0003431. doi: 10.1371/journal.pgph.0003431. PMID: 38946988 Free PMC article. Updated. Preprint.
Similar articles
-
Comparing lagged impacts of mobility changes and environmental factors on COVID-19 waves in rural and urban India: a Bayesian spatiotemporal modelling study.medRxiv [Preprint]. 2024 Jun 14:2024.06.12.24308871. doi: 10.1101/2024.06.12.24308871. medRxiv. 2024. Update in: PLOS Glob Public Health. 2025 Apr 30;5(4):e0003431. doi: 10.1371/journal.pgph.0003431. PMID: 38946988 Free PMC article. Updated. Preprint.
-
Spatiotemporal hierarchical Bayesian analysis to identify factors associated with COVID-19 in suburban areas in Colombia.Heliyon. 2024 Apr 24;10(9):e30182. doi: 10.1016/j.heliyon.2024.e30182. eCollection 2024 May 15. Heliyon. 2024. PMID: 38707376 Free PMC article.
-
Cross-regional analysis of the association between human mobility and COVID-19 infection in Southeast Asia during the transitional period of "living with COVID-19".Health Place. 2023 May;81:103000. doi: 10.1016/j.healthplace.2023.103000. Epub 2023 Mar 13. Health Place. 2023. PMID: 37011444 Free PMC article.
-
Practical geospatial and sociodemographic predictors of human mobility.Sci Rep. 2021 Jul 28;11(1):15389. doi: 10.1038/s41598-021-94683-7. Sci Rep. 2021. PMID: 34321509 Free PMC article.
-
Folic acid supplementation and malaria susceptibility and severity among people taking antifolate antimalarial drugs in endemic areas.Cochrane Database Syst Rev. 2022 Feb 1;2(2022):CD014217. doi: 10.1002/14651858.CD014217. Cochrane Database Syst Rev. 2022. PMID: 36321557 Free PMC article.
Cited by
-
Mapping seasonal human mobility across Africa using mobile phone location history and geospatial data.Res Sq [Preprint]. 2025 Jan 23:rs.3.rs-5743829. doi: 10.21203/rs.3.rs-5743829/v1. Res Sq. 2025. PMID: 39975929 Free PMC article. Preprint.
References
-
- Gupta R, Pal S, Pandey G. A comprehensive analysis of COVID-19 outbreak situation in India. MedRxiv. 2020.
Grants and funding
LinkOut - more resources
Full Text Sources
Miscellaneous