. 2025 May 2;11(18):eadu0419.
doi: 10.1126/sciadv.adu0419. Epub 2025 Apr 30.

Systems analysis unravels a common rural-urban gradient in immunological profile, function, and metabolic dependencies

Affiliations

Systems analysis unravels a common rural-urban gradient in immunological profile, function, and metabolic dependencies

Mikhael D Manurung et al. Sci Adv. .

Abstract

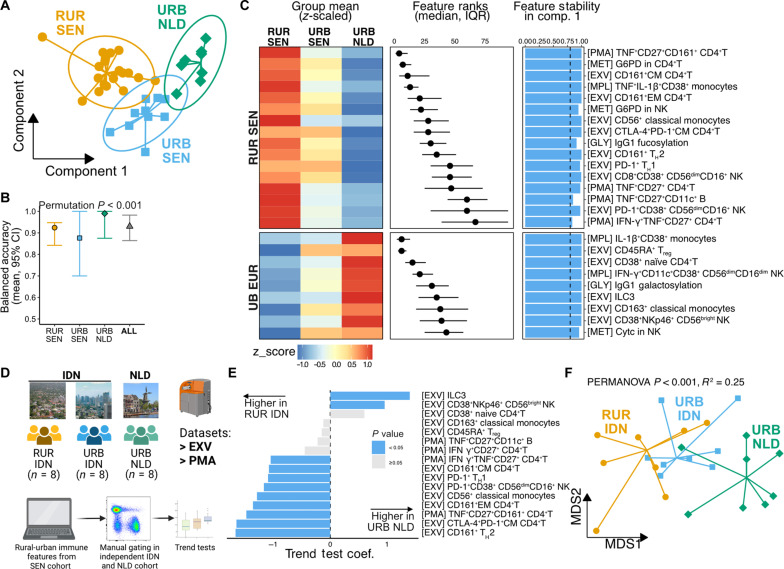
Urbanization affects environmental exposures and lifestyle, shaping immune system variation and influencing disease susceptibility and vaccine responses. Here, we present systems analysis of immune profiles across the rural-urban gradient, comparing rural and urban Senegalese with urban Dutch individuals. By integrating single-cell phenotyping, metabolic profiling, and functional analysis, we reveal a trajectory of immune remodeling along the gradient. This includes enrichment of proinflammatory CD11c+ B cells associated with altered IgG Fc glycosylation, adaptive NK cells with reduced responsiveness to accessory cytokines, and CD161+CD4+T cells with enhanced cytokine production in rural settings. Metabolic perturbation studies demonstrated distinct dependencies on glycolysis, pentose phosphate pathway, and fatty acid synthesis for cellular cytokine responses across populations. We validate core rural-urban immune signatures in an independent Indonesian cohort, suggesting shared immunological adaptations to urbanization across ancestries and geographical areas. Our findings provide insights into rural-urban immune function in understudied populations.


Figures

Fig. 1.
Fig. 1.. Study population characteristics.
(A) Schematic representation of the study population. This figure was created using BioRender. Photographs representing RUR SEN, URB SEN, and URB NLD are credited to: WILLAV-FR, Initsogan, and W. Bulach, respectively (Wikimedia Commons). (B) Age distribution (dot plot) and sex distribution (stacked bar plot) across residential areas. Points represent individual samples; error bars show adjusted marginal means with 95% confidence intervals (CIs). P values comparing differences in age and sex distributions are indicated. (C) IgG1 Fc galactosylation levels across residential areas. Points represent individual samples; error bars show adjusted marginal means with 95% CIs. Trend test and Tukey’s-corrected pairwise comparisons P values are indicated. RUR, rural; URB, urban; SEN, Senegal; NLD, the Netherlands; F, female; M, male. ANOVA, analysis of variance.
Fig. 2.
Fig. 2.. Integrative analysis revealed a rural-to-urban immune trajectory.
(A) Overview of samples and assays performed. (B) MOFA of five datasets showing variance explained per dataset (bar plot) and latent factor (center heatmap), with sample numbers (n) and feature dimensionalities (D). Panels (A) and (B) were created using BioRender. (C) MDS plot using MOFA factors. Points represent individual samples colored by residential group. P values indicate group centroid comparisons using PERMANOVA test. (D) Principal curve trajectory analysis showing sample projections (left) and lambda parameter distribution across residence groups (right). Error bars represent adjusted marginal means with 95% CIs. Linear trend test and Conover post hoc test for pairwise comparisons P values are indicated. (E) Spearman’s correlation distribution between lambda and immune features grouped by immune cell lineage, sorted by median absolute correlation. Number of features associated with each lineage (D) is shown. (F) Volcano plots of immune features correlated with rural-to-urban trajectory (lambda) for the top four immune lineages. PMA; EXV, ex vivo PBMC phenotyping dataset; MET, ex vivo PBMC metabolic enzyme dataset; PMA, PMA/ionomycin-stimulated PBMC dataset; MPL, MPL-stimulated PBMC dataset; GLY, IgG Fc glycosylation dataset; Unconv. T, unconventional T cells.
Fig. 3.
Fig. 3.. TNF+CD11c+ B cell frequencies are associated with altered IgG glycosylation profiles.
(A) LD-UMAP plots of B cells subsampled from EXV and PMA datasets with cluster annotations. (B and C) Heatmaps of differentially abundant (trend test FDR < 0.1) clusters in EXV (B) and MPL (C) datasets showing median signal intensity (tile colors), mean cluster frequencies relative to lineage (gray bars), z-scored cluster frequencies by residence groups (boxplots), as well as trend test coefficients (red/blue bars) and FDR (asterisks). (D and E) TNF-producing cell frequencies (D) and metabolic enzyme levels (E) in CD11c+ B cells across populations. Points represent individual samples; error bars show adjusted marginal means with 95% CIs. Trend test and Tukey’s-corrected pairwise P values are indicated. (F) Left: Linear trend effect sizes of differentially abundant IgG Fc glycopeptides (FDR < 0.1). Right: Spearman’s correlations between IgG Fc-glycan abundances and CD11c+ B cell cluster frequencies. Asterisks indicate correlation P value. (G) UMAP plot of B cells from CITE-Seq data with CD11c+ B cells encircled (dashed lines). (H) Heatmaps showing z-scored expression of cluster markers and IgG glycosylation pathway genes (RNA) and proteins (ADT). (I) Top 5 enriched transcription factors in CD11c+ B cells. Dot size indicates gene list overlap. Enrichment analysis was performed using the Enrichr web interface (accessed August 2023) using ENCODE and ChEA consensus TF gene sets. MSI, median signal intensity; ADT, antibody-derived tags; UMAP, uniform manifold approximation; LD-UMAP, UMAP with linear discriminant initialization; *P/FDR < 0.1, **P/FDR < 0.05, ***P/FDR < 0.01, and ****P/FDR < 0.001.
Fig. 4.
Fig. 4.. Lower frequencies of IFN-γ+ NK cells in rural Senegalese after MPL stimulation are associated with the enrichment of adaptive NK cells.
(A) LD-UMAP of NK cells subsampled from EXV, PMA, and MPL datasets with cluster annotations. Colors and labels indicate cell clusters. (B to D) Heatmaps of differentially abundant (trend test FDR < 0.1) clusters in EXV (B), PMA (C), and MPL (D) datasets showing median signal intensity (tile colors), mean cluster frequencies relative to lineage (gray bars), z-scored cluster frequencies by residence groups (boxplots), as well as trend test coefficients (red/blue bars) and FDR (asterisks). (E) NKG2C+ NK cell frequencies from an independent cohort (n = 8, 6, and and 7 for RUR SEN, URB SEN, and URB NLD, respectively); pairwise comparisons P values are shown. (F) IFN-γ+ NK cell frequencies after IL-12/IL-18 stimulation in NKG2C+ versus NKG2C NK cells. (G) CMV serostatus (left) and anti-CMV IgG titers (right) across populations. Points represent individuals and error bars adjusted marginal means with 95% CIs. Trend test and Tukey’s-corrected P values are indicated. (H and I) CITE-seq neighborhood graphs showing cluster assignments (H) and differentially abundant neighborhoods at 10% FDR (I). (J and K) UMAP of NK cells from CITE-seq data showing cell density (J) and RNA/ADT expression (K). (L) Heatmaps of marker genes (RNA) and proteins (ADT) in NK cell clusters. Colors indicate expression z scores; circle size indicates proportion of cells expressing each gene. CMV, cytomegalovirus. *P/FDR < 0.1, **P/FDR < 0.05, ***P/FDR < 0.01, and ****P/FDR < 0.001. FC, fold change.
Fig. 5.
Fig. 5.. CD161+CD4+T cells are enriched in rural Senegalese, produce more proinflammatory cytokines, and express more IFN-related genes in the resting state.
(A) LD-UMAP of CD4+T cells subsampled from EXV and MPL datasets with cluster labels. (B and C) Heatmaps of differentially abundant (trend test FDR < 0.1) CD4+T cell clusters in EXV (B) and PMA (C) datasets showing median signal intensity (tile colors), mean cluster frequencies relative to lineage (gray bars), z-scored cluster frequencies by residence groups (boxplots), as well as trend test coefficients (red/blue bars) and FDR (asterisks). (D) Cytokine-producing CD161+CD4+T cell frequencies across residence groups with 95% CIs, trend test, and Tukey’s-corrected P values. (E) Metabolic enzyme levels in CD161+CD4+T cells with 95% CIs and trend test P values. (F) UMAP of CD4+T cells from CITE-seq data showing CD161 expression. (G) Differentially expressed genes/proteins in CD161+CD4+T cells comparing rural Senegalese to urban Senegalese/Dutch individuals. Colors indicate expression z scores; circle size indicates proportion of cells expressing each gene. *P/FDR < 0.1, **P/FDR < 0.05, ***P/FDR < 0.01, and ****P/FDR < 0.001.
Fig. 6.
Fig. 6.. Higher basal activation of monocytes in rural Senegalese cells produces more proinflammatory cytokines following activation.
(A) LD-UMAP of monocytes subsampled from EXV, PMA, and MPL datasets with cluster labels. (B to D) Heatmaps of differentially abundant (trend test FDR < 0.1) monocyte clusters in EXV (B), PMA (C), and MPL (D) datasets showing median signal intensity (tile colors), mean cluster frequencies relative to lineage (gray bars), z-scored cluster frequencies by residence groups (boxplots), as well as trend test coefficients (red/blue bars) and FDR (asterisks). (E) TNF+ monocyte frequencies after 6 hours of culture in medium. Points represent individuals, and error bars adjusted means with 95% CIs; trend test and Tukey’s-corrected P values are shown. (F) Correlation between HLA-DR expression (EXV) and spontaneous TNF production. (G) G6PD levels in monocytes across residence groups. (H) Neighborhood graphs showing cluster assignments (top) and differentially abundant neighborhoods (FDR < 10%; bottom). (I) UMAP of CITE-seq data showing RNA (top) ADT (bottom) expressions. (J) Heatmaps of monocyte cluster marker genes (RNA) and proteins (ADT). Colors indicate expression z scores; circle size indicates proportion of cells expressing each gene. *P/FDR < 0.1, **P/FDR < 0.05, ***P/FDR < 0.01, and ****P/FDR < 0.001.
Fig. 7.
Fig. 7.. Validating rural-urban immune signatures in an independent, geographically and ancestrally distinct cohort.
(A) Consensus ordination of samples obtained showing separation by residence group with 95% CIs. (B) Classification accuracies of the DIABLO model (mean and 95% CI) from 100 repetitions of fivefold cross-validation, with permutation test P value (DIABLO.test function in RVAideMemoire R package). (C) Stable features (>80%) distinguishing rural Senegalese (top) from urban Dutch (bottom) showing z-scaled mean values (heatmap tile colors), feature importance ranks (pointrange; calculated using OmicsFold R package), and selection frequencies across cross-validation folds (blue bars). (D) Schematic showing approach to validate signatures shown in C in an independent Indonesian-Dutch cohort. This figure was created using BioRender. Photographs representing RUR IDN, URB IDN, and URB NLD are credited to: Junior Jumper, Kevin Aurell, and W. Bulach, respectively (Wikimedia Commons). (E) Trend test coefficients of manually gated immune cell subsets in the validation cohort with significance indicated (blue, P < 0.05). (F) MDS plot of samples based on manually gated features showing significant group separation (PERMANOVA P < 0.0001, R2 = 0.35).
Fig. 8.
Fig. 8.. Differential impact of metabolic enzyme inhibition on cellular cytokine responses across populations.
(A) Experimental workflow: PBMCs (n = 12 RUR SEN, n = 10 URB SEN, and n = 13 URB NLD) were treated with metabolic enzyme inhibitors or DMSO control before PMA/ionomycin stimulation. The iMFI of cytokines (IFN-γ and TNF) was calculated for each immune cell subset. iMFI was calculated by multiplying frequency of cytokine-positive cells relative to its parent subset with mean fluorescence intensity of cytokine-positive cells. This figure was created using BioRender. (B) Principal components analysis (PCA) plot of cytokine responses following metabolic inhibition. iMFI obtained from (A) from all subset subsets and cytokine pairs was used as input for PCA. Within-individual z scores were calculated to take into account repeated measures. Points represent individuals, colored by pretreatment conditions. (C) Significance (−log10 P values) of cytokine response shifts after metabolic inhibition versus DMSO control for each residence groups (RDA permutation tests, n = 5000). (D) Effect sizes of iMFI changes for 2DG, 6AN, or C75 pretreatments compared to DMSO control. Bars show regression coefficients from linear-mixed models. Colors indicate significance and direction: gray (FDR ≥ 0.1), red (FDR < 0.1, increase), and blue (FDR < 0.1, decrease). Only subset-cytokine pairs with FDR < 0.1 in at least one group per inhibitor are shown. 2DG, 2-deoxy-d-glucose; 6AN, 6-aminonicotinamide; mDCs, myeloid dendritic cells; NK, natural killer cells; γδT, gamma delta T cells; NKT, natural killer T cells; DNT, double negative (CD4CD8) T cells; CM, central memory; EM, effector memory; EMRA, terminally differentiated effector memory cells re-expressing CD45RA; FITC, fluorescein isothiocyanate.

References

    1. Brodin P., Jojic V., Gao T., Bhattacharya S., Angel C. J. L., Furman D., Shen-Orr S., Dekker C. L., Swan G. E., Butte A. J., Maecker H. T., Davis M. M., Variation in the human immune system is largely driven by non-heritable influences. Cell 160, 37–47 (2015). - PMC - PubMed
    1. Carr E. J., Dooley J., Garcia-Perez J. E., Lagou V., Lee J. C., Wouters C., Meyts I., Goris A., Boeckxstaens G., Linterman M. A., Liston A., The cellular composition of the human immune system is shaped by age and cohabitation. Nat. Immunol. 17, 461–468 (2016). - PMC - PubMed
    1. Smolen K. K., Cai B., Fortuno E. S. R., Gelinas L., Larsen M., Speert D. P., Chamekh M., Cooper P. J., Esser M., Marchant A., Kollmann T. R., Single-cell analysis of innate cytokine responses to pattern recognition receptor stimulation in children across four continents. J. Immunol. 193, 3003–3012 (2014). - PMC - PubMed
    1. de Ruiter K., Jochems S. P., Tahapary D. L., Stam K. A., König M., van Unen V., Laban S., Höllt T., Mbow M., Lelieveldt B. P. F., Koning F., Sartono E., Smit J. W. A., Supali T., Yazdanbakhsh M., Helminth infections drive heterogeneity in human type 2 and regulatory cells. Sci. Transl. Med. 12, eaaw3703 (2020). - PubMed
    1. van Riet E., Adegnika A. A., Retra K., Vieira R., Tielens A. G., Lell B., Issifou S., Hartgers F. C., Rimmelzwaan G. F., Kremsner P. G., Yazdanbakhsh M., Cellular and humoral responses to influenza in gabonese children living in rural and semi-urban areas. J Infect Dis 196, 1671–1678 (2007). - PubMed