. 2025 May 2;11(18):eadv9571.
doi: 10.1126/sciadv.adv9571. Epub 2025 Apr 30.

Inhalable myofibroblast targeting nanoparticles for synergistic treatment of pulmonary fibrosis

Affiliations

Inhalable myofibroblast targeting nanoparticles for synergistic treatment of pulmonary fibrosis

Zhike Chen et al. Sci Adv. .

Abstract

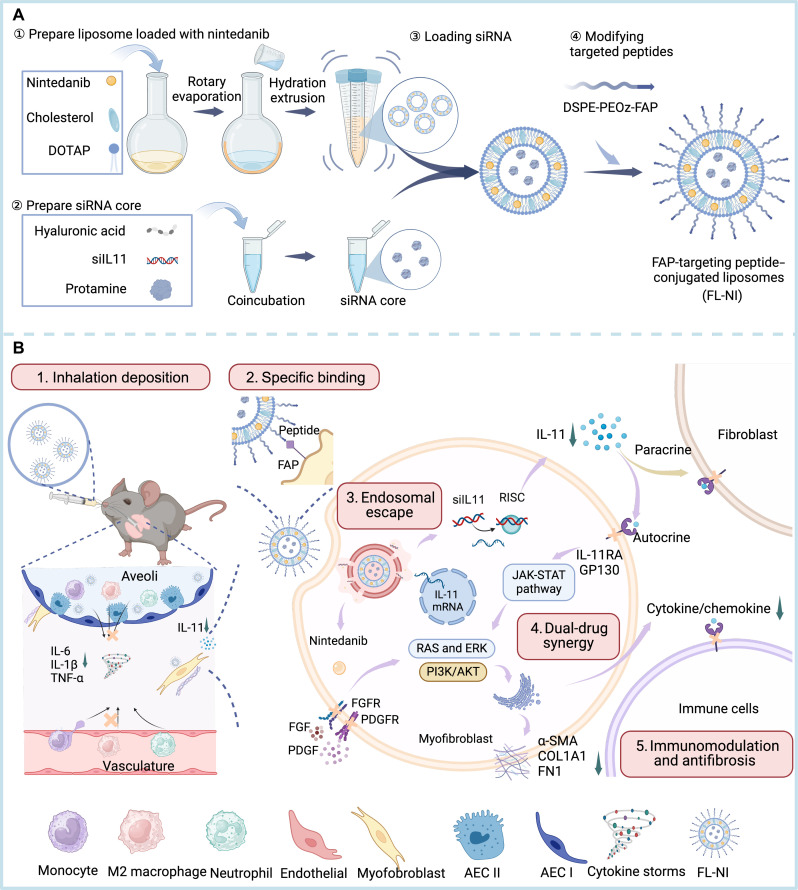
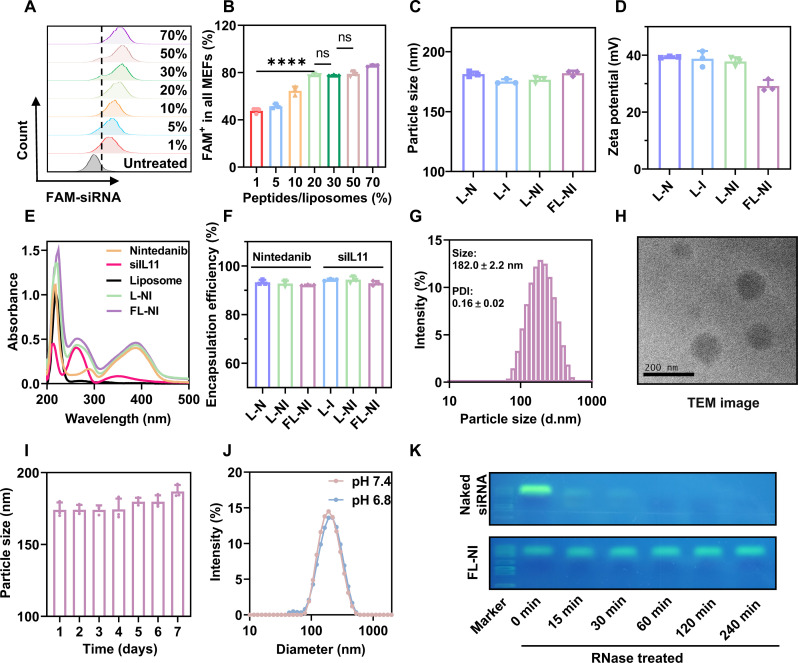
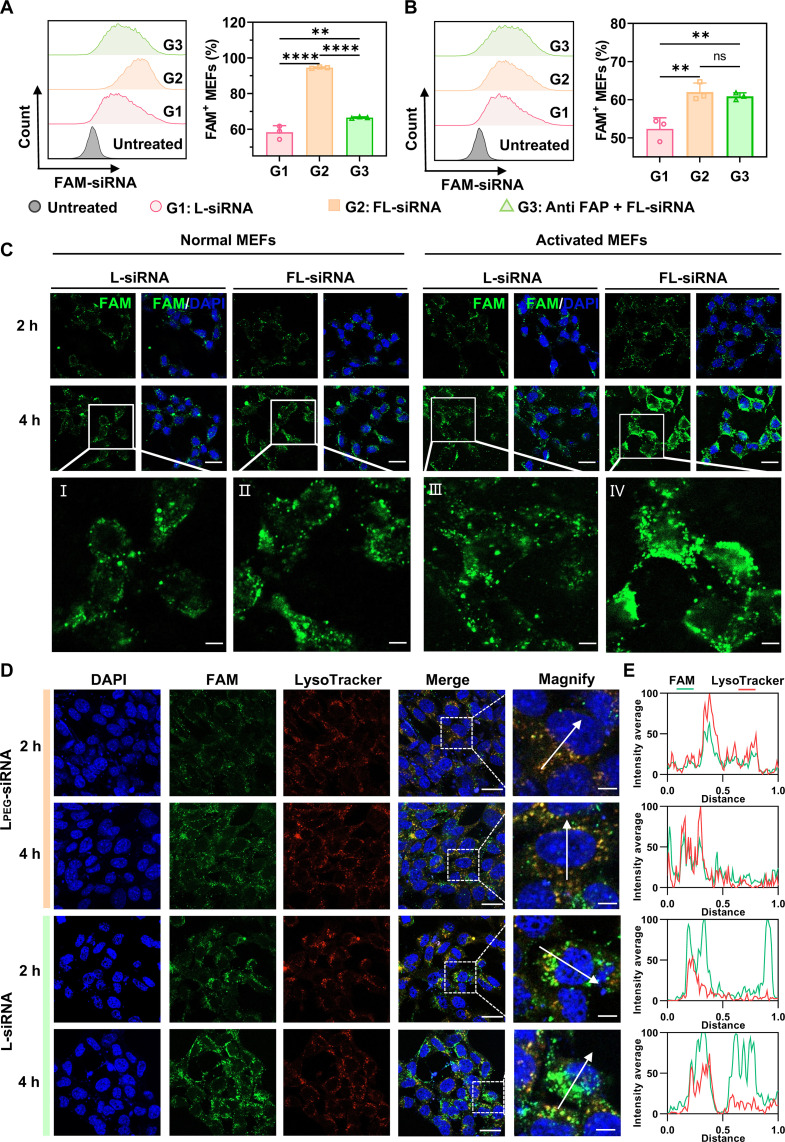
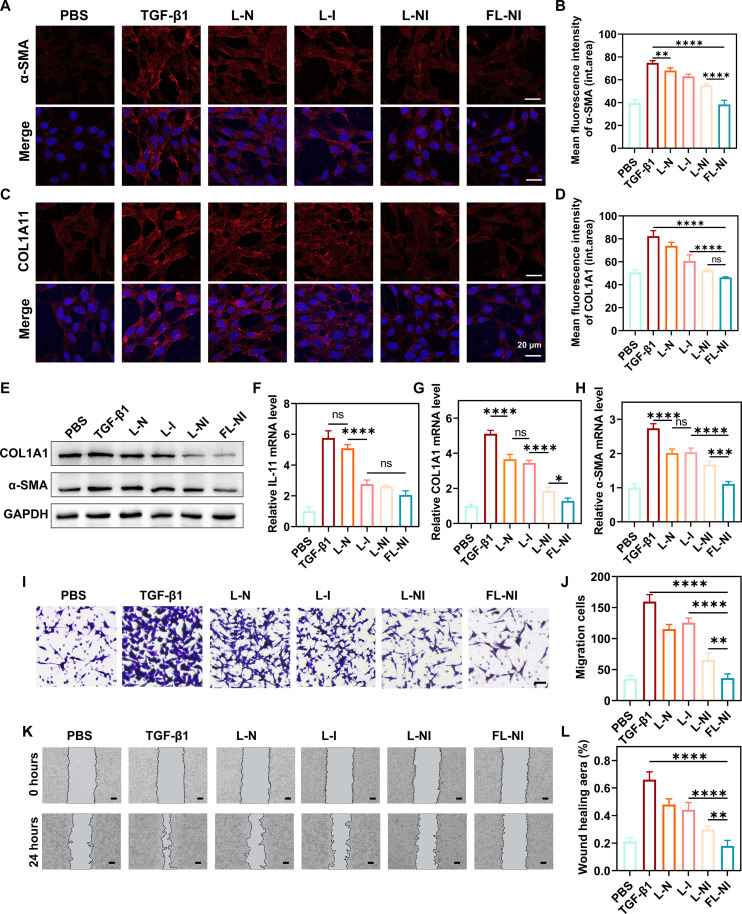
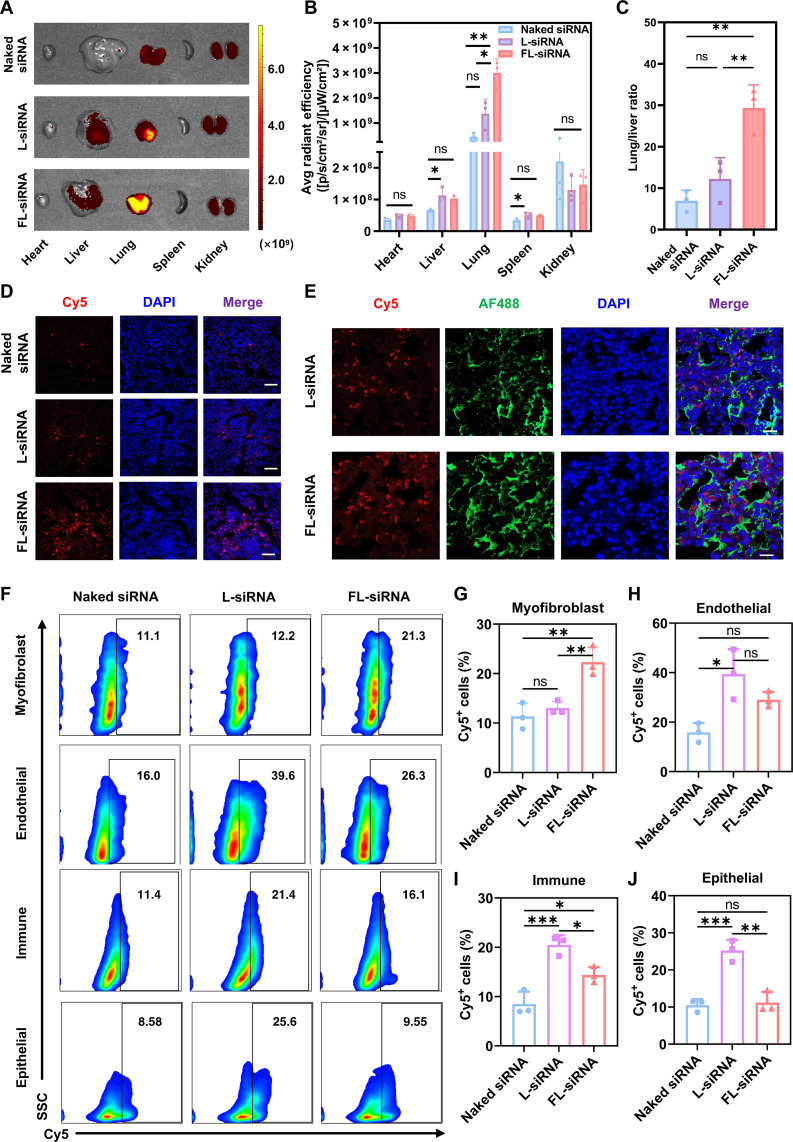
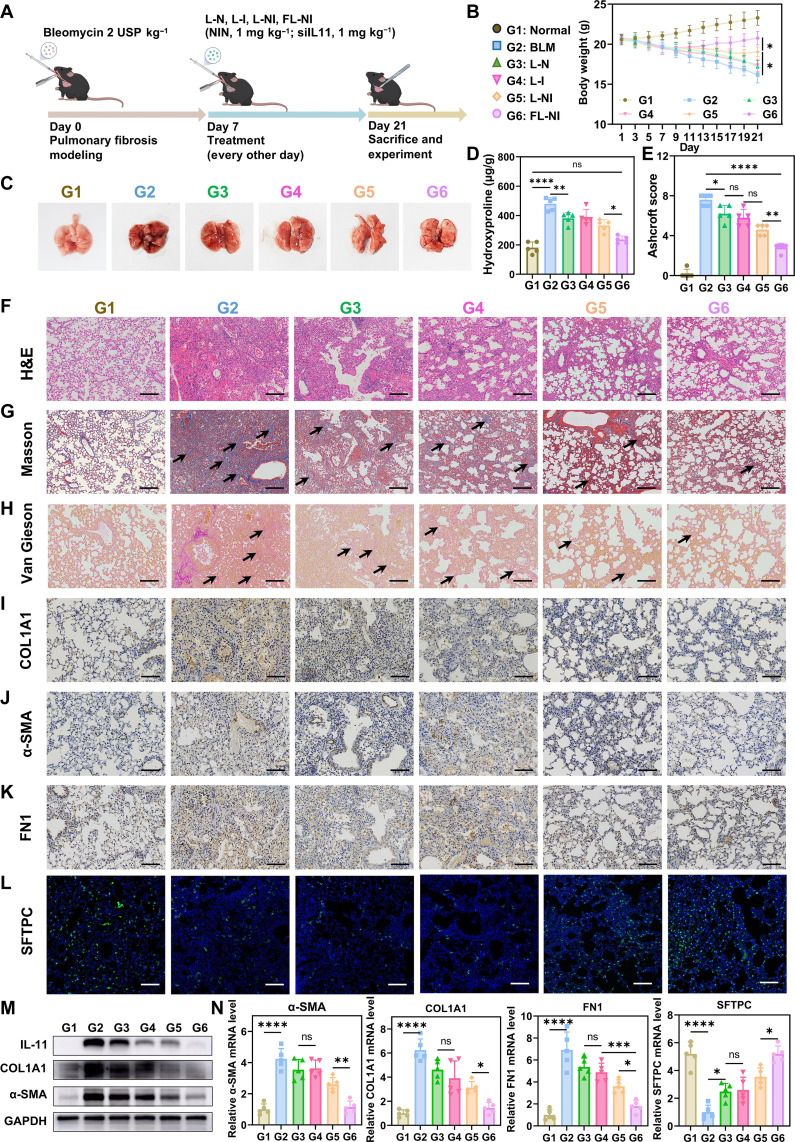
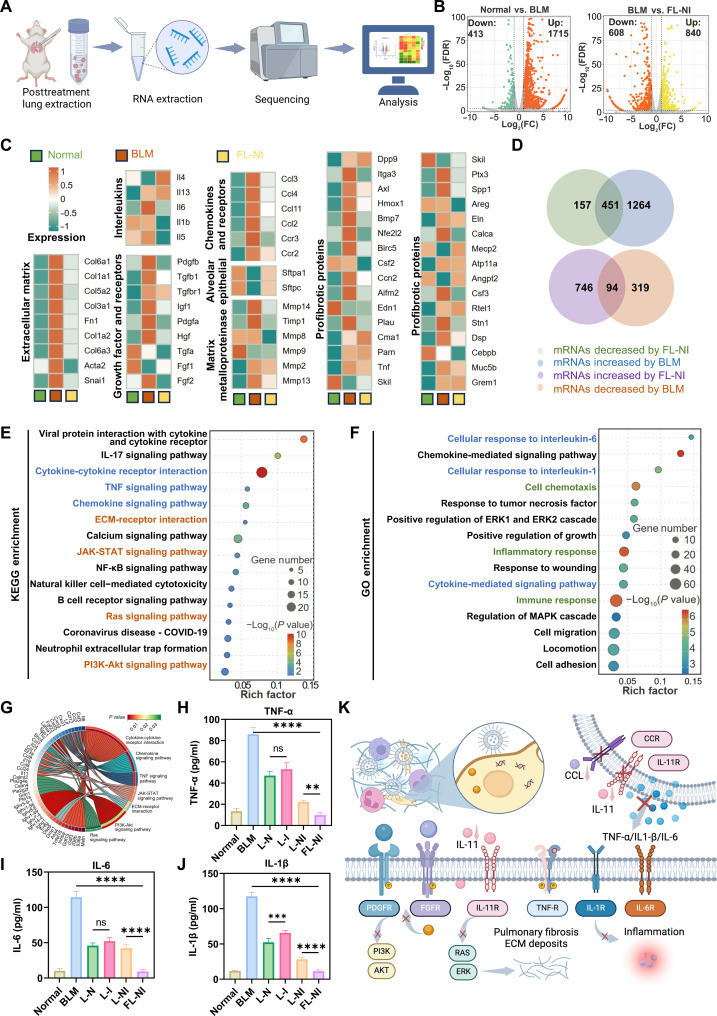
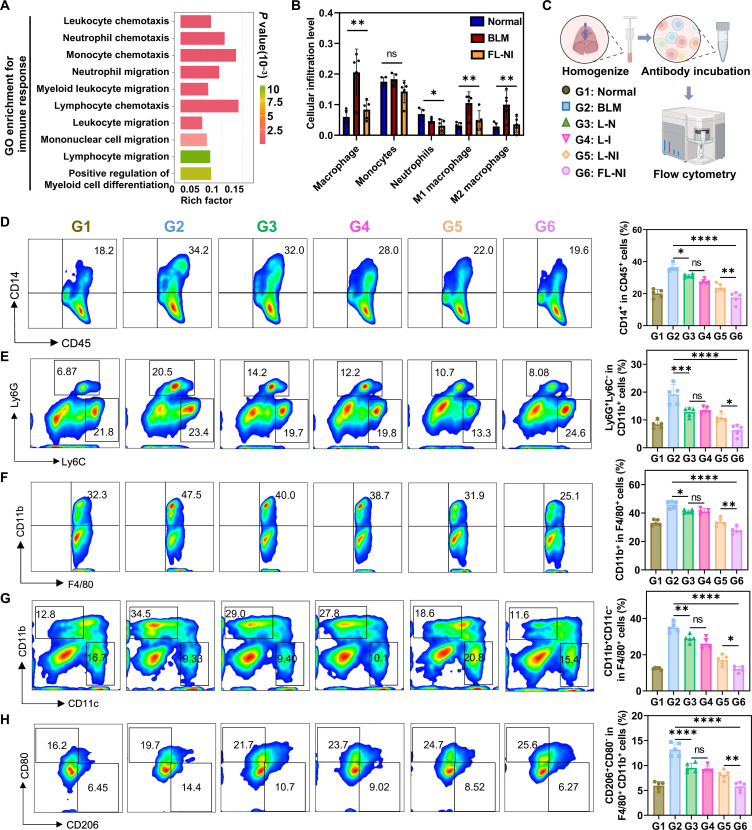
Pulmonary fibrosis (PF) is a life-threatening interstitial lung disease, characterized by excessive fibroblast activation and collagen deposition, leading to progressive pulmonary function decline and limited therapeutic efficacy. Here, the inhalable, myofibroblast-targeted, and pH-responsive liposomes (FL-NI) were developed for effective codelivery of nintedanib, a mainstream antifibrotic drug in clinic, and siIL11, a small interfering RNA that silences the key profibrosis cytokine IL-11. Notably, FL-NI achieved a 117.8% increase in pulmonary drug delivery by noninvasive inhalation and a 71.5% increase in delivery specifically to fibroblast activation protein-positive myofibroblasts while reducing nonspecific immune cell and epithelial uptake by 29.8 and 55.8%, respectively. The accurate inhalation codelivery of nintedanib and siIL11 into myofibroblasts achieved synergistic effects, effectively enhanced myofibroblast deactivation, reduced pathological collagen deposition by 50.8%, and promoted epithelial tissue repair. FL-NI remodeled the aberrant immune microenvironment without inducing systemic toxicities. Therefore, this work demonstrated the notable potential for this pluripotent strategy for improving PF outcomes and its promising clinical translation.


Figures

Fig. 1.
Fig. 1.. Inhalation of activated fibroblast-targeted liposomes (FL-NI) for precise codelivery of NIN and siIL11 in PF treatment.
(A) Components and construction of the FL-NI. (B) Proposed mechanism of FL-NI for PF treatment: 1) Noninvasive inhalation enhances local drug deposition in the lungs; 2) FAP-targeting peptide modification on liposomes improves targeted delivery efficiency to myofibroblasts; 3) pH-responsive PEOz promotes drug release and facilitates endosomal escape; 4) FL-NI codelivers NIN and siIL11 to myofibroblasts, achieving synergistic effects that inhibit fibroblast activation and promote collagen degradation; 5) FL-NI remodels the immune microenvironment of PF. AEC I, type I alveolar epithelial cells; AEC II, type II alveolar epithelial cells; RISC, RNA-induced silencing complex. Created in BioRender. Chen, Q. (2025) https://BioRender.com/qbup1xu.
Fig. 2.
Fig. 2.. Characterization of FL-NI.
(A and B) Fluorescence intensity of MEFs incubated with preparations of different peptides/liposomes ratios. (C) Average particle sizes and (D) zeta potential of different liposomes determined by DLS. (E) Ultraviolet-visible spectra of NIN, siIL11, blank liposome, L-NI, and FL-NI. (F) Drug encapsulation efficiency of NIN and siIL11. (G) Particle size distribution of FL-NI. (H) Representative transmission electron microscopy (TEM) micrograph of FL-NI. Scale bar, 200 nm. (I) Particle size of FL-NI in Dulbecco’s modified Eagle’s medium (DMEM) with 10% fetal bovine serum (FBS). (J) Particle size of FL-NI at different pH values. (K) Stability of naked siRNA and siRNA loaded in FL-NI against RNase. All data are presented as means ± SD (n = 3). Statistical significance was calculated via one-way analysis of variance (ANOVA) (B) in GraphPad Prism. ****P < 0.0001; not significant (ns), P > 0.05.
Fig. 3.
Fig. 3.. Targeting and endosomal escape ability of FL-NI in vitro.
(A and B) Fluorescence intensity of normal (A) and activated (B) MEFs incubated with L-siRNA (pink line), FL-siRNA (orange line), or FL-siRNA with pretreatment with anti-FAP antibodies (1:500 concentration, 2 hours, 37°C) (green line). Bar graphs indicate the percentage of cells exhibiting fluorescence offset. (C) Fluorescence microscopic images of normal and activated MEFs treated with L-siRNA and FL-siRNA for 2 and 4 hours at 37°C. Scale bars, 20 and 5 μm (low- and high-magnification images, respectively). (D) Confocal laser scanning microscopy images of MEFs treated with LPEG-siRNA or L-siRNA for 2 and 4 hours at 37°C. Endosomes/lysosomes were labeled by LysoTracker Red (red), and nuclei were stained with 4′,6-diamidino-2-phenylindole (DAPI; blue). Scale bars, 20 and 5 μm (low- and high-magnification images, respectively). (E) Magnified images of the region of interest with colocalization analysis. All data are presented as means ± SD (n = 3). Statistical significance was calculated via one-way ANOVA [(A) and (B)] in GraphPad Prism. **P < 0.01; ****P < 0.0001; and not significant, P > 0.05. h, hours.
Fig. 4.
Fig. 4.. The activation and migration of fibroblast inhibited by FL-NI in vitro.
(A and B) Immunofluorescence analysis of α-SMA expression in fibroblasts. Scale bars, 20 μm. Data are presented as means ± SD (n = 5). (C and D) Immunofluorescence analysis of COL1A1 expression in fibroblasts. Scale bars, 20 μm. Data are presented as means ± SD (n = 5). (E) WB analysis of COL1A1 and α-SMA in fibroblasts treated by PBS, L-N, L-I, L-NI, and FL-NI. (F to H) qPCR analysis of IL-11, COL1A1, and α-SMA in fibroblasts treated by PBS, L-N, L-I, L-NI, and FL-NI. Data are presented as means ± SD (n = 3). (I) Representative images and (J) statistical analysis of migration cell counts from the transwell migration assay in fibroblasts with different treatments. Scale bar, 50 μm. Data are presented as means ± SD (n = 4). (K) Representative images and (L) statistical analysis on wound healing area of fibroblast with different treatments. Scale bars, 200 μm. Data are presented as means ± SD (n = 3). Statistical significance was calculated via one-way ANOVA in GraphPad Prism. **P < 0.01; ***P < 0.001; ****P < 0.0001; not significant, P > 0.05. GAPDH, glyceraldehyde phosphate dehydrogenase.
Fig. 5.
Fig. 5.. Targeted delivery of FL-NI in vivo.
(A) IVIS images of the heart, liver, lungs, spleen, and kidneys, 24 hours after inhalation of naked Cy5-siRNA, L-siRNA, and FL-siRNA. (B) Fluorescence intensity of the heart, liver, lung, spleen, and kidney, expressed as average radiant efficiency units. (C) Fluorescence intensity ratio of the lung to liver. (D) Confocal microscopy image of Cy5-siRNA distribution in the lung sections in naked siRNA, L-siRNA, and FL-siRNA groups. Scale bars, 100 μm. (E) Immunofluorescence distribution analysis of FAP+ myofibroblasts and Cy5-siRNA in the lung sections in L-siRNA and FL-siRNA groups. Scale bars, 20 μm. (F) Representative flow cytometry diagram showed the distribution of Cy5-siRNA in the lungs after inhalation of the different preparations. (G to J) Statistical data showed the proportion of Cy5-positive cells in (G) myofibroblasts, (H) endothelial cells, (I) immune cells, and (J) epithelial cells after inhalation of the different preparations. All data are presented as means ± SD (n = 3). Significant difference was calculated via one-way ANOVA [(B), (C), and (G) to (J)] in GraphPad Prism. AF488, Alexa Fluor 488; *P < 0.05; **P < 0.01; ***P < 0.001; not significant, P > 0.05.
Fig. 6.
Fig. 6.. FL-NI alleviates BLM-induced PF in vivo.
(A) Timeline for modeling PF and inhalation treatment. (B) Body weights of mice in different groups. G1: normal; G2, BLM; G3, L-N; G4, L-I; G5, L-NI; G6, FL-NI. (C) Morphologic images of lungs after mice were euthanized at the end of treatment period. (D) Quantitative analysis of hydroxyproline content in mouse lung tissues after different treatments. (E) Ashcroft scores of fibrotic lung sections. (F) H&E staining of lung sections from different groups. The collagen fibers are stained blue in (G) Masson staining and red in (H) Van Gieson staining of lung sections from different groups. (I to K) Immunohistochemistry staining of COL1A1 (I), α-SMA (J), and FN1 (K) of lung sections from different groups. (L) Immunofluorescence analysis of SFTPC of lung sections from different groups. (M) WB analysis of IL-11, COL1A1, and α-SMA expression of lung sections from different groups. (N) qPCR analysis of α-SMA, COL1A1, FN1, and SFTPC expression of lung sections from different groups. All data are means ± SD (n = 5). Significant difference was calculated via Student’s t test (B) and one-way ANOVA [(D), (E), and (N)] in GraphPad Prism. *P < 0.05; **P < 0.01; ***P < 0.001; ****P < 0.0001; not significant, P > 0.05.
Fig. 7.
Fig. 7.. Antifibrotic mechanism of FL-NI.
(A) RNA-seq analysis of the lung tissue of mice from different groups. (B) Volcano plots of differentially expressed genes comparing normal versus BLM and BLM versus FL-NI (the latter versus the former). (C) Heatmap illustrating the average expression of fibrosis-related genes in lung tissue of mice from different groups. (D) Venn diagram showing the intersection of genes regulated by BLM and FL-NI. (E) KEGG enrichment analysis of 451 mRNAs that are simultaneously down-regulated by FL-NI and up-regulated by BLM. (F) GO enrichment analysis revealing biological pathways enriched for 451 mRNAs. (G) Chord diagram showing the enrichment of KEGG pathways and the related genes. (H to J) The levels of TNF-α (H), IL-6 (I), and IL-1β (J) in lung tissue homogenates measured by ELISA. Data are means ± SD (n = 5). (K) Diagram illustrating the dual-drug synergistic mechanism for antifibrotic treatment. Significant difference was calculated via one-way ANOVA [(H) to (J)] in GraphPad Prism. **P < 0.01; ***P < 0.001; ****P < 0.0001; not significant, P > 0.05. FDR, false discovery rate; FC, fold change; NF-κB, nuclear factor κB; MAPK, mitogen-activated protein kinase.
Fig. 8.
Fig. 8.. Immune microenvironment of PF remodeled by FL-NI.
(A) GO enrichment analysis results for immunomodulatory biological pathways. (B) Analysis of immune cell infiltration in different groups of mice. (C) Schematic representation of immuno-evaluation of lung tissues of mice from different groups. (D to H) Representative flow cytometry plots and percentages of CD14+ cells in CD45+ cells (D), Ly6G+Ly6C and Ly6C+Ly6G cells in CD11b+ cells (E), CD11b+ cells in F4/80+ cells (F), CD11b+CD11c and CD11c+CD11b cells in F4/80+ cells (G), and CD206+CD80 cells in F4/80+CD11b+ cells (H) in mouse lungs after various treatments. Data are means ± SD (n = 5). Significant difference was calculated via one-way ANOVA [(H) to (J)] in GraphPad Prism. *P < 0.05; **P < 0.01; ***P < 0.001; ****P < 0.0001; not significant, P > 0.05.

Similar articles

References

    1. Raghu G., Remy-Jardin M., Richeldi L., Thomson C. C., Inoue Y., Johkoh T., Kreuter M., Lynch D. A., Maher T. M., Martinez F. J., Molina-Molina M., Myers J. L., Nicholson A. G., Ryerson C. J., Strek M. E., Troy L. K., Wijsenbeek M., Mammen M. J., Hossain T., Bissell B. D., Herman D. D., Hon S. M., Kheir F., Khor Y. H., Macrea M., Antoniou K. M., Bouros D., Buendia-Roldan I., Caro F., Crestani B., Ho L., Morisset J., Olson A. L., Podolanczuk A., Poletti V., Selman M., Ewing T., Jones S., Knight S. L., Ghazipura M., Wilson K. C., Idiopathic pulmonary fibrosis (an update) and progressive pulmonary fibrosis in adults: An official ATS/ERS/JRS/ALAT clinical practice guideline. Am. J. Resp. Cri.t Care Med. 205, E18–E47 (2022). - PMC - PubMed
    1. Podolanczuk A. J., Thomson C. C., Remy-Jardin M., Richeldi L., Martinez F. J., Kolb M., Raghu G., Idiopathic pulmonary fibrosis: State of the art for 2023. Eur. Respir. J. 61, 2200957 (2023). - PubMed
    1. Bellou V., Belbasis L., Evangelou E., Tobacco smoking and risk for pulmonary fibrosis: A prospective cohort study from the UK Biobank. Chest 160, 983–993 (2021). - PubMed
    1. Huang W. J., Tang X. X., Virus infection induced pulmonary fibrosis. J. Transl. Med. 19, 496 (2021). - PMC - PubMed
    1. Borie R., Kannengiesser C., Antoniou K., Bonella F., Crestani B., Fabre A., Froidure A., Galvin L., Griese M., Grutters J. C., Molina-Molina M., Poletti V., Prasse A., Renzoni E., van der Smagt J., van Moorsel C. H. M., European Respiratory Society statement on familial pulmonary fibrosis. Eur. Respir. J. 61, 2201383 (2023). - PubMed