. 2025 May 20;6(5):102098.
doi: 10.1016/j.xcrm.2025.102098. Epub 2025 Apr 29.

scRNA-seq reveals an immune microenvironment and JUN-mediated NK cell exhaustion in relapsed T-ALL

Affiliations

scRNA-seq reveals an immune microenvironment and JUN-mediated NK cell exhaustion in relapsed T-ALL

Yong Liu et al. Cell Rep Med. .

Abstract

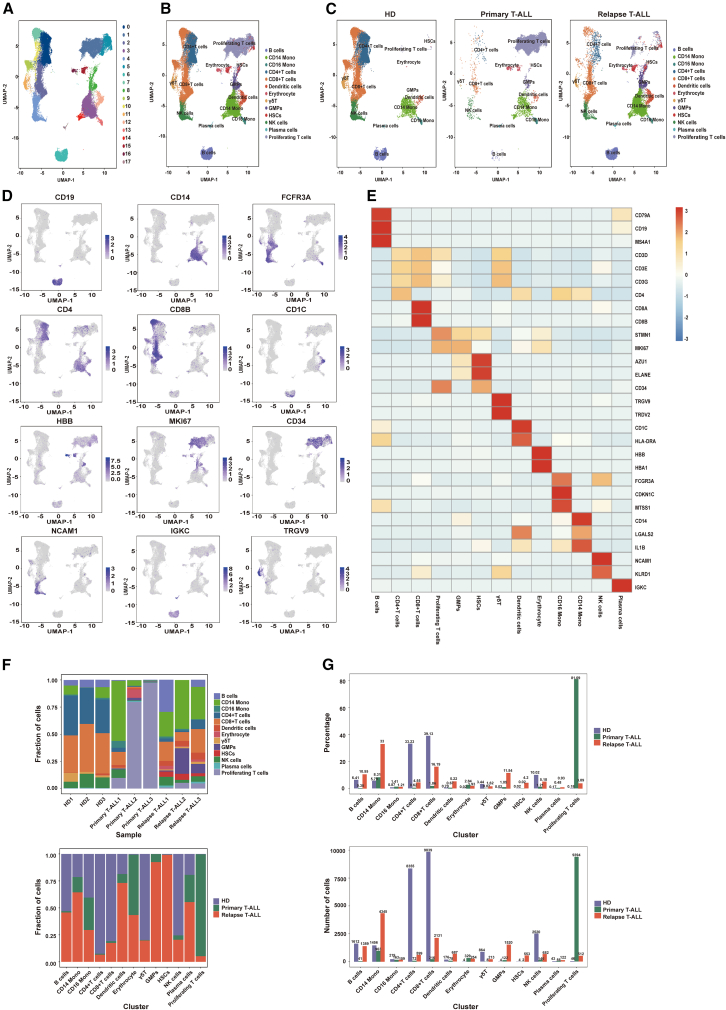
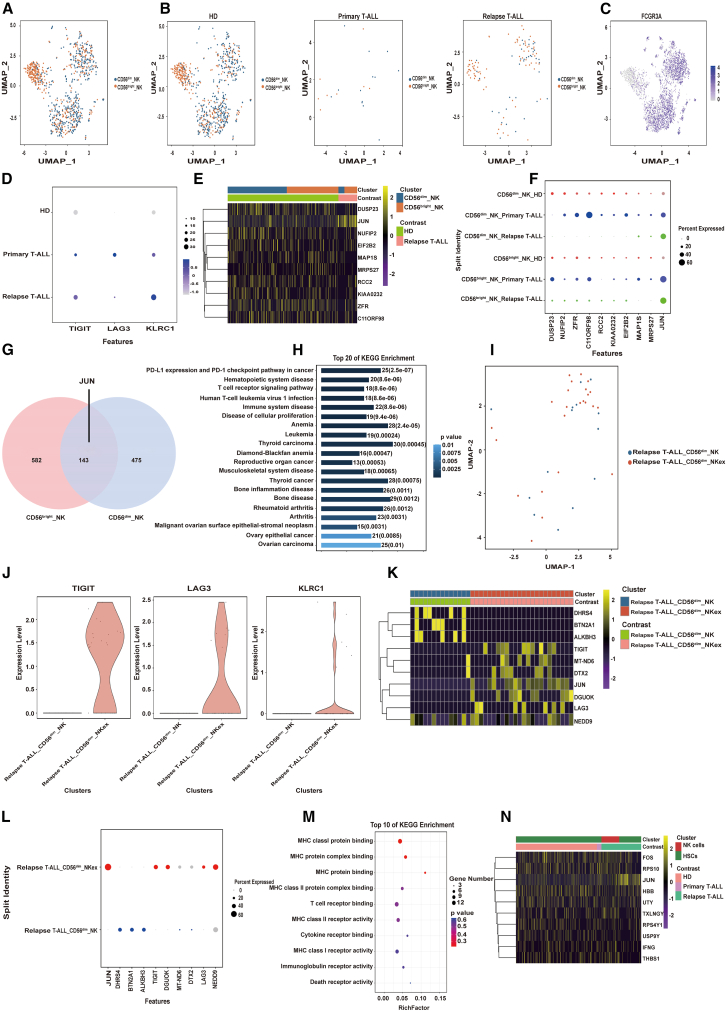
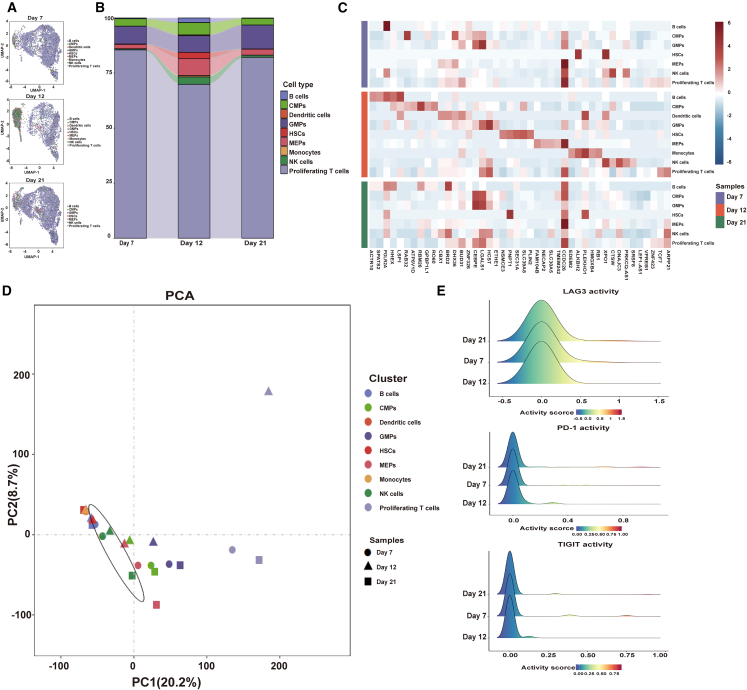
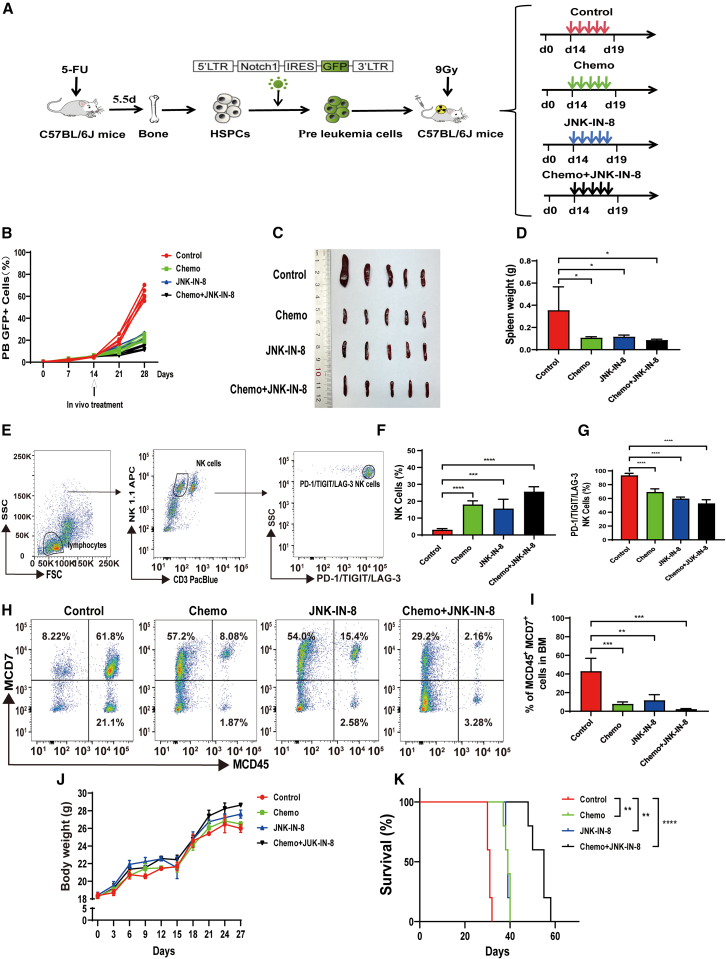
T cell acute lymphoblastic leukemia (T-ALL) is a heterogeneous disease characterized by a high relapse rate. By single-cell transcriptome analysis, we characterize the bone marrow immune microenvironment in patients with T-ALL, identifying 13 major cell clusters. These patients exhibited abnormally expanded hematopoietic stem cells (HSCs) and granulocyte-monocyte progenitors (GMPs), immunosuppressive traits in CD4+ T, CD8+ T, and natural killer (NK) cells. Subdividing CD4+ T cells reveal two subsets transitioning between T helper (Th)1/Th2, Annexin-A1 (ANXA1)-GATA3-CD4+ T, and ANXA1+GATA3+CD4+ T. Additionally, NK cells demonstrate exhaustion in the tumor microenvironment of patients with relapsed T-ALL, with JUN identified as a critical factor. Additionally, JUN is also highly expressed in T-ALL and is crucial for maintaining its proliferation. The JUN inhibitor exhibited successful lethality toward leukemia cells and ameliorated NK cell exhaustion in relapsed T-ALL cell line, as well as in cell-derived tumor xenograft (CDX), patient-derived tumor xenograft (PDX), and NOTCH1-mutant mouse models. In summary, our findings enhance the understanding of T-ALL relapse mechanisms and support the development of innovative immunotherapies for patients with relapsed T-ALL.

Keywords: JUN; NK cells; T cell acute lymphoblastic leukemia; immune exhaustion; single-cell RNA sequencing.


Conflict of interest statement

Declaration of interests The authors declare no competing interests.

Figures

None
Graphical abstract
Figure 1
Figure 1
scRNA-seq profiling of TIME in HDs and patients with T-ALL (A) UMAP plots of 49,892 single cells from three patients with relapsed T-ALL, three primary patients, and three HDs, clustered into 18 groups. Each dot represents a single cell, colored by cluster. (B) UMAP visualization of cell types identified using SingleR. (C) A subset of immunoprofiles highlighting differences between relapsed T-ALL, primary T-ALL, and HD compartments on the same UMAP coordinates as (B). (D) UMAP feature maps illustrating marker gene differential expression (CD19, CD14, FCGR3A, CD4, CD8B, CD1C, HBB, MKI67, CD34, NCAM1, IGKC, and TRGV9). Color scale indicates normalized gene expression per cell. (E) Average expression of marker genes across cell types; red boxes indicate higher expression. (F) Histograms showing cell proportions in HDs, patients with primary T-ALL, and patients with relapsed T-ALL (above) and proportions of patients in each cell type (below). (G) Histograms showing cell proportions (above) and cell numbers (below) in HD, primary T-ALL, and relapsed T-ALL groups.
Figure 2
Figure 2
NK cell re-clustering and exhaustion analysis (A) UMAP plots of NK cells from HDs and patients with primary T-ALL and relapsed T-ALL, color-coded by NK subtype. (B) UMAP subsets highlighting NK cell atlas groups from (A) to visualize differences between HDs and patients with primary T-ALL and relapsed T-ALL. (C) Feature plots showing FCGR3A expression. (D) Dot plots displaying differentially expressed genes in NK cells of HDs and patients with primary T-ALL and relapsed T-ALL, with circle size indicating gene expression percentage. (E and F) Cluster heatmap (E) and bubble plot (F) depicting top 10 significantly different genes in NK cells of HDs and patients with primary T-ALL primary and relapsed T-ALL. (G) Venn diagram showing genes shared between CD56dim_NK and CD56bright_NK cells in patients with relapsed T-ALL. (H) Enrichment of KEGG pathways using differentially expressed genes (DEGs) between NK cells of patients with relapsed T-ALL and HDs. (I) UMAP projection of CD56dim_NK and CD56dim_NKex cells in patients with relapsed T-ALL, clustered and color-coded. (J) Violin plots illustrating differential expression of exhaustion markers (TIGIT, LAG3, and KLRC1) between CD56dim_NK and CD56dim_NKex cells in patients with relapsed T-ALL. (K and L) Clustered heatmap (K) and bubble plot (L) displaying top 10 significantly different genes in NK cells between CD56dim_NK and CD56dim_NKex cells in patients with relapsed T-ALL. (M) Enrichment of KEGG pathways using DEGs between CD56dim_NK and CD56dim_NKex cells in patients with relapsed T-ALL. (N) Cluster heatmap depicting top 10 significantly different genes in NK and HSCs cells of HDs and patients with primary T-ALL primary and relapsed T-ALL.
Figure 3
Figure 3
Longitudinal scRNA-seq analysis of immune cell changes, such as NK cells, in T-ALL PDX (#1) mice (A) UMAP visualization of scRNA-seq data from days 5, 7, and 21 in T-ALL PDX (#1) mice. (B) Sankey plot illustrating the dynamic changes in cell states on days 5, 7, and 21. (C) Heatmap of differentially expressed genes at days 5, 7, and 21. (D) PCA analysis based on cells from days 5, 7, and 21. The dot shape indicates the cell state at various stages. (E) Ridge plot showing the activity scores of transcription factors PD-1, TIGIT, and LAG-3 in NK cells on days 5, 7, and 21.
Figure 4
Figure 4
At the optimal dose, JUN inhibitors suppress T-ALL cells in the T-ALL PDX (#1) mouse model and extend mouse survival (A) Diagram of the T-ALL PDX (#1) mouse model establishment and JUN inhibitor therapy. NCG mice were injected intravenously with 1 × 10⁶ human patient-derived T-ALL (#1) cells via tail vein to generate the first-generation PDX (#1) model. Primary T-ALL cells were then expanded in vivo to create the second-generation model. After model establishment, mice were randomly allocated to control, chemotherapy (0.15 mg/kg vincristine, 15 mg/kg dexamethasone, and 1,000 IU/kg L-asparaginase, i.v., qd), JUN inhibitor (JNK-IN-8: 5, 10, and 20 mg/kg, i.v., qd), and combined treatment groups (chemotherapy + JNK-IN-8: 5, 10, and 20 mg/kg) (n = 5). (B) Changes in body weight of T-ALL mice across treatment groups (n = 5). (C and D) Spleen images (C) and statistical analysis of spleen weights (D) on day 20 in T-ALL mice from different treatment groups (n = 5). ns, not significant; ∗∗p < 0.01, ∗∗∗p < 0.001, ∗∗∗∗p < 0.0001, Student’s t test. (E and F) Flow cytometric quantification of T-ALL cells in BM samples from five T-ALL mice labeled with hCD7-APC and hCD45-fluorescein isothiocyanate (FITC). Representative flow cytometry images (E) and statistical analysis (F) of T-ALL cells (hCD45+hCD7+) in the BM. ∗∗∗p < 0.001, ∗∗∗∗p < 0.0001, Student’s t test. (G) Survival curves for T-ALL mice across multiple treatment groups (n = 5) using the Kaplan-Meier method. ns, not significant; ∗∗p < 0.01, ∗∗∗∗p < 0.0001, log rank test. (H–J) Blood biochemical indices in T-ALL mice from each treatment group (n = 5): ALT (H), AST (I), and CREA (J). ns, not significant; ∗∗p < 0.01; ∗∗∗∗p < 0.0001, Student’s t test. ALT, alanine transaminase; AST, aspartate transaminase; CREA, creatinine.
Figure 5
Figure 5
JUN inhibitor induces T-ALL cell eradication in the T-ALL CDX mouse model (A) Diagram of the T-ALL CDX mouse model establishment and JUN inhibitor treatment. To create the T-ALL model, 1 × 10⁶ MOLT-4-luc cells were injected into the tail veins of NCG mice. After model establishment, mice were randomly assigned to 4 groups: control, chemotherapy, JNK-IN-8 (10 mg/kg), and combined treatment. (B) Changes in body weight of T-ALL mice (n = 5) across different treatment groups. (C) Luciferase signal images (left) and photon flux quantification (right) showed weekly bioluminescence imaging of T-ALL mice (n = 5) to track tumor burden. Data are expressed as mean ± SD. ns, not significant; ∗∗∗p < 0.001, ∗∗∗∗p < 0.0001, Student’s t test. (D) Survival curves fit by the Kaplan-Meier method for T-ALL mice divided into 4 groups based on therapy. ∗p < 0.05, ∗∗p < 0.01, ∗∗∗p < 0.001, log rank test. (E and F) Statistical analysis of spleen weight (F) and spleen pictures (E) in T-ALL mice across treatment groups (n = 5). ∗∗∗∗p < 0.0001, Student’s t test. (G and H) Assessment of T-ALL cell numbers in BM by flow cytometry using hCD45-FITC staining in T-ALL mice (n = 5). Representative flow cytometry images (G) and statistical analysis (H) of T-ALL cells (hCD45+) in BM. ∗∗∗∗p < 0.0001, Student’s t test. (I) BM cells from each treatment group were harvested on day 21, and cellular apoptosis-related proteins and JUN expression levels were examined by western blotting.
Figure 6
Figure 6
JUN inhibitor eradicates T-ALL cells and alleviates NK cell exhaustion in NOTCH1-induced mouse model (A) Diagram of NOTCH1-induced T-ALL mouse model construction and JUN inhibitor therapy. HSCs from donor mouse BM were transfected with a NOTCH1 retrovirus, and then 4 × 10⁵ NOTCH1-infected preleukemic cells were transplanted into lethally irradiated recipient mice via tail vein injection to establish the model. After model establishment, mice were randomly assigned to control, chemotherapy, JNK-IN-8, and combination treatment groups (n = 5). (B) GFP+ T-ALL cell proportions in peripheral blood of T-ALL mice (n = 5), classified by treatment group and tracked weekly. (C and D) T-ALL mice weight data (D) and spleen pictures (C) from different treatment groups (n = 5). ∗p < 0.05, Student’s t test. (E–G) To assess the proportion of NK cells, flow cytometric analysis was performed on BM cells (n = 5) from T-ALL mice labeled with anti-CD3-PacBlue, anti-NK1.1-APC, anti-mPD-1-FITC, anti-mTIGIT-PE/Cyanine7, and anti-mLAG-3-APC. Gating strategy for identification of NK cells (E), percentage of NK cells (F), and data on exhausted NK cells (G) in the BM. ∗∗∗p < 0.001, ∗∗∗∗p < 0.0001, Student’s t test. (H and I) Showing typical results from flow cytometry of T-ALL cells (MCD45+ MCD7+) in BM. ∗∗p < 0.01, ∗∗∗p < 0.001, Student’s t test. (J) Using Student’s t test, we can see the variation in body weight between the 4 treatment groups of T-ALL mice. (K) Survival curves fit by the Kaplan-Meier method for T-ALL mice divided into 4 groups according to therapy. ∗∗p < 0.01, ∗∗∗∗p < 0.0001, log rank test.

References

    1. Vadillo E., Dorantes-Acosta E., Pelayo R., Schnoor M. T cell acute lymphoblastic leukemia (T-ALL): New insights into the cellular origins and infiltration mechanisms common and unique among hematologic malignancies. Blood Rev. 2018;32:36–51. doi: 10.1016/j.blre.2017.08.006. - DOI - PubMed
    1. Roberts K.G. Genetics and prognosis of ALL in children vs adults. Hematology Am. Soc. Hematol. Educ. Program. 2018;2018:137–145. doi: 10.1182/asheducation-2018.1.137. - DOI - PMC - PubMed
    1. Hong Z., Wei Z., Xie T., Fu L., Sun J., Zhou F., Jamal M., Zhang Q., Shao L. Targeting chemokines for acute lymphoblastic leukemia therapy. J. Hematol. Oncol. 2021;14:48. doi: 10.1186/s13045-021-01060-y. - DOI - PMC - PubMed
    1. Zhang Y., Zhou W., Yang J., Yang J., Wang W. Chimeric antigen receptor engineered natural killer cells for cancer therapy. Exp. Hematol. Oncol. 2023;12:70. doi: 10.1186/s40164-023-00431-0. - DOI - PMC - PubMed
    1. Zhou Y., Cheng L., Liu L., Li X. NK cells are never alone: crosstalk and communication in tumour microenvironments. Mol. Cancer. 2023;22:34. doi: 10.1186/s12943-023-01737-7. - DOI - PMC - PubMed

MeSH terms

LinkOut - more resources