. 2025 Apr 30;16(1):4047.
doi: 10.1038/s41467-025-59193-4.

Inhibition of MBTPS1 enhances antitumor immunity and potentiates anti-PD-1 immunotherapy

Affiliations

Inhibition of MBTPS1 enhances antitumor immunity and potentiates anti-PD-1 immunotherapy

Yi-Yu Wang et al. Nat Commun. .

Abstract

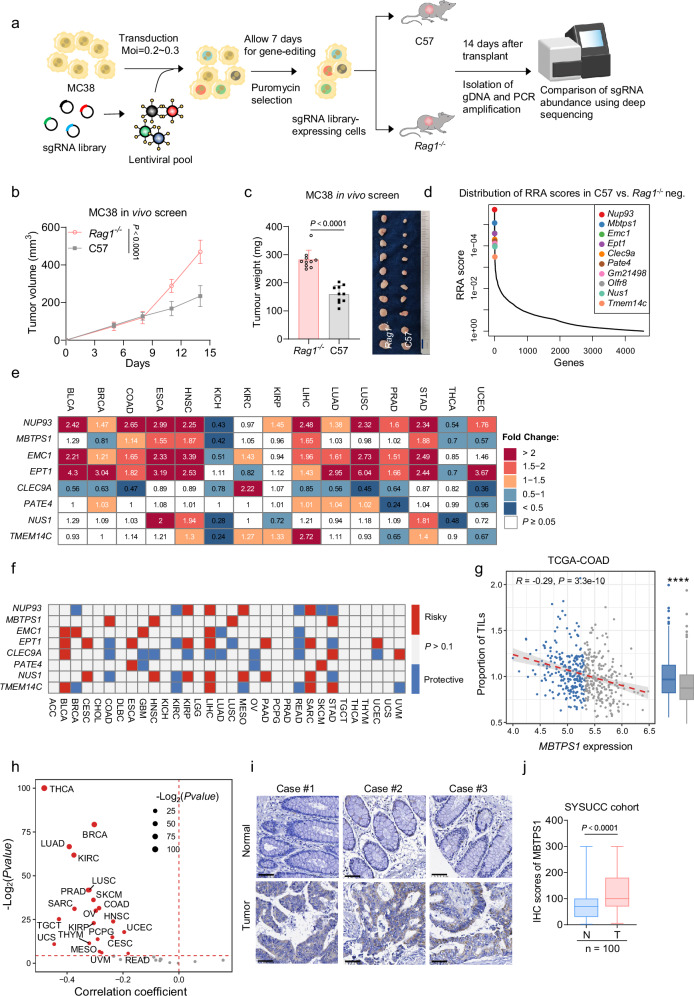
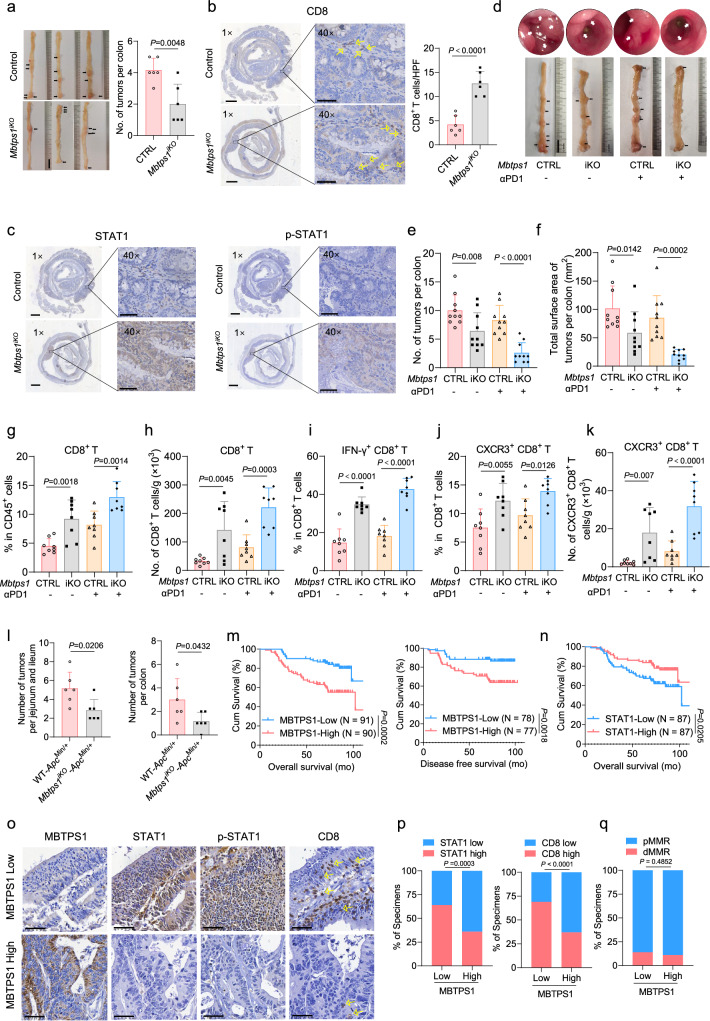
Despite advances in cancer immunotherapy, colorectal cancer patients exhibit limited therapeutic responses. Therefore, the exploration of strategies combining immunotherapy with adjuvant approaches to enhance adaptive immune responses is in demand. Here, we perform a customized in vivo CRISPR-Cas9 screen to target genes encoding membrane and secreted proteins in CRC mouse models with different immune characteristics. We observe that loss of membrane-bound transcription factor site-1 protease (MBTPS1) in tumor cells enhances antitumor immunity and potentiates anti-PD-1 therapy. Mechanistic studies reveal that tumor cell-intrinsic MBTPS1 competes with USP13 for binding to STAT1, thereby disrupting the USP13-dependent deubiquitination-mediated STAT1 stabilization. The upregulated STAT1-transcribed chemokines including CXCL9, CXCL10, and CXCL11, promote CXCR3+CD8+ T cell infiltration. Notably, the regulatory role of MBTPS1 in antitumor immunity operates independently of its classic function in cleaving membrane-bound transcription factors. Collectively, our results provide a theoretical basis for MBTPS1 as a potential immunotherapy target.


Conflict of interest statement

Competing interests: The authors declare no competing interests.

Figures

Fig. 1
Fig. 1. An in vivo CRISPR screen focused on membrane and secreted proteins identifies MBTPS1 as a potential immunotherapy target.
a Strategy of in vivo CRISPR screen system. b Tumor growth curves for female C57 mice (6-8 weeks old) and female Rag1-/- mice (5-6 weeks old) in the CRISPR screen. c Tumor weights and tumor image of MC38 tumors for C57 mice and Rag1-/- mice in the CRISPR screen. Scale bar, 1 cm. d Plot of MAGeCK RRA score and rank of genes in the comparison between C57 mice and Rag1-/- mice. Top candidate genes are highlighted in color as marked. e The expression distribution of the top 10 genes in paired tumor tissues and normal tissues across 15 cancer types from TCGA. f Overall survival analysis based on the high or low expression of the top 10 genes across 32 cancer types from TCGA. g Correlation between MBTPS1 expression and tumor-infiltrating lymphocytes (TILs) in TCGA-COAD dataset. h Pearson correlation between tumor-infiltrating lymphocytes (TILs) proportion and MBTPS1 expression across 33 cancer types from TCGA. i, j Representative IHC staining images (i) and IHC staining scores (j) of MBTPS1 expression in paired primary tumor tissues (T) and adjacent normal tissues (N) of CRC patients from SYSUCC. Scale bar: 50 μm. n = 10 mice per group in b and c; n = 100 CRC tissue specimens in j. The data in b and c were presented as means ± SDs and the data in g and j were presented as box-and-whisker plots showing the median (centre line), 25th to 75th percentiles (box bounds), and minima to maxima (whiskers). Two-tailed unpaired Student’s t-test for b and c; two-tailed paired Student’s t-test for j; Wilcox test for e; Log-rank test for f; Pearson’s correlation analysis for g and h. Source data are provided as a Source Data file.
Fig. 2
Fig. 2. Loss of MBTPS1 inhibits tumor growth in immunocompetent mice and sensitizes tumors to immunotherapy.
a Growth curves and weights of shVec/shMbtps1 MC38 tumors in female C57 mice (6-8 weeks old). b, c Growth curves of shVec/shMbtps1 CT26 tumors in female BALB/c mice (6-8 weeks old) and E0771 tumors in C57 mice. d, e Growth curves of OEVec/OEMbtps1 MC38 (d) and E0771 (e) tumors in C57 mice. f, g Growth curves of shVec/shMbtps1 MC38 tumors in female Rag1-/- mice (5-6 weeks old) (f) and female BALB/c Nude mice (5-6 weeks old) (g). h Schematic of in vivo competition assay (scale bar: 100 μm). i, j Ratio changes of E0771 (i) and MC38 (j) cells cultured in vitro or tansplanted in C57 mice. k, l Growth curves (k), weights and tumor image (l, scale bar: 1 cm) of shVec/shMbtps1 MC38 tumors in anti-PD-1 (5 mg/kg, i.p.)-treated C57 mice. m Survival of shVec/shMbtps1 MC38 tumor-bearing mice treated with anti-PD-1 (5 mg/kg, i.p.). n Growth curves of E0771 tumors in anti-PD-1 (5 mg/kg, i.p.)-treated C57 mice. o, p Growth curves of KPC (o) and B16 (p) tumors in anti-PD-1 (10 mg/kg, i.p.)-treated C57 mice. q, r Growth curves (q) and weights (r) of MC38 tumors in C57 mice treated with half-dose anti-PD-1 (2.5 mg/kg). s Survival of E0771-bearing mice with half-dose anti-PD-1 (2.5 mg/kg). n = 6 mice per group in ag and nr; n = 8 mice per group in il and s; n = 10 mice per group in m. Data are presented as means ± SDs. Two-tailed unpaired Student’s t-test for ag, i and j. one-way ANOVA with Sidak’s multiple comparisons test for k, l and nr; Kaplan-Meier analysis with the log-rank test for m and s. Source data are provided as a Source Data file.
Fig. 3
Fig. 3. MBTPS1 depletion increases CD8+ T cell infiltration into the TME.
a Bar plots indicating the proportion of major cell lineages in each group. b Uniform manifold approximation and projection (UMAP) projection of 2340 lymphocytes from the shVec/shMbtps1 MC38 tumor groups, respectively. c Bar plots indicating the proportion of T cell lineages in each group. d, e The number and percentage of CD8+ T cells in shVec/shMbtps1 MC38 (d) or CT26 (e) tumors analyzed by flow cytometry. f, g The percentage of IFN-γ+CD8+ T cells in shVec/shMbtps1 MC38 (f) or CT26 (g) tumors analyzed by flow cytometry. h The percentage of Ki67+CD8+ T cells in shVec/shMbtps1 CT26 tumors analyzed by flow cytometry. i The number or percentage of CD4+ T cells in shVec/shMbtps1 MC38 or CT26 tumors analyzed by flow cytometry. j The percentage of NK cells in shVec or shMbtps1 MC38 tumors analyzed by flow cytometry. k Flow cytometric analysis of the percentage of CD8+ T cells and IFN-γ+CD8+ T cells in female C57 mice (6-8 weeks old) with shVec/shMbtps1 MC38 tumors treated with αPD-1 or isotype control. l The percentage and number of CD8+ T cells in OEVec or OEMbtps1 MC38 tumors analyzed by flow cytometry. m Statistical analysis of IHC stained CD8+ T cells in OEVec/OEMbtps1 E0771 tumors. n, o Representative IHC staining images (n) and statistical analysis (o) of CD8+ T cells in MC38 tumors for the indicated groups. Scale bar, 50 μm. p Growth curves of shVec/shMbtps1 MC38 tumors in C57 mice treated with CD8 neutralizing antibody or isotype control. n = 5 mice per group in d, f, (i, left) and j; n = 6 mice in e, g, h, (i, right), km, o and p. Data are presented as means ± SDs. Two-tailed unpaired Student’s t-test for dj, l and m; one-way ANOVA with Sidak’s multiple comparisons test for k, o and p. Source data are provided as a Source Data file.
Fig. 4
Fig. 4. MBTPS1 interacts with STAT1 and blocks chemokine gene transcription.
a, b Growth curves of MC38 tumors with indicated gene knockdown in female C57 mice (6-8 weeks old). c Growth curves of shVec, shMbtps1 and shSrebf2 E0771 tumors in C57 mice subjected to CD or HCD feeding. d Growth curves of MC38 tumors from the indicated groups. e GSEA of chemokine pathway in shMbtps1 vs. shVec MC38 tumors. f qPCR analysis of Cxcl9, Cxcl10 and Cxcl11 mRNA in MC38 cells. gi ELISA detection of CXCL10 in the culture medium. j qPCR analysis of Cxcl10 mRNA in tumors from the indicated groups. k Number of CFSE-labeled CD8+ T cells migrated into the lower chamber when co-incubated with culture medium of MC38 cells. l qPCR analysis of Cxcr3 mRNA of tumors from the indicated groups. m Percentage of CXCR3+ cells in CD8+ T cells in CT26 tumors. n, o Representative images of immunofluorescence assay showing the staining of CXCR3 (red), CD8 (green) and nuclei (blue) (n) and quantification of CXCR3+CD8+ T cells per high power field (o) in MC38 tumors. White arrows indicate CXCR3+CD8+ T cells. Scale bar, 50 μm. p Percentages of IFN-γ positive and Ki67 positive cells in CXCR3 positive/negative CD8+ T cells. q Growth curves of MC38 tumors in anti-PD-1 treated C57 mice. r ELISA detection of CXCL10 in the tumor interstitial fluid of MC38 tumors. s Growth curves of shVec/shMbtps1 MC38 tumors in CXCR3 neutralizing antibody treated C57 mice. t, u Representative images (t) and quantification (u) of IHC stained CD8+ T cells in MC38 tumors. Yellow arrows indicate CD8-positive cells. Scale bar: 50 μm. n = 6 mice per group in ad, m, o and qu; n = 5 mice per group in j and l; n = 18 mice per group in p. n = 3 biologically independent samples per group, representative of three independent experiments with similar results in fi and k. Data are presented as means ± SDs. Two-tailed unpaired Student’s t-test for a, b, fh, k, m and n; one-way ANOVA with Sidak’s multiple comparisons test for c, d, i, j, l, q-s and u; two-tailed paired Student’s t-test for p. Source data are provided as a Source Data file.
Fig. 5
Fig. 5. MBTPS1 interacts with STAT1 and blocks chemokine gene transcription.
a, b Chromatin immunoprecipitation (ChIP)-PCR (a) and ChIP-qPCR (b) analysis of the interaction between STAT1 and the Cxcl9/10/11 promoter regions in MC38 cells. c Co-IP of endogenous STAT1 with endogenous MBTPS1 in MC38 and 293T cells. d Co-IP of FLAG-tagged MBTPS1 with endogenous STAT1 in MC38 and 293T cells. e Representative image of in situ PLA assay of anti-mouse FLAG and anti-rabbit STAT1 in MC38 cells transfected with Flag-MBTPS1. Scale bar: 10 μm. f Dual-luciferase reporter assay in MBTPS1-knockdown or control 293T cells transfected with the STAT1 promoter reporter. g, h ChIP-PCR (g) and ChIP-qPCR (h) analysis of the interaction between STAT1 and the Cxcl9/10/11 promoter regions in MC38 cells with Mbtps1 knockdown. i ChIP-qPCR analysis of the interaction between STAT1 and the Cxcl9/10/11 promoter regions in MC38 cells with Mbtps1 overexpression. n = 3 biologically independent samples per group, representative of three independent experiments with similar results in b, e, f, h and i. ChIP-PCR in a and g and IB experiments in c and d were repeated three times with similar results using biologically independent samples. Data are presented as means ± SDs. Two-tailed unpaired Student’s t-test for a, b, f, h, and i. Source data are provided as a Source Data file.
Fig. 6
Fig. 6. MBTPS1 promotes CD8+ T cell-mediated anti-tumor immunity by regulating STAT1 expression.
a IB detection of STAT1 expression in MC38 and E0771 cells after Mbtps1 knockdown. β-Actin was included as a loading control. b IB detection of STAT1 expression in MC38 or E0771 cells with Mbtps1 overexpression and Mbtps1 knockdown followed by its expression restoration. β-Actin was included as a loading control. c IB detection of STAT1 expression in MC38 or E0771 cells with overexpression of wild-type Mbtps1 or S414A Mbtps1. β-Actin was included as a loading control. d, e IB detection of STAT1 and phospho-STAT1 (Ser701) expression in MC38 cells with Mbtps1 knockdown (d) or overexpression (e) followed by IFN-γ stimulation (10 ng/ml, 24 h). β-Actin was included as a loading control. f Statistical analysis of IHC stained STAT1 in MC38 tumors with Mbtps1 knockdown. g Representative immunofluorescence staining images of STAT1 and analysis of its mean fluorescence intensity. Scale bar: 10 μm. h qPCR analysis of Cxcl10 expression in MC38 cells with indicated treatment. i qPCR analysis of Cxcl10 expression in E0771 cells with Mbtps1 knockdown followed by fludarabine (STAT1 inhibitor, 5 μM, 24 h) treatment. j, k Growth curves (j) and weight analysis (k) of E0771 tumors with Mbtps1 knockdown, Stat1 knockdown or Mbtps1/Stat1 double knockdown in female C57 mice (6-8 weeks old). ln Flow cytometric analysis of the number of CD8+ T cells (l), IFN-γ+CD8+ T cells (m) and GZMB+CD8+ T cells (n) in E0771 tumors from the indicated groups. o, p Representative histogram image (o) and mean fluorescence intensity (MFI) (p) of H-2Kb on the cell surface after Mbtps1 knockdown. q MFI of H-2Kb after Mbtps1 and Stat1 knockdown analyzed by flow cytometry. n = 6 mice per group in j-n. n = 3 biologically independent samples per group, representative of three independent experiments with similar results in g, h, I and oq. IB experiments in ae were repeated three times with similar results using biologically independent samples. Data are presented as means ± SDs. Two-tailed unpaired Student’s t-test for f, g, and p; one-way ANOVA with Sidak’s multiple comparisons test for hn and q. Source data are provided as a Source Data file.
Fig. 7
Fig. 7. MBTPS1 disrupts the stability of STAT1 by competing with USP13 for binding to STAT1.
a, b IB detection of STAT1 in MC38 cells with Mbtps1 knockdown followed by CHX treatment (5 μg/ml) (a) and by MG132 treatment (10 μM, 6 h) (b). β-Actin was included as a loading control. c Co-IP analysis of the interaction between FLAG-STAT1 and endogenous ubiquitin in the indicated cells pretreated with MG132 (10 μM, 6 h). d Co-IP analysis of the interaction between FLAG-STAT1 and endogenous USP13 in MC38 and 293T cells. e Co-IP analysis of the interaction between FLAG-MBTPS1 and endogenous USP13 in MC38 cells. f Co-IP analysis of the interaction between FLAG-STAT1 and endogenous USP13 in MC38 and E0771 cells with Mbtps1 overexpression. g, h Co-IP analysis of USP13 (g) and MBTPS1 (h) interactions with wild-type or SH2 domain-deleted FLAG-STAT1 in MC38 cells. i Co-IP analysis of the interaction between FLAG-STAT1 and endogenous ubiquitin in MC38 and E0771 cells pretreated with MG132 (10 μM, 12 h) in the indicated groups. j IB analysis of STAT1 expression in E0771 cells overexpressing Mbtps1, Usp13, or both, followed by treatment with CHX (5 μg/ml). β-Actin was included as a loading control. k IB detection of STAT1 expression in E0771 cells with overexpressing Mbtps1 alone, overexpressing Usp13 alone, and overexpressing Mbtps1 and Usp13 simultaneously. β-Actin was included as a loading control. l, m Growth curves (l) and weight analysis (m) of E0771 tumors implanted in female C57 mice (6-8 weeks old) with Mbtps1 overexpression alone or both Mbtps1 and Usp13 overexpression. n Growth curves of MC38 tumors implanted in C57 mice with knockdown of Mbtps1 alone, knockdown of Usp13 alone, and simultaneous knockdown of both Mbtps1 and Usp13. n = 6 mice per group in ln. IB experiments in ak were repeated three times with similar results using biologically independent samples. Data are presented as means ± SDs. One-way ANOVA with Sidak’s multiple comparisons test for ln. Source data are provided as a Source Data file.
Fig. 8
Fig. 8. MBTPS1 drives tumor development and serves as a marker of unfavorable prognosis.
a Representative images and quantification of intestinal tumors in female Mbtps1fl/fl, cre-/- (control) mice and Mbtps1fl/fl, cre+/- (Mbtps1iKO) mice (6-10 weeks old). Black arrows indicate intestinal tumors. Scale bar: 1 cm. b IHC staining of CD8 in intestinal tumors from control and Mbtps1iKO mice. Yellow arrows indicate CD8-positive cells. Scale bar: 1 mm (1×); 50 μm (40×). c IHC staining of STAT1 and p-STAT1 in intestinal tumors from control and Mbtps1iKO mice. Scale bar: 1 mm (1×); 50 μm (40×). d Representative images of colonoscopy and intestinal dissection of control and Mbtps1iKO mice. Arrows indicate intestinal tumors. e, f Number (e) and total surface area (f) of the intestinal tumors in anti-PD-1 treated control and Mbtps1iKO mice. g-k Percentage of CD8+ T cells (g), number of CD8+ T cells (h), percentages of IFN-γ+CD8+ T cells (i) and CXCR3+CD8+ T cells (j), and number of CXCR3+CD8+ T cells (k) in intestinal tumors from the indicated groups. l Number of intestinal tumors from female WT-ApcMin/+ and Mbtps1iKO-ApcMin/+ mice (17 weeks old at the endpoint). m OS and DFS based on MBTPS1 expression (SYSUCC cohort). n OS based on STAT1 expression (SYSUCC cohort). o IHC staining of the indicated markers in CRC tumor tissues from patients with high or low MBTPS1 levels. Yellow arrows indicate CD8-positive cells. Scale bar: 50 μm. p, q Percentages of tumor tissues exhibiting high or low expression of STAT1 and CD8 (p), as well as the percentage exhibiting either proficient mismatch repair (pMMR) or defective mismatch repair (dMMR) (q), was presented for the groups with low and high MBTPS1 expression, respectively. n = 6 mice per group in ac and l; n = 8 mice per group in dk. The data in a, b, el were presented as means ± SDs and the data in p, q were presented as the percentage of total samples. For a, b, and l data, two-tailed unpaired Student’s t-test. One-way ANOVA with Sidak’s multiple comparisons test for ek data; Kaplan-Meier analysis with the log-rank test for m and n; two-sided Pearson’s correlation analysis and chi-square (and Fisher’s exact) test for p, q. Source data are provided as a Source Data file.

References

    1. Sung, H. et al. Global Cancer Statistics 2020: GLOBOCAN estimates of incidence and mortality worldwide for 36 cancers in 185 countries. CA Cancer J. Clin.71, 209–249 (2021). - PubMed
    1. Weng, J. et al. Exploring immunotherapy in colorectal cancer. J. Hemat. Oncol.15, 10.1186/s13045-022-01294-4 (2022). - PMC - PubMed
    1. André, T. et al. Pembrolizumab in microsatellite-instability–high advanced colorectal cancer. N. Engl. J. Med.383, 2207–2218 (2020). - PubMed
    1. Tolba, M. F. Revolutionizing the landscape of colorectal cancer treatment: The potential role of immune checkpoint inhibitors. Int. J. Cancer147, 2996–3006 (2020). - PubMed
    1. Yang, K., Halima, A. & Chan, T. A. Antigen presentation in cancer - mechanisms and clinical implications for immunotherapy. Nat. Rev. Clin. Oncol.20, 604–623 (2023). - PubMed

MeSH terms

Substances