. 2025 Apr 30;15(1):15138.
doi: 10.1038/s41598-025-99315-y.

Genome-wide identification of the TIFY gene family in Helianthus annuus and expression analysis in response to drought and salt stresses

Affiliations

Genome-wide identification of the TIFY gene family in Helianthus annuus and expression analysis in response to drought and salt stresses

Kangping Zhang et al. Sci Rep. .

Abstract

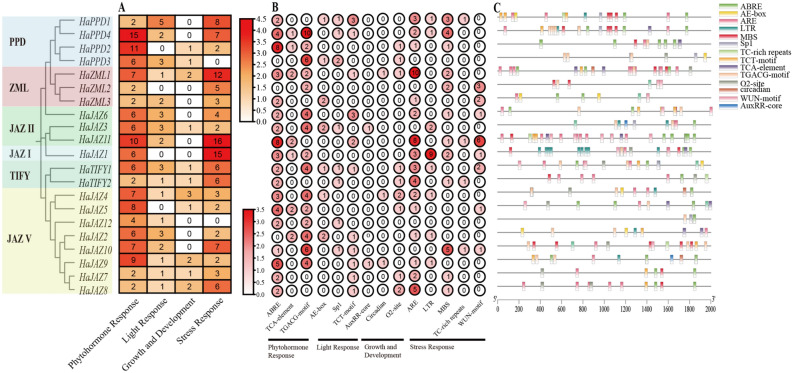
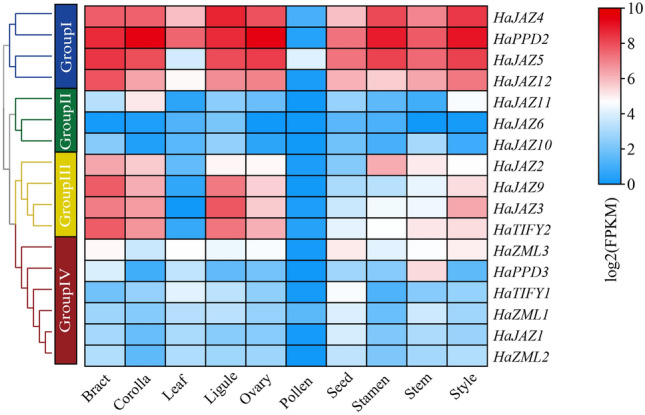
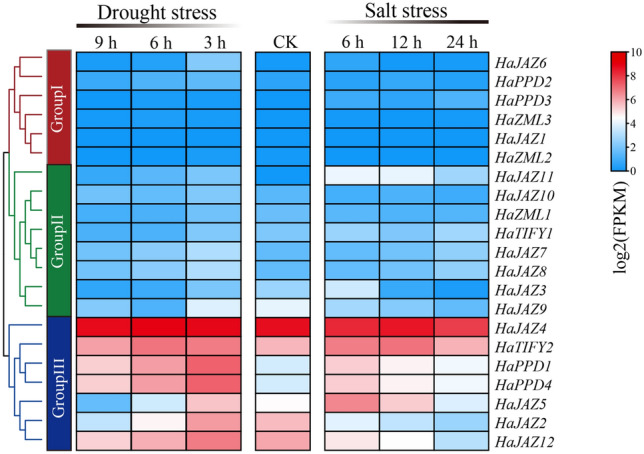
Given the increasing recognition of frequent drought problems associated with global warming, sunflower (Helianthus annuus L.) has been widely studied as a model plant tolerant to drought and salt stresses. However, there is a lack of information on the systematic identification of the sunflower HaTIFY gene family. In the present study, 21 HaTIFY genes in sunflower were identified and the members of HaTIFY family were divided into four subfamilies, i.e., TIFY, JAZ, ZML and PPD. Gene duplication is a major driver for the expansion of the gene family. Here, three segmental and two tandem duplicated gene pairs were identified via duplication and synteny analysis. Furthermore, five paralogous TIFY gene pairs might have undergone purifying selective pressure during evolution based on Ka/Ks ratio. HaJAZ2/4/5/9/12 from JAZ V subfamily were highly expressed in the majority of tissues. In the analysis of promoter elements of HaTIFYs, more than half of 21 HaTIFY genes contained the drought induction elements. Notably, HaPPD1 and HaPPD4 were significantly upregulated at the early stages of both drought and salt treatments, highlighting their potential roles in enhancing sunflower resistance to abiotic stresses. In conclusion, the HaTIFY gene family plays a crucial role in the positive regulation of sunflower's response to abiotic stresses, offering key candidate genes for enhancing resistance in sunflower breeding programs.

Keywords: Helianthus annuus L.; TIFY genes; Abiotic stress; Bioinformatics; Expression profiles.


Conflict of interest statement

Declarations. Competing interests: The authors declare no competing interests.

Figures

Fig. 1
Fig. 1
Phylogenetic analysis of TIFY proteins from Helianthus annuus (Ha), Arabidopsis thaliana (At), Oryza sativa (Os). Neighbor-Joining phylogeny of 59 TIFY proteins of the three species, was determined by MEGA 7.0 program with 1000 bootstrap replicates.
Fig. 2
Fig. 2
Phylogenetic relationships, gene structure and motifs of HaTIFYs in Helianthus annuus. (A) The exon–intron structure of HaTIFYs. (B) Distribution of the conserved motifs in HaTIFY proteins. The scale bar indicates 2000 aa. (C) The sequences of TIFY and Jas domains.
Fig. 3
Fig. 3
Prediction of cis-acting elements in HaTIFYs promoters. (A) Each HaTIFY contains the number of cis-acting elements detected which were divided four types. (B) The number of different elements of each HaTIFY gene in four types of elements. (C) Visualization of four types of elements in HaTIFYs promoters by TBtools, including position, kind and quantity of elements.
Fig. 4
Fig. 4
Interaction network of TIFY proteins in sunflower. The green lines represent the interaction between COI1 and HaTIFY proteins; and the blue lines represent the interaction between MYC2 and HaTIFY proteins. The network was constructed using the STRING tool and Cytoscape, and confidence score is 0.4.
Fig. 5
Fig. 5
Expression profiles of HaTIFY genes in different tissues and organs. The normalized log2(FPKM) was used to create a heatmap. The indicator ranges in the upper right corner represent the range of the values after normalization. Detailed information is showed in Table S2.
Fig. 6
Fig. 6
Expression patterns of HaTIFY genes following 200 mM NaCl and 15% PEG6000 treatments at different times. The normalized log2(FPKM) was used to create a heatmap. The indicator ranges in the upper right corner represent the range of the values after normalization. Detailed information is showed in Table S3.
Fig. 7
Fig. 7
qRT-PCR analysis of differences in HaTIFYs expression levels under drought (A) and salt (B) stresses. (A) CK, D3, D6 and D9 represent the expression levels of HaTIFYs at 0, 3, 6 and 9 h under drought stress condition in X-axis; (B) CK, S6, S12 and S24 represent in 0, 6, 12 and 24 h exposed to salt treatment. Statistically significant differences were analyzed by Duncan’s multiple-range test. Different lowercase letters above the bars indicate a significant difference between these treatments (p < 0.05).

Similar articles

Cited by

References

    1. Li, W. et al. A salt tolerance evaluation method for sunflower (Helianthusannuus L.) at the seed germination stage. Sci. Rep.10, 10626 (2020). - PMC - PubMed
    1. Khalifani, S. et al. Comparison of influential input variables in the deep learning modeling of sunflower grain yields under normal and drought stress conditions. Field Crops Res.303, 109145 (2023).
    1. Liu, A. et al. Phylogenetic analysis and transcriptional profiling of WRKY genes in sunflower (Helianthusannuus L.): Genetic diversity and their responses to different biotic and abiotic stresses. Ind. Crops Prod.148, 112268 (2020).
    1. Li, L. et al. Genome-wide identification of the TIFY family in Salvia miltiorrhiza reveals that SmJAZ3 interacts with SmWD40-170, a relevant protein that modulates secondary metabolism and development. Front. Plant Sci.18, 630424 (2021). - PMC - PubMed
    1. Song, H. et al. Phylogenetic analysis and expression profiles of jasmonate ZIM-domain gene family provide insight into abiotic stress resistance in sunflower. Front. Plant Sci.13, 1010404 (2022). - PMC - PubMed

LinkOut - more resources