. 2025 Apr 30;15(1):15189.
doi: 10.1038/s41598-025-94259-9.

Global burden of female infertility attributable to sexually transmitted infections and maternal sepsis: 1990-2021 and projections to 2050

Affiliations

Global burden of female infertility attributable to sexually transmitted infections and maternal sepsis: 1990-2021 and projections to 2050

Jianbo Wei et al. Sci Rep. .

Abstract

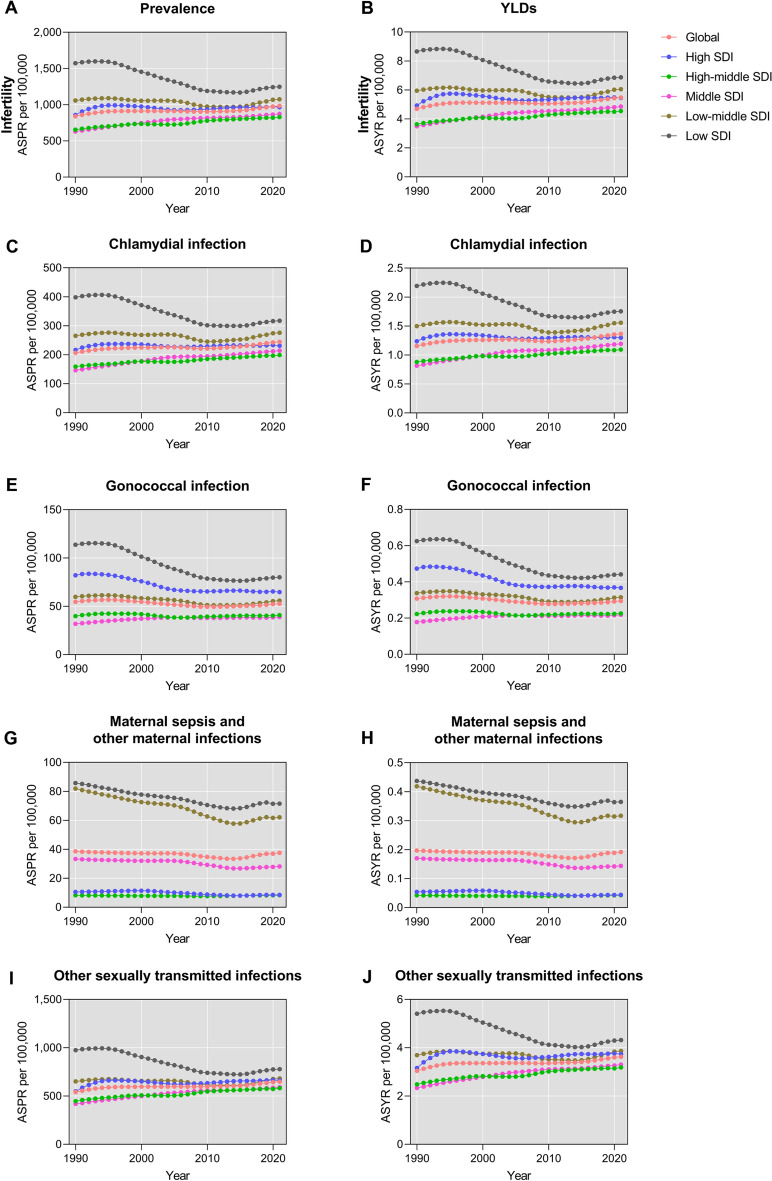
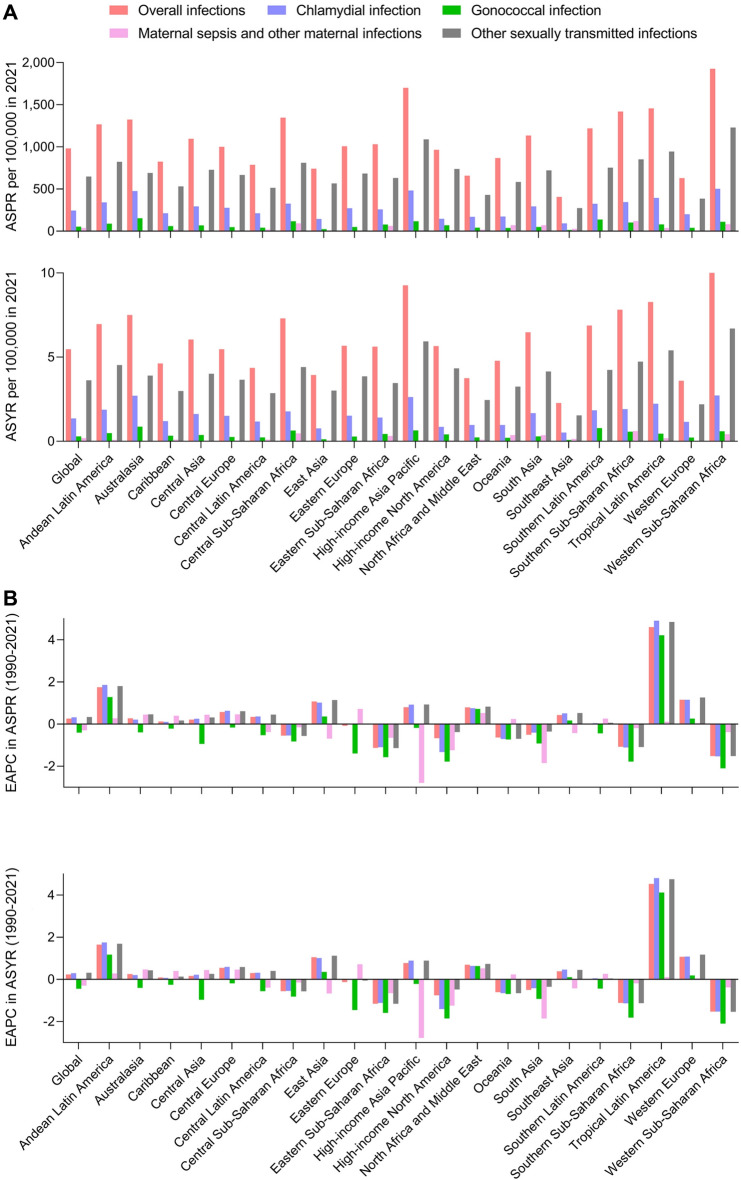
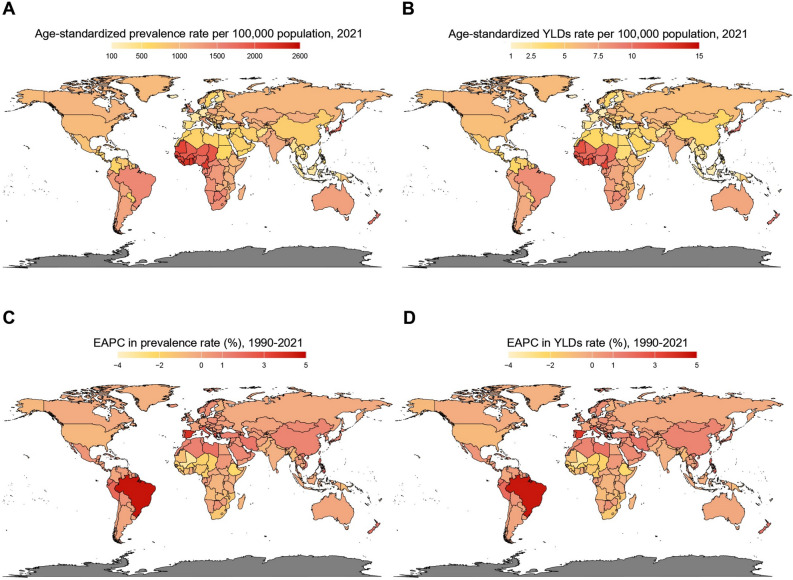
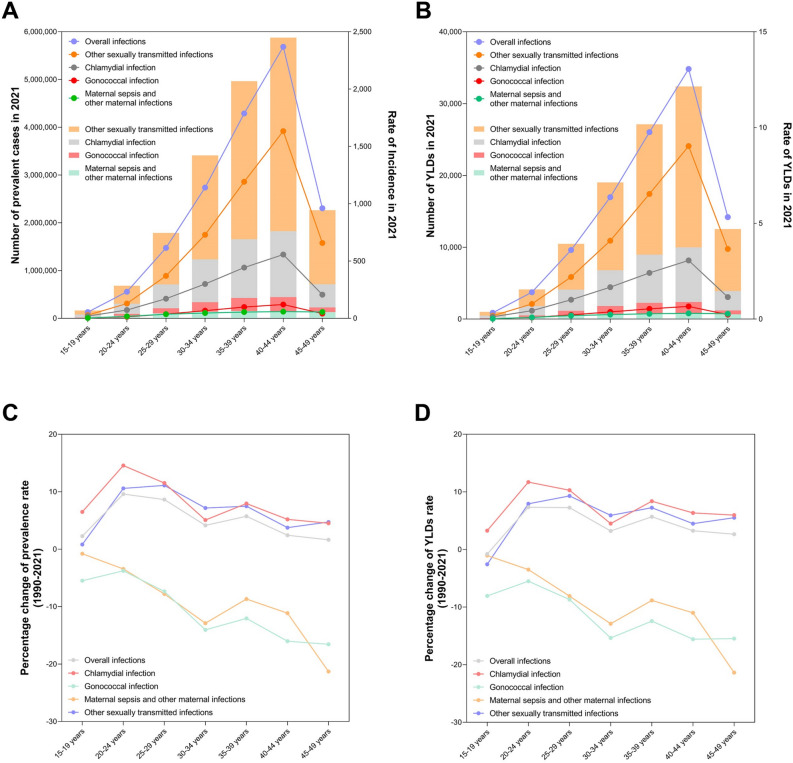
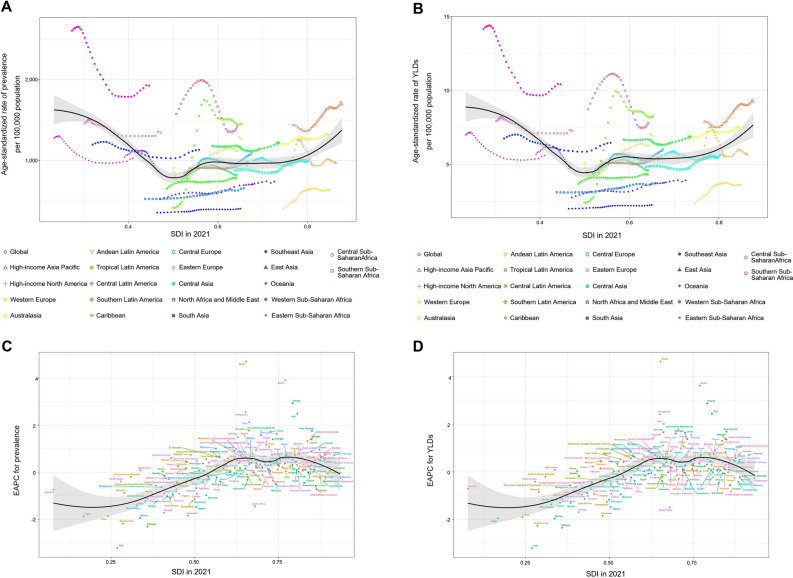
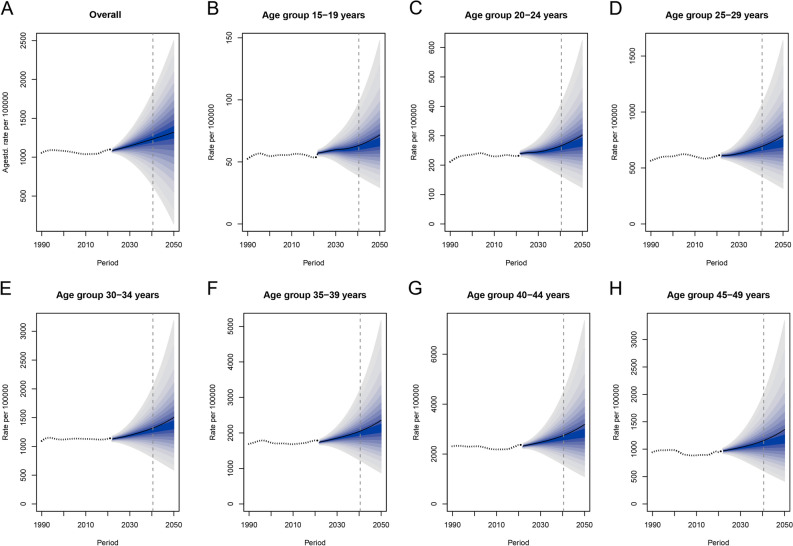
Infectious diseases, such as sexually transmitted infections (STIs) and maternal sepsis, are major contributors to female infertility, creating a substantial burden on women of reproductive age. Based on Global Burden of Disease (GBD) 2021, this study analyzed the global trends and regional disparities in infection-related infertility for women aged 15-49 and projected future burdens. Our result showed that from 1990 to 2021, global age-standardized prevalence rate (ASPR) rose from 839.52 to 982.37 per 100,000 with estimated annual percentage change (EAPC) (0.26 [0.19 to 0.33]), and years lived with disability (YLDs) increasing from 62.81 to 106.69 thousand (EAPC 0.23 [0.16 to 0.31]), and was predicted to continue rising from 2022 to 2050. The disease burden showed significant regional disparities, low socio-demographic index (SDI) regions had the highest ASPR (1247.25 per 100,000 [1085.17 to 1443.57]) but also the fastest decline (EAPC -1.17 [-1.34 to -0.99]), and Western Sub-Saharan Africa (ASPR 1,925.52 [1655.35 to 2241.71] per 100,000) are the regions with highest burden. The disease burden increased with age, peaking at 40-44 years, and was inversely associated with SDI. These findings provide essential insights for policymakers to develop targeted strategies to prevent and control infection-related infertility, particularly in low-SDI regions.

Keywords: Global burden of disease; Infections; Infertility; Maternal sepsis; Prevalence; Sexually transmitted infections.


Conflict of interest statement

Declarations. Competing interests: The authors declare no competing interests.

Figures

Fig. 1
Fig. 1
Trends in age-standardized rates of prevalence and YLDs for infertility attributable to infectious causes in women of child-bearing age from 1990 to 2021, by SDI. (A) Prevalence of overall infections, (B) YLDs of overall infections, (C) Prevalence of chlamydial infections, (D) YLDs of chlamydial infections, (E) Prevalence of gonococcal infections, (F) YLDs of gonococcal infections, (G) Prevalence of other STIs, (H) YLDs of other STIs, (I) Prevalence of MSMI, (J) YLDs of MSMI. YLDs, years lived with disability; SDI, socio-demographic index; STIs, other sexually transmitted infections; MSMI, maternal sepsis and other maternal infections.
Fig. 2
Fig. 2
Age-standardized rates of prevalence and YLDs in 2021, with their trends in estimated annual percentage changes for infertility attributable to infectious causes across global and regional levels, from 1990 to 2021. (A) Prevalence and YLDs, (B) EAPC for prevalence and YLDs. Overall infections include Chlamydia infections, Gonococcal infections, STIs, and MSMI. YLDs, years lived with disability; EAPC, estimated annual percentage change; STIs, other sexually transmitted infections; MSMI, maternal sepsis and other maternal infections.
Fig. 3
Fig. 3
National-level age-standardized rates of prevalence and YLDs in 2021 and their trends in estimated annual percentage changes for infertility attributable to infections from 1990 to 2021. World maps show prevalence (A) and YLDs (B) by country in 2021. (C) and (D) show EAPC in prevalence and YLDs, respectively. Overall infections include Chlamydia infections, Gonococcal infections, STIs, and MSMI. YLDs, years lived with disability; EAPC, estimated annual percentage change; STIs, other sexually transmitted infections; MSMI, maternal sepsis and other maternal infections.
Fig. 4
Fig. 4
Cross-sectional and longitudinal trends of prevalence and YLDs in 2021 for Infertility attributable to infections across reproductive age groups. (A) the number and incidence rates of prevalent cases in 2021, (B) the number and rates of YLDs for the same year. (C) percentage changes in prevalence rates from 1990 to 2021. (D) percentage changes in YLDs rates from 1990 to 2021. Overall infections include Chlamydia infections, Gonococcal infections, STIs, and MSMI. YLDs, years lived with disability; STIs, other sexually transmitted infections; MSMI, maternal sepsis and other maternal infections.
Fig. 5
Fig. 5
Correlation between SDI in 2021 and prevalence and YLDs for infertility attributable to overall infections. (A) Age-standardized rates of prevalence, globally and for 21 GBD regions. (B) Age-standardized rates of YLDs, globally and for 21 GBD regions. (C) EAPCs of prevalence for 204 counties. (D) EAPCs of YLDs for 204 counties. Expected values with 95% CI, based on SDI and disease rates in all locations, are shown as a solid line and shaded area. Points are plotted for each region and show the observed age-standardized incidence or YLDs rates for each year from 1990 to 2021. Overall infections include Chlamydia infections, Gonococcal infections, STIs, and MSMI. YLDs, years lived with disability; GBD, Global Burden of Diseases, Injuries and Risk Factors Study; STIs, other sexually transmitted infections; MSMI, maternal sepsis and other maternal infections; SDI, socio-demographic index.
Fig. 6
Fig. 6
BAPC model projections of age-standardized rates of infertility attributable to overall infections from 2022 to 2050, by age groups. (A) Predicted age-standardized incidence of infertility attributable to infections in age 15–49. (B) Predicted age-standardized incidence in age group 15–19 years. (C) Predicted age-standardized incidence in age group 20–24 years. (D) Predicted age-standardized incidence in age group 25–29 years. (E) Predicted age-standardized incidence in age group 30–34 years. (E) Predicted age-standardized incidence in age group 35–39 years. (E) Predicted age-standardized incidence in age group 40–44 years. (E) Predicted age-standardized incidence in age group 45–49 years. Agestd, age standard.

Similar articles

References

    1. Yee, L. M., Miller, E. C. & Greenland, P. Mitigating the Long-term Health Risks of Adverse Pregnancy Outcomes. JAMA327, 421–422. 10.1001/jama.2021.23870 (2022). - PubMed
    1. Yu, J. et al. Burden of female infertility in China from 1990 to 2019: a temporal trend analysis and forecasting, and comparison with the global level. Sex Health20, 577–584. 10.1071/SH23029 (2023). - PubMed
    1. Wang, Y., Wang, W., Li, H. & Du, Q. Trends in the burden of female infertility among adults aged 20–49 years during 1990–2019: an analysis of data from the Global Burden of Disease Study 2019. BMJ Open14, e084755. 10.1136/bmjopen-2024-084755 (2024). - PMC - PubMed
    1. Mielczarek, E. & Blaszkowska, J. Trichomonas vaginalis: pathogenicity and potential role in human reproductive failure. Infection44, 447–458. 10.1007/s15010-015-0860-0 (2016). - PubMed
    1. Zheng, X. et al. Host Genetic Risk Factors for Chlamydia trachomatis-Related Infertility in Women. J Infect Dis224, S64–S71. 10.1093/infdis/jiab149 (2021). - PMC - PubMed

LinkOut - more resources