. 2025 May;28(5):964-972.
doi: 10.1038/s41593-025-01936-z. Epub 2025 Apr 30.

Single-cell genotyping and transcriptomic profiling of mosaic focal cortical dysplasia

Affiliations

Single-cell genotyping and transcriptomic profiling of mosaic focal cortical dysplasia

Sara Baldassari et al. Nat Neurosci. 2025 May.

Abstract

Focal cortical dysplasia type II (FCDII) is a cortical malformation causing refractory epilepsy. FCDII arises from developmental somatic activating mutations in mTOR pathway genes, leading to focal cortical dyslamination and abnormal cytomegalic cells. Which cell types carry pathogenic mutations and how they affect cell-type-specific transcriptional programs remain unknown. In the present study, we combined several single-nucleus genotyping and transcriptomics approaches with spatial resolution in surgical cortical specimens from patients with genetically mosaic FCDII. Mutations were detected in distinct cell types, including glutamatergic neurons and astrocytes, and a small fraction of mutated cells exhibited cytomegalic features. Moreover, we identified cell-type-specific transcriptional dysregulations in both mutated and nonmutated FCDII cells, including synapse- and neurodevelopment-related pathways, that may account for epilepsy and dysregulation of mitochondrial metabolism pathways in cytomegalic cells. Together, these findings reveal cell-autonomous and non-cell-autonomous features of FCDII that may be leveraged for precision medicine.


Conflict of interest statement

Competing interests: The authors declare no competing interests.

Figures

Fig. 1
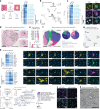
Fig. 1. Cell-type-specific dysregulation of synapse and neurodevelopmental pathways in FCDII.
a, Study workflow. SnRNA-seq was employed to identify transcriptional changes related to epilepsy in FCDII tissues. Genotyping on mutation sites was used to compare Mut. nuclei, which carried the somatic mutation, and Ref. nuclei, where only the reference allele was detected. Integration with spatial resolution linked transcriptional changes to cellular morphology and spatial disorganization. b, Patient cohort overview: ten patients with FCDII (pt1–10) and mTOR pathway mutations in MTOR, DEPDC5 (mTOR repressor) and RHEB (mTOR activator). Dysplastic areas in pt1, -4 and -9 extended to an entire hemisphere, with pt4 and -9 diagnosed with hemimegalencephaly. N/A, not available (no somatic hit identified). c, Left, UMAP of integrated patients and controls, snRNA-seq data with cell-type annotations from a previous study (Methods). Dashed lines outline cluster densities. Right, cell-type proportions across controls and patients with focal or hemispherical dysplasia. d, UMAP visualization showing overlapping cell types between control and patient nuclei, with a subset of GluNs enriched in pt8 and pt9. e, Cell-type-specific differential gene expression analysis between focal FCDII and controls. Left, number of DEGs per cell type (significant genes expressed in at least 25% of cells with absolute log2(FC) > 0.4). Middle, specific and shared DEGs across cell types; examples of DEGs specific to one cell type are indicated. Right, proportion of DEGs specific to one or more cell types. f, Top significant GOs and genes downregulated in FCDII GluNs. CC, corticocortical projection neurons; L, layer.
Fig. 2
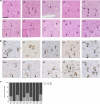
Fig. 2. Mutated cells are detected in various cell types and only occasionally exhibit a cytomegalic phenotype.
a, Distribution of 808 genotyped nuclei in UMAP space: 117 were classified as Mut. (pt10 = 89, pt9 = 25, pt7 = 2, pt6 = 1) or as Ref. Right, Mut. nuclei percentages per cell type (top) and across cell types (bottom). b, Representative images of co-immunofluorescence staining on formalin-fixed paraffin-embedded sections (n = 1 per patient) showing mTOR-hyperactive (pS6+) neurons (NEUN+, pt2), astrocytes (GFAP+, pt2), oligodendrocytes (OLIG2+, pt2) and microglia (IBA1+, pt10). Nuclei (in blue) are labeled with DAPI. Scale bars, 20 µm. All patients included in this experiment are detailed in Supplementary Table 2. c, Cytomegalic cells representing a minor fraction of mutated cells. Left, representative immunostaining of SMI311+ DNs and VIM+ BCs on frozen brain tissue from pt5. Nuclei (in blue) are labeled with DAPI for total cell counting. Scale bar, 25 µm. Right, mutated cell percentage (inferred by the detected VAF) and proportion of DNs or BCs identified in each patient (n = 1 section/patient/staining was analyzed). d, Schematic of the distribution of mutated cells across cell types and the fraction of mutated cytomegalic cells in pt10. Astro, astrocytes; Endo, endothelial cells; Hemi, hemispherical; Oligo, oligodendrocytes; Micro, microglia.
Fig. 3
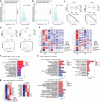
Fig. 3. Cell-type-specific transcriptional dysregulation in FCDII mutated cells.
a,b, Cell-type-specific differential gene expression analysis between Mut. and Ref. nuclei from pt9 and pt10 (providing the highest numbers of genotyped nuclei). a, Absolute average log2(FC) values for dysregulated genes belonging to the mTOR pathway (KEGG database) across cell types. b, Top left, dysregulated gene counts per cell type (expressed in 25% of cells with absolute log2(FC) > 0.3). Top right, specific and shared dysregulated genes across cell types. Bottom, proportion of dysregulated genes specific to one or more cell types. c,d, Top GO terms (based on Padj values) in Mut. versus Ref. GluNs from patients (c) and in Ref. GluNs from patients (pt9 and pt10) versus age-matched GluNs from control samples (ct1 and ct2) (d). e, Schematic showing cell-autonomous metabolic alterations and non-cell-autonomous synaptic activity changes in FCDII. oxid., oxidation.
Fig. 4
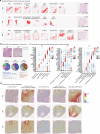
Fig. 4. DNs and BCs belong to glutamatergic and astroglial lineages and display metabolic dysregulations.
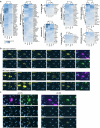
a, Left, LCM–seq workflow for capturing pools of DNs, BCs and NNs from eight patients (pt1–5 and pt7–9). Right, heatmap of NEFM and VIM normalized expression with unsupervised hierarchical clustering. b, Label transfer of LCM–seq samples on to the snRNA-seq UMAP space showing NNs or DNs matching with GluNs and BCs with astrocytes. c, Left, NRGN and GFAP normalized expression heatmap with unsupervised hierarchical clustering. Right, co-immunofluorescence showing NRGN in pS6+/SMI311+ DNs and GFAP in pS6+/VIM+ BCs (pt5) (n = 1 section/patient/staining analyzed). GFAP-pS6 and VIM-pS6 double stainings were performed on two consecutive sections and the same BC was recognized in both sections. Nuclei (in blue) are labeled with DAPI. Scale bars, 50 µm. d, Visium spatial transcriptomics showing intermingled spots containing DNs and BCs across the tissue (pt5). Magnified images show representative DN- and BC-containing spots after hematoxylin and eosin staining (n = 1 section per patient analyzed). Scale bars, 1.5 mm; insets = 55 µm. e, Top markers of DN- and BC-containing spots (pt5). Known histological markers for DNs (NEFM) and BCs (CRYAB) are enriched in spots with DNs and BCs. f, Spatial semi-supervised clustering of Visium spots showing clusters enriched in GluNs, astrocytes and oligodendrocytes (pt5) with top marker genes in parentheses. g, Distinct clusters for DNs, BCs, astrocytes (Astros) and GluNs from single cells (pt5 and pt9) of the MERSCOPE UMAP space. h, Heatmap of the top ten DN or BC markers with representative MERSCOPE images (pt5). DNs are identified as pS6+/NEUN+ and BCs as pS6+/NEUN (n = 1 section per patient analyzed). Scale bars, 50 µm. i, Left, number of shared dysregulated genes across Mut. versus Ref. GluNs (snRNA-seq), DNs versus NNs (LCM–seq) and DN-containing spots (Visium). Right, top GO terms of DN upregulated genes. Ribo-nt., ribonucleotides; metab., metabolic; proc., process; Ribo-ns., ribonucleosides; RP., ribosomal proteins; rNTP, ribonucleoside triphosphates. j, Representative images of strong VDAC1 immunostaining in pS6+ DNs (pt2) (n = 1 section/patient/staining analyzed). Scale bars, 50 µm. k, Electron microscopy of DNs (pt5) showing an accumulation of vesicular, swollen, damaged mitochondria (black circles) (n = 1 section per patient analyzed). Scale bar, 2.5 µm. Detailed sample information for each experiment and analysis is provided in Supplementary Table 2. expr., expression; max., maximum; min., minimum.
Extended Data Fig. 1
Extended Data Fig. 1. Neuropathological characterization of FCDII brain tissues.
a, Representative hematoxylin and eosin (HE) staining of 20μm-thick frozen brain sections showing dysmorphic neurons (DN, empty arrowheads) and balloon cells (BC, filled arrowheads) across FCDII patients (n = 1 section/patient). Scale bar: 100μm. Insets for patients pt6, pt7 and pt10 show a representative BC from distinct cortical regions. b, Immunohistochemical detection of mTOR pathway activation using phosphorylated S6 (pS6-Ser240/244) antibody on 4μm-thick formalin-fixed paraffin-embedded (FFPE) brain sections (n = 1 section/patient). DN (empty arrowheads) and BC (filled arrowheads) exhibit strong pS6 immunoreactivity. Scale bar: 50μm. Insets for patients pt7-9 show representative DN from distinct cortical regions. c, Quantification of grey and white matter proportions in 20μm-thick HE-stained frozen brain sections adjacent to tissue used for single-nucleus RNA sequencing (n = 1 section/patient).
Extended Data Fig. 2
Extended Data Fig. 2. Integration and quality control of single-nucleus RNA-seq (snRNA-seq) data from control and patient brain tissues.
a, UMAP visualization comparing age distribution of subjects between the reference Velmeshev et al. postmortem control dataset (V19, left) and the complete integrated dataset from this study (right). Color gradient indicates subject age in years. b, Relative proportion of major cell types across individual samples. Cell types include glutamatergic neurons (GluN and GluL2-6), GABAergic interneurons (IN-MGE and IN-CGE), glial cells (astrocytes, oligodendrocytes, OPCs) and other cell types (microglia, endothelial cells). Abbreviations: Glu, glutamatergic; N, neurons; L, layer; CC, cortico-cortical projection neurons; IN-MGE/CGE, interneurons originating from the medial/caudal ganglionic eminence; OPC, oligodendrocyte precursor cells. c, Individual UMAP plots showing nucleus distribution for each patient and control. d, Quality metrics for snRNA-seq data across cell types and individuals: total count of unique molecular identifiers (UMIs) per nucleus (N counts), mean number of unique genes (N genes) detected per nucleus and percentage (%) of transcripts from mitochondrial genes.
Extended Data Fig. 3
Extended Data Fig. 3. Cell-type-specific DEGs in focal FCDII patients.
a, Quantitative assessment of differentially expressed genes (DEGs) between patients and controls (log2(FC) > 0.4, p-value < 0.05, Fig. 1). Left: Correlation between DEG count and total number of nuclei per cell type. Right: Correlation between DEG count and mean number of genes detected per nucleus in each cell type. Pearson correlation coefficients (R) and p-values are shown. Abbreviations: Astro, astrocytes; Glu, glutamatergic; N, neurons; L, layer; IN-MGE/CGE, interneurons originating from the medial/caudal ganglionic eminence; Micro, microglia; Oligo, oligodendrocytes; OPC, oligodendrocyte precursor cells. b-f, Gene Ontology (GO) pathway analysis of DEGs comparing focal FCDII patients to controls for interneurons (b), glutamatergic neurons (c), astrocytes (d), oligodendrocytes (e) and microglia (f). Top 10 significantly enriched GO terms with adjusted (adj.) p-value < 0.05 are shown per cell type.
Extended Data Fig. 4
Extended Data Fig. 4. Distribution of somatic mutations across cell types in FCDII.
a, Expression analysis of cell-type-specific markers in mutation detected (Mut.) and reference detected (Ref.) nuclei. Dot size represents the proportion of nuclei expressing each marker; color intensity indicates average normalized expression level. Abbreviations: N, neurons; Glut.N, glutamatergic neurons; IN, interneurons; Astro, astrocytes; Oligo, oligodendrocytes; Micro, microglia. b, Fluorescence-activated nuclei sorting (FANS) gating strategy for cell population enrichment. Representative gating from pt9 is shown. Sequential gating begins with initial selection based on DAPI nuclear staining, followed by separation of neuronal (NEUN+) and non-neuronal populations. Cell-type-specific enrichment was then achieved using TBR1 for glutamatergic neurons, PAX6+/NEUN- for astrocytes, OLIG2+/NEUN- for oligodendrocytes, and PU.1 + /NEUN- for microglia. Note: TBR1 subpopulation analysis was only performed for pt9 due to tissue constraints. c, Quantification of somatic mutations across FANS-enriched cell populations was performed using two complementary approaches: ddPCR detection for MTOR and PIK3CA variants, and deep targeted amplicon sequencing (TAS) for the RHEB variant in pt9. Mutation-positive bulk brain DNA and mutation-negative blood DNA served as controls. ddPCR detection limits (LOD) were >3 FAM+ mutated droplets for MTOR, >6 FAM+ mutated droplets for PIK3CA in ddPCR analysis. Results are presented as mean ± SD where technical replication was feasible. Due to limited tissue availability, biological replicates could not be performed, and technical replicates were not possible for specific cell populations in patients pt4 (PAX6+/NEUN- and OLIG2+/NEUN-), pt9 (none), pt12 (PU.1+/NEUN-), and pt14 (PU.1+/NEUN-).
Extended Data Fig. 5
Extended Data Fig. 5. Cell-type-specific transcriptional changes in mutation-carrying cells across FCDII tissues.
a-e, Validation of transcriptional changes (that is genes with absolute log2(FC) > 0.3) between mutation detected (Mut.) and reference detected (Ref.) glutamatergic neurons (GluN) and astrocytes (Astro). Box plots depict the median and interquartile range, with whiskers indicating minimum and maximum values. a-b, Differential expression analysis using 50 random subset comparisons of n = 29 GluN (a) or n = 17 astrocytes (b) amongst Mut. and Ref. nuclei of pt9 and pt10 compared to the rest of GluN and astrocytes, respectively. Left, proportion of shared dysregulated genes in ‘random’ vs ‘observed’ Mut. vs Ref. comparisons. Right, Jaccard similarity index. Wilcoxon signed rank test with continuity correction confirms significant differences between ‘random’ and ‘observed’ dysregulated genes in both GluN and astrocytes. c, Linear regression model using ‘random’ dysregulated genes from iteration n.1 of GluN and Astro cannot predict Mut. vs Ref. nuclei. Box plots depict the median and interquartile range, with whiskers indicating minimum and maximum values. d, Linear regression model using observed dysregulated genes successfully discriminates Mut. from Ref. nuclei for both GluN and Astro, with potential false negatives identified in 14% (1/7) of pt9 and 9% (8/85) of pt10 Ref. GluN nuclei (indicated by black dotted box above red threshold line). Box plots depict the median and interquartile range, with whiskers indicating minimum and maximum values. e, Expression patterns of GluN and Astro ‘observed’ dysregulated genes across patients (pt9-10) and controls (ct1-3). Analysis restricted to samples with >10 Mut./Ref. nuclei. Statistical analysis of average gene expression in Mut. vs. Ref. GluN by individual using Kruskal-Wallis test shows significant mutation effects (genes upregulated in Mut.: H statistics = 340.50, FDR-adjusted p-value: 9.92×10 − 76; genes downregulated in Mut.: H statistics = 30.59, FDR-adjusted p-value: 3.19×10 − 8). No statistical test was performed for astrocytes since only one patient with > 10 Mut. nuclei was available. f, Top 10 GO terms for Mut. vs. Ref. dysregulated genes in astrocytes. g, Mean expression of GluN dysregulated genes between Ref. nuclei from patients vs. controls in Mut., Ref. and control GluN from pt9-10 and ct1-2. Left, all dysregulated genes. Right, epilepsy-related dysregulated genes. h, Top 10 GO terms for patient Ref. vs. control. nuclei dysregulated genes. Only significant GO terms (adjusted p-value < 0.05) are shown.
Extended Data Fig. 6
Extended Data Fig. 6. Laser capture microdissection sequencing (LCM-seq) analysis of FCDII tissues.
a, Hematoxylin and eosin (HE) staining of 20μm-thick frozen sections (n = 1 for each patient) adjacent to those used for laser capture microdissection, showing two distinct gyri where dysmorphic neuron (DN) pools were collected from patients pt2 and pt4. Scale bar = 2.5 mm. b, 2D Principal component analysis (PCA) of LCM-seq samples based on the top 2,000 variable genes comparing normal neurons (NN), dysmorphic neurons (DN) and balloon cells (BC), showing distinct clustering of BC.
Extended Data Fig. 7
Extended Data Fig. 7. Visium spatial transcriptomics of FCDII postoperative brain tissues.
a, Semi-supervised clustering of Visium data from patients pt2, pt5 and pt9. Clusters (highlighted in red) are annotated based on predominant marker genes. To differentiate clusters enriched for the same cell type, the top expressed marker was added to the cluster annotation. Clusters lacking clear cell-type enrichment in pt9 are labeled ‘Unknown’. Abbreviations: N., neurons; IN, interneurons; NF high, cluster with high levels of neurofilament genes; Astro, astrocytes; Oligo, oligodendrocytes; Micro, microglia. On the right: corresponding hematoxylin and eosin (HE) -stained section. Scale bars = 1.5 mm. b, Spatial distribution of DN/BC-containing spots in pt2 and pt9 showing distribution across both anatomical space and transcriptionally-defined clusters. To differentiate clusters enriched for the same cell type, the top discriminating marker expressed was added to the cluster annotation. Scale bars = 1.5 mm. c, Expression analysis of cluster-defining markers in each Visium sample. Dot size indicates percentage of expressing spots; color intensity shows average normalized expression. Abbreviations: Pct. Expr., percentage of spots expressing the genes; Avg. Exprs., average normalized gene expression per group. d, Spatial distribution of cortical layer marker expression scores calculated using previously defined gene sets (Maynard et al., 2021). Higher scores indicate increased expression of the gene set.
Extended Data Fig. 8
Extended Data Fig. 8. MERSCOPE gene panel analysis of FCDII postoperative brain tissues.
a, Heatmaps showing normalized (SCTransform) gene expression levels of the 140-gene MERSCOPE panel, grouped by category. Abbreviations: DN, dysmorphic neurons; BC, balloon cells. b, Representative MERSCOPE images of top expressed genes (from Fig. 4h) in DN (pS6+/NEUN+) and BC (pS6+/NEUN-) from patient pt9 (n = 1 tissue section examined). Yellow puncta indicate individual transcript molecules. Scale bar = 50μm. c, Spatial detection of mitochondrial gene transcripts (yellow puncta) in DN from patients pt5 and pt9 (n = 1 tissue section examined for each patient). Scale bar = 50 μm.
Extended Data Fig. 9
Extended Data Fig. 9. VDAC1 and pS6 co-immunofluorescence in dysmorphic neurons.
a, Co-immunofluorescence analysis of VDAC1 (white) and pS6 (pink) across FCDII specimens (patients pt1-10, n = 1 section/patient). Strong VDAC1 signal is observed in dysmorphic neurons (DN, enlarged pS6+ cells, orange arrowheads), while balloon cells (BC, pS6+ cells with glassy cytoplasm, green arrowheads) display weak VDAC1 signal. Inset in pt8 shows representative BC from distinct region. Scale bar = 100 μm. b, Quantitative comparison of VDAC1 expression between DN-positive and DN-negative regions in pt2. Analysis was performed on 0.25 mm² regions of interest (ROIs, n = 4 per condition), showing percentage of VDAC1+ and pS6+ pixels. Two-sided Wilcoxon rank sum exact p-value = 0.02857*. Box plots show median, interquartile range, and min/max values. c, Quantification of VDAC1 expression between DN-positive and BC-positive regions in pt5-8. Analysis was performed on 0.25 mm2 ROIs (n = 3 per region per patient; total n = 12 per condition). Data shown as percentage of VDAC1+ pixels and pS6+ pixels per ROI. Two-sided Wilcoxon rank sum test, exact p-value = 5.177e-06***. Box plots depict the median and interquartile range, with whiskers indicating minimum and maximum values.
Extended Data Fig. 10
Extended Data Fig. 10. Ultrastructural analysis of FCDII human tissue by electron microscopy.
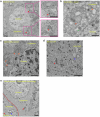
a-e, Pyramidal neurons with normal morphology and abnormal cytomegalic dysmorphic neurons or balloon cells were identified in electron microscopy samples from patients pt4, pt5 and pt7 (n = 1 section/patient). a, Normal pyramidal neuron from pt5 showing mitochondria with typical morphology (red arrowheads). Scale bar = 2μm. b, Dysmorphic neuron (DN) from pt4 displaying structurally damaged swollen mitochondria (orange arrowheads) and lysosomes with heterogenous appearance (green arrowheads). Scale bar = 1μm. c, DN from pt7 displaying structurally damaged swollen mitochondria (orange arrowheads). Scale bar = 1μm. d, Balloon cell (BC) from pt5 characterized by accumulation of normal morphology mitochondria (red arrowheads), vacuoles (blue arrowheads) and cytoplasm filled with intermediate filaments. Scale bar = 2μm. e, Normal mitochondria (red arrowheads) and cytoplasmic accumulation of neurofilaments in a non-cytomegalic neuron with abnormal intermediate phenotype from pt5 adjacent to a BC with normal mitochondria (red arrowheads) and vacuoles (blue arrowheads) in the cytoplasm. Scale bar = 2μm.

References

    1. Evrony, G. D. One brain, many genomes. Science354, 557–558 (2016). - PMC - PubMed
    1. Bae, T. et al. Different mutational rates and mechanisms in human cells at pregastrulation and neurogenesis. Science359, 550–555 (2018). - PMC - PubMed
    1. Rockweiler, N. B. et al. The origins and functional effects of postzygotic mutations throughout the human life span. Science380, eabn7113 (2023). - PMC - PubMed
    1. Lee, J. H. Somatic mutations in disorders with disrupted brain connectivity. Exp. Mol. Med.48, e239–e239 (2016). - PMC - PubMed
    1. Corrigan, R. R., Mashburn-Warren, L. M., Yoon, H. & Bedrosian, T. A. Somatic mosaicism in brain disorders. Annu Rev. Pathol.20, 13–32 (2025). - PubMed

MeSH terms

Supplementary concepts

LinkOut - more resources