. 2025 May;26(5):692-705.
doi: 10.1038/s41590-025-02135-5. Epub 2025 Apr 30.

Identification of soluble biomarkers that associate with distinct manifestations of long COVID

Affiliations

Identification of soluble biomarkers that associate with distinct manifestations of long COVID

Yu Gao et al. Nat Immunol. 2025 May.

Abstract

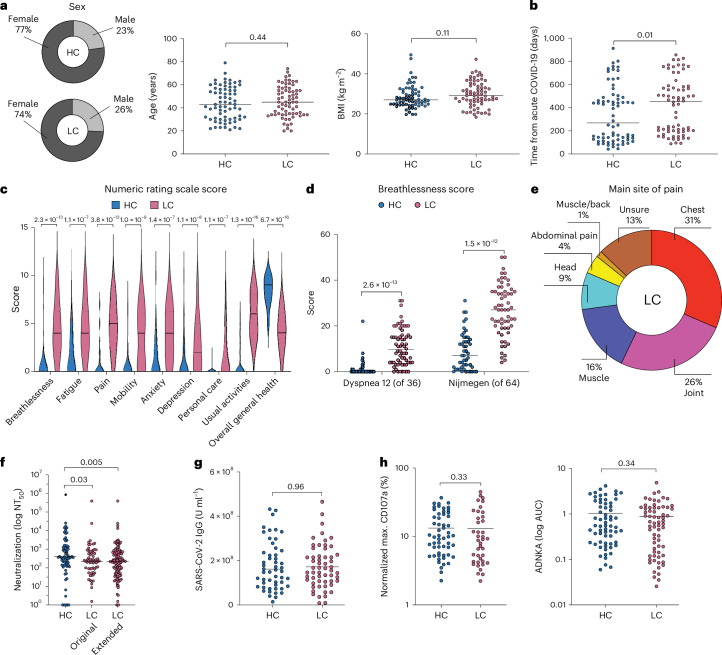
Long coronavirus disease (COVID) is a heterogeneous clinical condition of uncertain etiology triggered by infection with severe acute respiratory syndrome coronavirus 2 (SARS-CoV-2). Here we used ultrasensitive approaches to profile the immune system and the plasma proteome in healthy convalescent individuals and individuals with long COVID, spanning geographically independent cohorts from Sweden and the United Kingdom. Symptomatic disease was not consistently associated with quantitative differences in immune cell lineage composition or antiviral T cell immunity. Healthy convalescent individuals nonetheless exhibited higher titers of neutralizing antibodies against SARS-CoV-2 than individuals with long COVID, and extensive phenotypic analyses revealed a subtle increase in the expression of some co-inhibitory receptors, most notably PD-1 and TIM-3, among SARS-CoV-2 nonspike-specific CD8+ T cells in individuals with long COVID. We further identified a shared plasma biomarker signature of disease linking breathlessness with apoptotic inflammatory networks centered on various proteins, including CCL3, CD40, IKBKG, IL-18 and IRAK1, and dysregulated pathways associated with cell cycle progression, lung injury and platelet activation, which could potentially inform the diagnosis and treatment of long COVID.


Conflict of interest statement

Competing interests: S. Aleman has received honoraria for educational events and lectures unrelated to this work from Gilead, AbbVie, Biogen and MSD and reports grants from Gilead and AbbVie. M.B. is a consultant for Bristol Myers Squibb, Mabtech, Pfizer, Oxford Immunotec and MSD. The other authors declare no competing interests.

Figures

Fig. 1
Fig. 1. Cohort overview and humoral immunity in healthy convalescent individuals and individuals with long COVID recruited from the United Kingdom.
a, Ring charts and scatter dot plots showing sex, age and BMI for healthy convalescent individuals (HC, n = 70) and individuals with long COVID (LC, n = 70). b, Scatter dot plots showing the corresponding time to sampling from the initial diagnosis of acute COVID-19. c, Violin plots showing the corresponding distribution of clinical symptom numeric rating scale scores. d, Scatter dot plots showing breathlessness scores as assessed using the Dyspnea-12 and Nijmegen questionnaires (HC, n = 49 and n = 49, respectively; LC, n = 66 and n = 62, respectively). e, Ring chart highlighting the anatomical distribution of pain experienced by individuals with long COVID. f, Scatter dot plot showing SARS-CoV-2-specific neutralization activity quantified as the highest plasma dilution that achieved a 50% reduction in plaque formation (NT50; HC, n = 70; LC, original n = 70 and extended n = 146). g, Scatter dot plot showing total SARS-CoV-2 spike-specific immunoglobulin titers (HC, n = 52; LC, n = 57). h, Scatter dot plots showing maximum CD107a mobilization (left) quantified as percentage values relative to the corresponding positive controls and normalized ADNKA (right) quantified as a function of degranulation (CD107a+) among viable NK cells (AquaCD3CD56+) with potent cytotoxic activity (CD57+; HC, n = 55 and n = 66, respectively; LC, n = 40 and n = 66, respectively); AUC, area under the curve. Horizontal bars represent median values (ad and fh). Significance was evaluated using a two-tailed Mann–Whitney U-test (ad and fh).
Fig. 2
Fig. 2. Immune cell lineages in healthy convalescent individuals and individuals with long COVID recruited from the United Kingdom.
a, List of surface markers used to characterize immune cell lineages in the periphery. b, Uniform manifold approximation and projection (UMAP) representation of immune cell lineages identified via dimensionality reduction of marker expression values; Teff, effector T cells; TEMRA, terminally differentiated effector memory T cells; TCM, central memory T cells. c, Distribution of cells by group of origin in UMAP space (left) or within UMAP clusters (right). d, Scatter dot plots showing the frequencies of naive and total B and T cells gated manually. e, Scatter dot plots showing the frequencies of innate lymphocytes gated manually; ILCs, innate lymphoid cells. f, Scatter dot plots showing the frequencies of monocytes gated manually. g, Scatter dot plots showing the frequencies of basophils and DCs gated manually; cDCs, conventional DCs. h, Heat map showing hierarchically clustered z scores derived from the frequencies of immune cell subsets gated manually. i, Bar plot showing mean z scores for each immune cell subset gated manually for individuals with long COVID (healthy convalescent individuals, n ≤ 70; individuals with long COVID, n ≤ 70; bi). Horizontal bars represent median values (dg). Significance was evaluated using a two-tailed Mann–Whitney U-test (dg).
Fig. 3
Fig. 3. T cell immunity in healthy convalescent individuals and individuals with long COVID recruited from the United Kingdom.
a, Scatter dot plots showing the frequencies of functional CD4+ and CD8+ T cells targeting defined proteins from SARS-CoV-2, CMV or EBV; Mem, membrane; Env, envelope. b, Heat map summarizing the phenotypic attributes of functional CD4+ and CD8+ T cells targeting defined proteins from SARS-CoV-2, CMV or EBV. Data are shown for each marker as the log2-transformed fold change in percent positive for each population among individuals with long COVID versus healthy convalescent individuals; *P < 0.05 and **P < 0.01. c, Scatter dot plots showing the frequencies of functional CD4+ and CD8+ effector memory T (TEM; top) cells and terminally differentiated effector memory T (TEMRA; bottom) cells expressing the indicated activation markers; healthy convalescent individuals, n ≤ 70; individuals with long COVID, n ≤ 70 (ac). Horizontal bars represent median values (a and c). Significance was evaluated using a two-tailed Mann–Whitney U-test (ac).
Fig. 4
Fig. 4. Phenotypic characteristics of virus-specific CD8+ T cells in healthy convalescent individuals and individuals with long COVID recruited from the United Kingdom.
a, Schematic representation of the experimental design. b, Scatter dot plots showing the expression frequencies of HLA-DR and CD38 or granzyme B (GZMB) among tetramer+CD8+ T cells. c, Scatter dot plots showing the expression intensities of co-inhibitory receptors among tetramer+CD8+ T cells. d, Scatter dot plot showing co-inhibitory scores, calculated as the cumulative normalized expression intensities of the co-inhibitory receptors shown in c, among tetramer+CD8+ T cells. e, Scatter dot plots showing the expression intensities of transcription factors among tetramer+CD8+ T cells. f, UMAP visualization summarizing the phenotypic characteristics of tetramer+CD8+ T cells targeting nonspike epitopes from SARS-CoV-2. Individual marker representations are colored by expression intensity. g, Phenograph clustering (top) and cluster distribution of tetramer+CD8+ T cells (bottom). h, Scatter dot plots showing the expression intensities of co-inhibitory receptors among tetramer+CD8+ T cells targeting nonspike or spike epitopes from SARS-CoV-2. i, Scatter dot plots showing co-inhibitory scores among tetramer+CD8+ T cells targeting nonspike or spike epitopes from SARS-CoV-2. j, Scatter dot plots showing co-inhibitory scores among tetramer+CD8+ T cells targeting nonspike epitopes from SARS-CoV-2 restricted by HLA-A*02:01 or HLA-B*07:02; NC, nucleocapsid. k, Scatter dot plots showing the expression intensities of transcription factors among tetramer+CD8+ T cells targeting nonspike or spike epitopes from SARS-CoV-2. l, Scatter dot plots showing the phenotypic characteristics of tetramer+CD8+ T cells targeting lytic epitopes from EBV; healthy convalescent individuals, n = 17; individuals with long COVID, n = 15; untreated individuals infected with HIV-1, n = 14 (bl). Horizontal bars represent median values (be and hl). Significance was evaluated using a two-tailed Mann–Whitney U-test (be and hl); gMFI, geometric mean fluorescence intensity.
Fig. 5
Fig. 5. Dysregulation of the plasma proteome associated with breathlessness in healthy convalescent individuals and individuals with long COVID recruited from the United Kingdom.
a, PCA of plasma protein concentrations colored by donor group for healthy convalescent individuals (n = 51) and individuals with long COVID (n = 51). b, Bar plots showing the corresponding numbers of differentially upregulated plasma proteins from each panel. Significance was evaluated using a two-tailed Mann–Whitney U-test with (red) or without (gray) Benjamini–Hochberg correction. c, Stacked histogram showing the distribution of breathlessness scores for healthy convalescent individuals (n = 34) and individuals with long COVID (n = 48). d, PCA of plasma protein concentrations colored by breathlessness score tiers for healthy convalescent individuals (n = 51) and individuals with long COVID (n = 51), irrespective of clinical assignation. e, Volcano plots showing the corresponding differentially expressed plasma proteins from each panel versus the highest and lowest breathlessness score tiers, irrespective of clinical assignation. Significance was evaluated using a two-tailed Mann–Whitney U-test with (red) or without (gray) Benjamini–Hochberg correction. The dashed line indicates P = 0.05. f, Correlation dot plots showing the highest (n = 6) and lowest ranked plasma proteins (n = 4) in terms of normalized expression versus breathlessness scores for healthy convalescent individuals (n = 51) and individuals with long COVID (n = 51), irrespective of clinical assignation; IDI2, isopentenyl-diphosphate δ-isomerase-2; SPRR3, small proline-rich protein 3; ENPP5, ectonucleotide pyrophosphatase/phosphodiesterase family member 5; OMP, olfactory marker protein. Significance was evaluated using the two-tailed Pearson coefficient. Shading indicates the 95% confidence interval for each regression line.
Fig. 6
Fig. 6. Shared signatures of plasma proteome dysregulation associated with respiratory symptoms in healthy convalescent individuals and individuals with long COVID.
a, Bar plot showing the distribution of Borg CR10 scores for individuals in the secondary cohort with long COVID (n = 95). b, Volcano plots showing differentially expressed plasma proteins from each panel versus Borg CR10 score tiers for individuals in the secondary cohort with long COVID (n = 95). Significance was evaluated using a two-tailed Mann–Whitney U-test. The dashed line indicates P = 0.05. No proteins achieved adjusted P < 0.05 after Benjamini–Hochberg correction. c, GSEA showing differentially expressed plasma proteins by rank versus the Borg CR10 score tiers for individuals with long COVID (n = 95), irrespective of clinical assignation. The top five terms from the Hallmark (H) and Pathway Interaction Database (PID) gene sets (Molecular Signatures Database (MSigDB) Collections) are shown. Significance was evaluated using the GSEA method without correction; NES, normalized enrichment score. d, Scatter dot plot showing individual plasma protein fold change across breathlessness score tiers (primary cohort, x axis) and Borg CR10 score tiers (secondary cohort, y axis). Significance was evaluated using a two-tailed Spearman rank test. Proteins are colored according to significance without Benjamini–Hochberg correction. e, Network analysis showing differentially expressed plasma proteins from the inflammation panel across both cohorts depicted using Cytoscape. Nodes and edges represent proteins and functional relevance, respectively. Edge thickness represents the level of confidence. f, Overrepresentation analysis of significantly upregulated plasma proteins across both cohorts showing the five top terms from the Hallmark Collection and the Pathway Interaction Database. Significance was evaluated using a hypergeometric test. g, Comparison of plasma protein concentrations between cohorts split by symptom severity. Horizontal bars represent median values. Significance was evaluated using a two-tailed Mann–Whitney U-test; NPX, normalized protein expression; AIFM1, apoptosis-inducing factor mitochondria-associated 1; CASP, caspase.
Extended Data Fig. 1
Extended Data Fig. 1. Expression of immune cell lineage markers measured via flow cytometry.
UMAP representation of individual immune cell lineage markers among peripheral blood mononuclear cells after dimensionality reduction.
Extended Data Fig. 2
Extended Data Fig. 2. Flow cytometric gating strategies for the identification of immune cell lineages and activation-induced marker upregulation.
(a) Flow cytometric gating strategy for immune cell lineage characterization. Numbers indicate percentages in the drawn gates. (b) Flow cytometric gating strategy for the identification of antigen-specific CD4+ and CD8+ T cells via upregulation of the activation-induced markers CD69 and CD154 or CD69 and CD137, respectively. Numbers indicate percentages in the drawn gates.
Extended Data Fig. 3
Extended Data Fig. 3. Immune cell lineages and T cell immunity in healthy convalescent individuals and patients with long COVID recruited from Sweden.
(a) Scatter dot plots showing the frequencies of naive and total B and T cells gated manually. (b) Scatter dot plots showing the frequencies of innate lymphocytes gated manually. (c) Scatter dot plots showing the frequencies of monocytes gated manually. (d) Scatter dot plots showing the frequencies of basophils and dendritic cells gated manually. (e) Scatter dot plots showing the frequencies of functional CD4+ and CD8+ T cells targeting defined proteins from SARS-CoV-2, CMV, or EBV. (f) Heatmap summarizing the phenotypic attributes of functional CD4+ and CD8+ T cells targeting defined proteins from SARS-CoV-2, CMV, or EBV. Data are shown for each marker as the log2-transformed fold change in percent positive for each population among patients with long COVID (LC) versus healthy convalescent individuals (HC). *P < 0.05, **P < 0.01. HC, n ≤ 20; LC, n ≤ 56 (a, b, c, d, e and f). Horizontal bars represent median values (a, b, c, d and e). Significance was evaluated using a two-tailed Mann–Whitney U test (a, b, c, d, e and f).
Extended Data Fig. 4
Extended Data Fig. 4. Additional phenotypic characteristics of virus-specific CD8+ T cells in healthy convalescent individuals and patients with long COVID recruited from the UK.
(a) Flow cytometric gating strategy for the identification of tetramer+ CD8+ T cells directly ex vivo. Numbers indicate percentages in the drawn gates. (b) Flow cytometry histograms showing the expression patterns of coinhibitory receptors among clusters of tetramer+ CD8+ T cells targeting nonspike epitopes from SARS-CoV-2 identified using Phenograph. (c) Scatter dot plots showing the expression intensities of selected markers among tetramer+ CD8+ T cells targeting lytic epitopes from EBV. (d) Scatter dot plots showing the expression intensities of selected markers among tetramer+ CD8+ T cells targeting epitopes from CMV. (e) Scatter dot plots showing the expression intensities of selected markers among tetramer+ CD8+ T cells targeting latent epitopes from EBV. Healthy convalescent individuals (HC), n = 17; patients with long COVID (LC), n = 15 (b, c, d and e). Horizontal bars represent median values (c, d and e). Significance was evaluated using a two-tailed Mann–Whitney U test (c, d and e). gMFI, geometric mean fluorescence intensity.
Extended Data Fig. 5
Extended Data Fig. 5. Dysregulation of the plasma proteome associated with clinical assignation and symptomatology in healthy convalescent individuals and patients with long COVID recruited from the UK.
(a) Principal component analysis of plasma protein concentrations colored by body mass index (BMI) for healthy convalescent individuals (n = 51) and patients with long COVID (n = 51). (b) Volcano plots showing the corresponding differentially expressed plasma proteins from each panel versus clinical assignation. Significance was evaluated using a two-tailed Mann–Whitney U test with (red) or without Benjamini-Hochberg correction (gray). The dashed line indicates P = 0.05. (c) Gene set enrichment analysis (GSEA) showing the corresponding differentially expressed plasma proteins by rank versus clinical assignation. (d) Bar plots showing the numbers of differentially upregulated plasma proteins from each panel versus the highest and lowest symptom score tiers for healthy convalescent individuals (n = 34) and patients with long COVID (n = 48), irrespective of clinical assignation. Significance was evaluated using a two-tailed Mann–Whitney U test with (red) or without Benjamini-Hochberg correction (gray). (e) GSEA showing the corresponding differentially expressed plasma proteins by rank versus the highest and lowest breathlessness score tiers, irrespective of clinical assignation. (f) Heatmap showing correlations among clinical scores for healthy convalescent individuals (n = 51) and patients with long COVID (n = 51), irrespective of clinical assignation. (g) Correlation dot plot showing the corresponding breathlessness scores versus BMI, irrespective of clinical assignation. Significance was evaluated using the GSEA method without correction (c and e) or a two-tailed Spearman rank test (f and g). H, Hallmark; NES, normalized enrichment score; PID, Pathway Interaction Database.
Extended Data Fig. 6
Extended Data Fig. 6. Dysregulation of the plasma proteome associated with breathlessness in healthy convalescent individuals and patients with long COVID recruited from the UK.
(a) Stacked histogram showing the distribution of correlation coefficients from pairwise comparisons of plasma protein concentrations versus breathlessness scores for healthy convalescent individuals (n = 34) and patients with long COVID (n = 48), irrespective of clinical assignation. Significance was evaluated using the two-tailed Pearson coefficient. (b) Gene set enrichment analysis (GSEA) showing selected terms from Human Phenotype Ontology (HPO), the Pathway Interaction Database (PID), and the Hallmark Collection. Plasma protein concentrations were ranked by correlation with breathlessness scores for healthy convalescent individuals (n = 34) and patients with long COVID (n = 48), irrespective of clinical assignation. Significance was evaluated using the GSEA method without correction. NES, normalized enrichment score. (c) Network analysis showing the corresponding differentially expressed plasma proteins from the inflammation panel depicted using Cytoscape. Each node represents a protein. Node color indicates protein concentration, and node size indicates significance. Red denotes overexpression in patients with long COVID, and blue denotes underexpression in patients with long COVID. Each edge represents the functional relevance between a pair of proteins, and line thickness represents the level of confidence.
Extended Data Fig. 7
Extended Data Fig. 7. Dysregulation of the plasma proteome associated with perceived exertion in patients with long COVID recruited from Sweden.
(a) Stacked histogram showing the distribution of correlation coefficients from pairwise comparisons of plasma protein concentrations versus Borg CR10 score for patients with long COVID (n = 95). Significance was evaluated using the two-tailed Pearson coefficient. (b) Gene set enrichment analysis (GSEA) showing plasma protein concentrations ranked by correlation with Borg CR10 scores for patients with long COVID (n = 95). Significance was evaluated using the GSEA method without correction. NES, normalized enrichment score. (c) Network analysis showing the corresponding differentially expressed plasma proteins from the inflammation panel depicted using Cytoscape. Each node represents a protein. Node color indicates protein concentration, and node size indicates significance. Red denotes overexpression in patients with a moderate Borg CR10 score, and blue denotes underexpression in patients with a moderate Borg CR10 score. Each edge represents the functional relevance between a pair of proteins, and line thickness represents the level of confidence.

References

    1. Nalbandian, A. et al. Post-acute COVID-19 syndrome. Nat. Med.27, 601–615 (2021). - PMC - PubMed
    1. Subramanian, A. et al. Symptoms and risk factors for long COVID in non-hospitalized adults. Nat. Med.28, 1706–1714 (2022). - PMC - PubMed
    1. Davis, H. E., McCorkell, L., Vogel, J. M. & Topol, E. J. Long COVID: major findings, mechanisms and recommendations. Nat. Rev. Microbiol.21, 133–146 (2023). - PMC - PubMed
    1. Chen, B., Julg, B., Mohandas, S. & Bradfute, S. B. RECOVER Mechanistic Pathways Task Force. Viral persistence, reactivation, and mechanisms of long COVID. eLife12, e86015 (2023). - PMC - PubMed
    1. Zadeh, F. H., Wilson, D. R. & Agrawal, D. K. Long COVID: complications, underlying mechanisms, and treatment strategies. Arch. Microbiol. Immunol.7, 36–61 (2023). - PMC - PubMed