

Development of a radiomic model to predict CEACAM1 expression and prognosis in ovarian cancer
- PMID: 40307488
- PMCID: PMC12044014
- DOI: 10.1038/s41598-025-99625-1
Development of a radiomic model to predict CEACAM1 expression and prognosis in ovarian cancer
Abstract
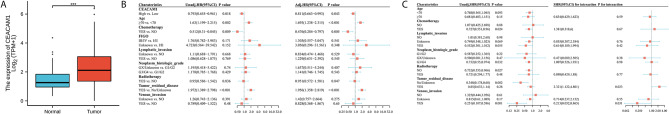
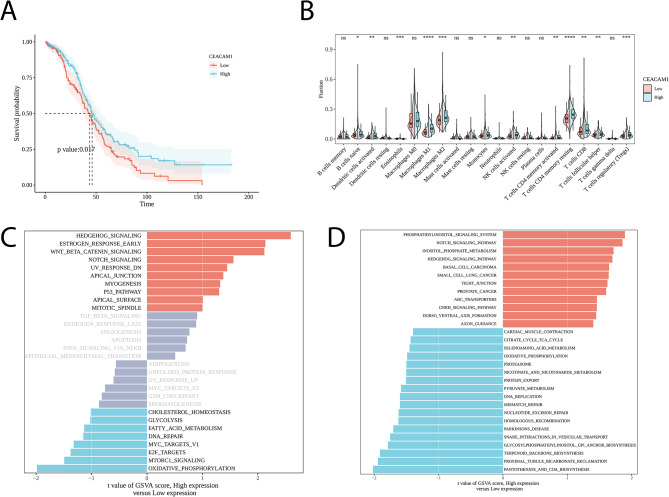
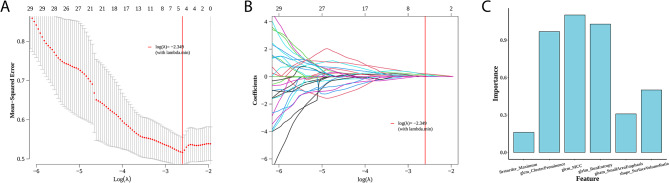
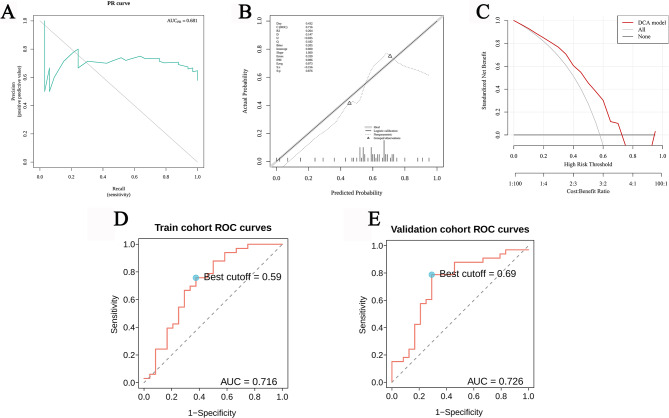
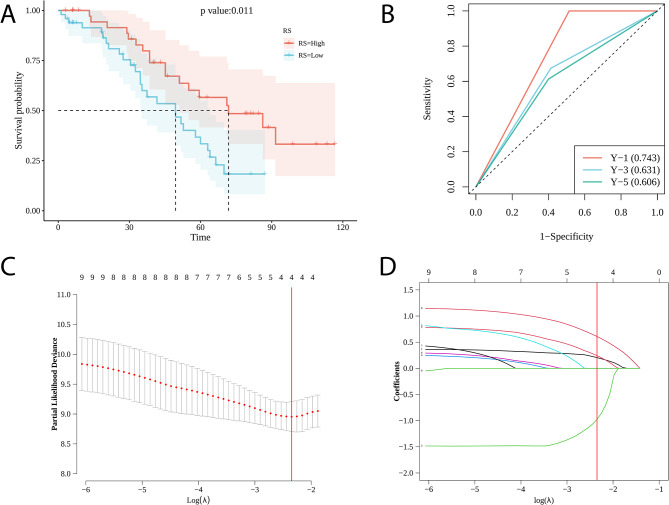
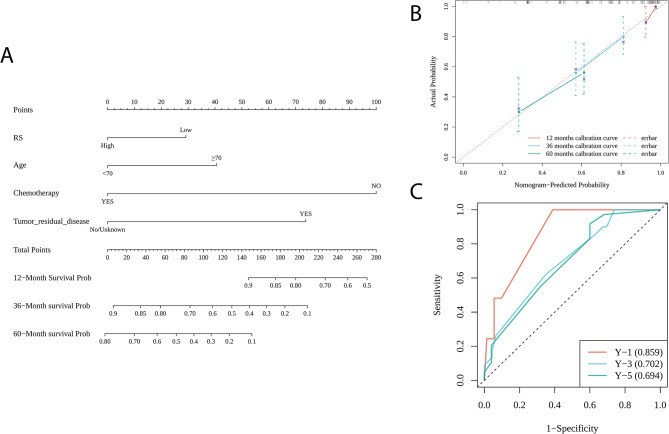
We aimed to investigate the prognostic role of CEACAM1 and to construct a radiomic model to predict CEACAM1 expression and prognosis in ovary cancer (OC). Sequencing data and CT scans in OC were sourced from TCGA and TCIA databases. CEACAM1 expression was assessed by Cox regression analyses, Kaplan-Meier curves and GSVA enrichment analysis. Furthermore, radiomic features were extracted from CT scans and selected by LASSO and ROC. The selected radiomic features were used to construct a radiomic model to predict CEACAM1 expression. In addition, the radiomic score (RS) and its relationship with OC survival were investigated by Kaplan-Meier and ROC curves. At last, RS and clinical features were included into LASSO, using nomogram to predict OC prognosis. Cox regression analyses showed that CEACAM1 expression was an independent prognostic factor and associated with immune cell infiltration in OC. By LASSO and ROC, six radiomic features were selected and used to construct a radiomic model. The PR, calibration, DCA and ROC curves revealed the good performance and clinical utility of the radiomic model to predict CEACAM1 expression. In addition, RS based on radiomic features was found to be associated with OC survival. At last, a nomogram based on RS, age, chemotherapy and tumor residual disease was constructed and was found to have high accuracy in predicting OC prognosis. For the first time, our study constructed a radiomic model to predict CEACAM1 expression and prognosis of OC patients. Those findings may guide novel diagnosis and treatment for OC patients.
Keywords: CEACAM1; Ovarian cancer; Prognosis; Radiomics.
© 2025. The Author(s).
Conflict of interest statement
Declarations. Competing interests: The authors declare no competing interests. Ethics approval and consent to participate: Institutional Review Board approval was not required because data sourced from public network bioinformatics databases.
Figures
Similar articles
-
CT radiomics prediction of CXCL9 expression and survival in ovarian cancer.J Ovarian Res. 2023 Aug 30;16(1):180. doi: 10.1186/s13048-023-01248-5. J Ovarian Res. 2023. PMID: 37644593 Free PMC article.
-
Radiomics Signatures Based on Computed Tomography for Noninvasive Prediction of CXCL10 Expression and Prognosis in Ovarian Cancer.Cancer Rep (Hoboken). 2024 Oct;7(10):e70030. doi: 10.1002/cnr2.70030. Cancer Rep (Hoboken). 2024. PMID: 39443817 Free PMC article.
-
Clinical and prognostic significance of FBXL6 expression in ovarian cancer.Gene. 2025 Jan 15;933:148978. doi: 10.1016/j.gene.2024.148978. Epub 2024 Oct 3. Gene. 2025. PMID: 39368786
-
The Role of microRNA in the Prognosis and Diagnosis of Ovarian Cancer.Int J Mol Sci. 2025 Apr 5;26(7):3413. doi: 10.3390/ijms26073413. Int J Mol Sci. 2025. PMID: 40244333 Free PMC article. Review.
-
Predicting Response to Treatment and Survival in Advanced Ovarian Cancer Using Machine Learning and Radiomics: A Systematic Review.Cancers (Basel). 2025 Jan 21;17(3):336. doi: 10.3390/cancers17030336. Cancers (Basel). 2025. PMID: 39941708 Free PMC article. Review.
References
-
- Jennifer, A., Iptissem, N., Aurélie, R., Philippe, K. & Marc, A. J. The place of secondary complete cytoreductive surgery in advanced ovarian cancer. Horm. Mol. Biol. Clin. Investig. 4110.1515/hmbci-2019-0030 (2019). - PubMed
-
- Armstrong, D. K. et al. NCCN Guidelines® insights: ovarian cancer, version 3.2022. J. Natl. Compr. Canc Netw.20, 972–980. 10.6004/jnccn.2022.0047 (2022). - PubMed
-
- Grunewald, T. & Ledermann, J. A. Targeted therapies for ovarian Cancer. Best Pract. Res. Clin. Obstet. Gynaecol.41, 139–152. 10.1016/j.bpobgyn.2016.12.001 (2017). - PubMed
MeSH terms
Substances
Grants and funding
LinkOut - more resources
Full Text Sources
Medical
Research Materials
Miscellaneous
