. 2025 May;5(5):799-815.
doi: 10.1038/s43587-025-00855-9. Epub 2025 Apr 30.

KLRG1 identifies regulatory T cells with mitochondrial alterations that accumulate with aging

Affiliations

KLRG1 identifies regulatory T cells with mitochondrial alterations that accumulate with aging

Gonzalo Soto-Heredero et al. Nat Aging. 2025 May.

Abstract

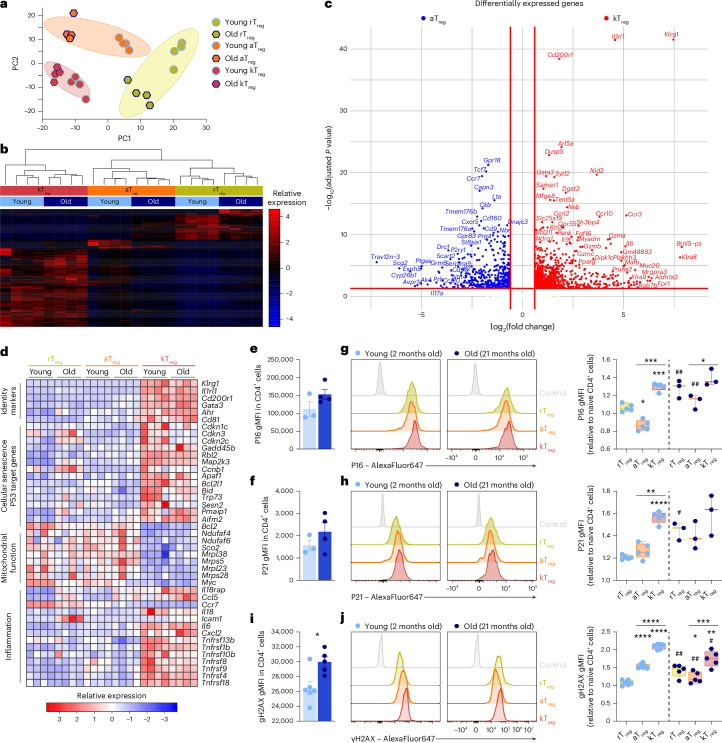
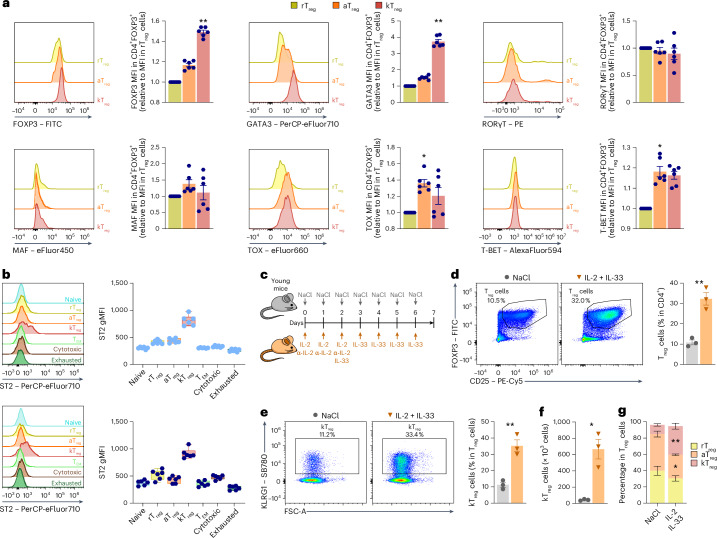
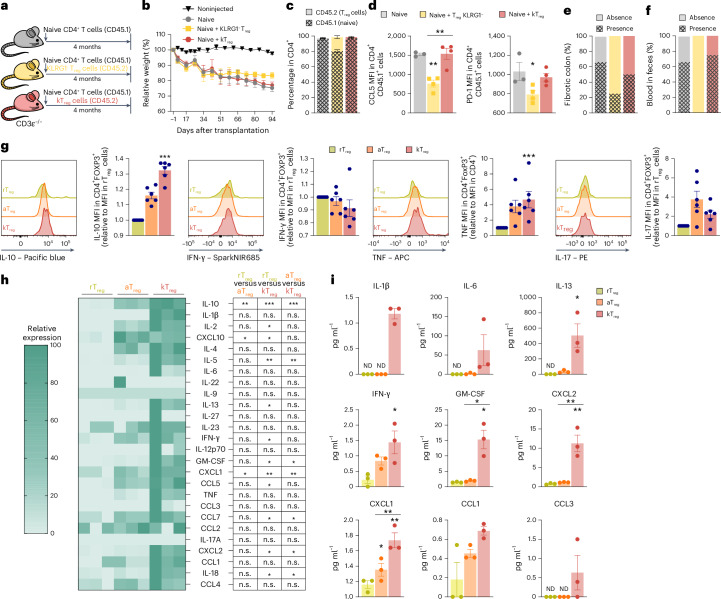
Recent studies using single-cell RNA sequencing technology have uncovered several subpopulations of CD4+ T cells that accumulate with aging. These age-associated T cells are emerging as relevant players in the onset of inflammaging and tissue senescence. Here, based on information provided by single-cell RNA sequencing data, we present a flow cytometry panel that allows the identification of age-associated T cell subsets in systematic larger analysis in mice. We use this panel to evaluate at the single-cell level mitochondrial and senescence marks in the different age-associated CD4+ T cell subpopulations. Our analysis identifies a subpopulation of regulatory T (Treg) cells that is characterized by the extracellular expression of the co-inhibitory molecule killer cell lectin-like receptor subfamily G member 1 (KLRG1) and accumulates with aging in humans and mice. KLRG1-expressing Treg cells display senescence features such as mitochondrial alterations, increased expression of cell-cycle regulators and genomic DNA damage. Functionally, KLRG1+ Treg cells show a reduced suppressive activity in vivo accompanied by a pro-inflammatory phenotype.


Conflict of interest statement

Competing interests: The authors declare no competing interests.

Figures

Fig. 1
Fig. 1. CD4+ T cells progressively accumulate altered mitochondria during aging.
a,b, Representative flow cytometry plots showing the simultaneous analysis of MtG and MtDR (a) and the percentage of cells with MtGhiMtDRhi, MtGhiMtDRlo and MtGloMtDRlo (b) in the circulating CD4+ T cells from 2-month-old (n = 5), 9-month-old (n = 5), 13-month-old (n = 5), 17-month-old (n = 5) and 21-month-old (n = 6) mice. c,d, Representative flow cytometry plots (c) and quantifications (d) of the simultaneous analysis of MtG and MitoTracker Red CMXROS in splenic CD4+ T cells from young (2-month-old) and aged (21-month-old) mice. e, Representative flow cytometry plots showing the sorting strategy of MtGhiMtDRhi and MtGloMtDRlo CD4+ T cells from old mice. f,g, Representative images of electron microscopy (f) and quantifications (g) of healthy and morphologically altered mitochondria in MtGhiMtDRhi (green) and MtGloMtDRlo (red) splenic CD4+ T cells from old mice (n = 90 and 300 cells from 2 different mice). h,i, Representative flow cytometry plots (h) and quantifications (i) of MtGhiMtDRhi and MtGloMtDRlo cells in circulating naive (CD62LhiCD44lo, blue) and effector (CD62LloCD44hi, purple) CD4+ T cells from 2-, 9-, 13-, 17- and 21-month-old mice (n = 6 mice per group). Each dot represents an individual mouse. Data are presented as mean values ± s.e.m. Statistical analysis was performed using one-way ANOVA with with post hoc Tukey’s correction (b), two-tailed unpaired Student’s t-test (d and i: MtDRhiMtGhi 2 months, 9 months, 17 months, 21 months; MtDRloMtGlo 2 months, 9 months, 21 months), two-tailed Welch’s t-test (i: MtDRhiMtGhi 13 months; MtDRloMtGlo 13 months, 17 months) or Mann–Whitney U test (g). *P < 0.05; **P < 0.01; ***P < 0.001; ****P < 0.0001. Exact P values and additional statistical parameters can be found in the source data. Source data
Fig. 2
Fig. 2. Multiparametric spectral flow cytometry identifies a new age-associated Treg subset.
a, UMAP representation of splenic CD4+ T cells from young (left) and old mice (right) analyzed by spectral flow cytometry. b, UMAP with Cluster-X overlay showing the distribution of the different clusters of CD4+ T cells identified by spectral flow cytometry (n = 4 mice per group). c, UMAP representation of the expression levels of representative markers used to identify TAAs by flow cytometry. d, The distribution of the gMFI of representative markers used to identify TAAs in CD4+ T cell subpopulations: naive (blue), rTreg (yellow), aTreg (orange), kTreg (red), TEM (light green), cytotoxic (brown) and exhausted (dark green) (n = 4 mice per group). e,f, Representative pie charts (e) and box plots (f) comparing the percentage of cells belonging to each T cell subset in young (2-month-old, n = 4) and old (22-month-old, n = 5) mice. g, The gating strategy to identify FOXP3+ cells within the kTreg cells in young (2-month-old) and old (22-month-old) mice (n = 3 per group). gMFI, geometric mean fluorescence intensity. Each dot represents an individual mouse. Box-and-whisker plots show the median, the maximum, the minimum and the 25th and 75th percentiles. Statistical analysis was performed using two-tailed unpaired Student’s t-test (f: naive) or two-tailed unpaired Welch’s t-test (f: rTreg, aTreg, kTreg, TEM, exhausted and cytotoxic). *P < 0.05, **P < 0.01, ***P < 0.001, ****P < 0.0001. Exact P values and additional statistical parameters can be found in the source data. Source data
Fig. 3
Fig. 3. kTreg cells accumulate peripheral tissues during aging and are preferentially located in the colonic lamina propria.
a, UMAP with Cluster-X overlay showing the distribution of the different clusters of CD4+ T cells from spleen, bone marrow, liver and colonic lamina propria of young mice analyzed by spectral flow cytometry. b, UMAP with Cluster-X overlay showing the distribution of the different clusters of CD4+ T cells from young mice in different tissues (n = 5). c, Representative bar plots showing the percentage of cells belonging to each T cell subset in spleen, bone marrow, liver and colonic lamina propria from young mice (n = 5). d,e, Quantifications of absolute numbers of kTreg cells (d) and the percentage of kTreg cells among Treg cells (e) in different tissues in young (2-month-old, n = 5) and old (22-month-old, n = 4) mice. WAT, white adipose tissue. Box-and-whisker plots show the median, the maximum, the minimum and the 25th and 75th percentiles. Statistical analysis was performed using two-tailed unpaired Student’s t-test (d: spleen and WAT; e: bone marrow, liver, lamina propria and WAT) or two-tailed Welch’s t-test (d: bone marrow, lamina propria and Peyer’s patches; e: spleen and Peyer’s patches]. *P < 0.05, **P < 0.01, ***P < 0.001, ****P < 0.0001. Exact P values and additional statistical parameters can be found in the source data. Source data
Fig. 4
Fig. 4. TAAs have different predisposition to mitochondrial perturbations.
a, Representative flow cytometry plots showing the simultaneous analysis of MtG and MtDR in the different subsets of CD4+ T cells from 2- and 21-month-old mice: naive (blue), rTreg cells (yellow), aTreg cells (orange), kTreg cells (red), TEM (light green), cytotoxic (brown) and exhausted (dark green) (n = 6 mice per group). b, A comparison of the percentage of MtGloMtDRlo cells in each cluster of CD4+ T cells in young (2-month-old) and old (21-month-old) mice (n = 6 mice per group). c, A statistical comparison of the percentage of MtGloMtDRlo cells in the different clusters in young or old mice (n = 6 mice per group). Each dot represents an individual mouse. Data are presented as mean values ± s.e.m. Box-and-whisker plots show the median, the maximum, the minimum and the 25th and 75th percentiles. Statistical analysis was performed using two-tailed unpaired Student’s t-test (b: naive, rTreg, aTreg and TEM), Mann–Whitney U test (b: kTreg and exhausted) or Friedman test with post hoc Dunn’s correction (c). n.s., not significant; *P < 0.05, **P < 0.01, ***P < 0.001, ****P < 0.0001. Exact P values and additional statistical parameters can be found in the source data. Source data
Fig. 5
Fig. 5. KLRG1 identifies Treg cells with senescence features.
ad, RNA sequencing of rTreg, aTreg and kTreg cells from young and old mice: PCA (a) and clusterization (b); volcano plot showing the DEGs between aTreg cells and kTreg cells (c); heat map of selected DEGs illustrating genes characteristic of identity, cellular senescence, P53 signaling, mitochondrial function and inflammation (d) (n = 4 per group). e,f, Quantification of the expression of P16 (e) and P21 (f) by flow cytometry in splenic CD4+ T cells from young (2 months old, n = 4) and old (21 months old, n = 3) mice measured as gMFI. g,h, Representative histograms and quantifications of the expression of P16 (g) and P21 (h) by flow cytometry in the different subsets of splenic Treg cells from young (n = 4) and old (n = 3) mice measured as gMFI: rTreg cells (yellow), aTreg cells (orange) and kTreg cells (red). i, Quantification of γH2AX gMFI in CD4+ T cells from young and old mice (n = 5 per group). j, Representative histogram and quantification of γH2AX by flow cytometry in the different subsets of Treg cells from young and old mice measured as gMFI (n = 5 per group). gMFI values are relative to the gMFI in naive CD4+ T cells. DEGs, differentially expressed genes; gMFI, geometric mean fluorescence intensity. Each dot represents an individual mouse. Data are presented as mean values ± s.e.m. Statistical analysis between young and old mice was performed using two-tailed unpaired Student’s t-test (eh: aTreg; i and j) or two-tailed Welch’s t-test (h: rTreg and kTreg). Statistical analysis between subsets within the same animal was performed using RM one-way ANOVA with with post hoc Tukey’s correction (g, h and j). Asterisks refers to statistic comparisons between rTreg, aTreg and kTreg in the same age group; the number signs refer to statistic comparisons between young and old mice. *P < 0.05, **P < 0.01, ***P < 0.001, ****P < 0.0001. Exact P values and additional statistical parameters can be found in the source data. Source data
Fig. 6
Fig. 6. KLRG1+ Treg differentiation depends on the IL-33–ST2 axis.
a, Representative histograms and quantifications of the expression of different transcription factors by flow cytometry in splenic rTreg (yellow), aTreg (orange) and kTreg (red) cells from old (21-month-old) mice measured as gMFI (n = 6 mice per group). gMFI values are relative to the MFI in rTreg cells (n = 6 per group). b, Representative histograms and quantifications of ST2 expression by flow cytometry in the different clusters of splenic CD4+ T cells from young (2-month-old) and old (21-month-old) mice: naive (blue), rTreg (yellow), aTreg (orange), kTreg (red), TEM (light green), cytotoxic (brown) and exhausted (dark green) cells measured as gMFI (n = 6 mice per group). cg, In vivo differentiation of kTreg cells: young control mice (2 months old) were treated with IL-2 + IL-33 or NaCl for 6 days and analyzed on day 7 after injection (n = 3 mice per group) (c); representative flow cytometry plot and quantification of the proportion of splenic Treg cells in young mice treated with NaCl or IL-2 and IL-33 (d); representative flow cytometry plot and quantification of the proportion of KLRG1+ Treg cells in young mice treated with NaCl or IL-2 and IL-33 (e); quantification of the absolute numbers of KLRG1+ Treg cells in young mice treated or not treated with IL-2 and IL-33 (n = 3 mice per group) (f); quantification of the percentage of each Treg cluster in young mice treated with NaCl or IL-2 and IL-33 (n = 3 mice per group) (g). gMFI, geometric mean fluorescence intensity. Each dot represents an individual mouse. Data are presented as mean values ± s.e.m. Box-and-whisker plots show the median, the maximum, the minimum and the 25th and 75th percentiles. Statistical analysis was performed using Friedman test with post hoc Dunn’s correction (a and b: old), RM one-way ANOVA with post hoc Tukey’s correction (b: young), two-tailed unpaired Student’s t-test (d, e and g) or two-tailed Welch’s t-test (f). *P < 0.05, **P < 0.01, ***P < 0.001, ****P < 0.0001. Exact P values and additional statistical parameters can be found in the source data. Source data
Fig. 7
Fig. 7. Analysis of the suppressive and pro-inflammatory function of KLRG1+ Treg cells.
af, In vivo assessment of the suppressive activity of KLRG1+ Treg cells. CD3ε−/− T cell-deficient mice were exclusively injected with naive CD45.1 CD4+ T cells (n = 4) or in combination with either CD45.2 KLRG1 Treg cells (n = 5) or CD45.2 KLRG1+ Treg cells (n = 5) isolated from young mice treated with IL-2 + IL-33. Noninjected CD3ε−/− (n = 3) are represented for the sake of comparison. The injected mice were monitored for 4 months and analyzed. a, Schematic diagram depicting the in vivo suppression assay. b, The body weight of CD3ε−/− mice injected with naive CD4+ T cells alone or in combination with KLRG1 or KLRG1+ Treg cells. The weight of each animal was normalized to its own weight before the inoculation. c, The percentage of transferred CD45.1 naive (striped color) or CD45.2 Treg (flat color) cells analyzed by flow cytometry in CD3ε−/− mice injected with naive and/or Treg cells. d, Quantification of the expression of CCL5 and PD-1 by flow cytometry in the injected CD45.1 CD4+ T cells measured as gMFI. e,f, The percentage of mice with fibrotic colon (e) or fecal blood (f) in mice injected with naive and/or Treg cells. g, Representative histograms and quantifications of the expression of different cytokines by flow cytometry in splenic rTreg (yellow), aTreg (orange) and kTreg (red) cells from old (21-month-old) mice measured as gMFI. gMFI values are relative to the MFI in rTreg cells (n = 6). h,i, Analysis of the secretion of different cytokines by the Treg subsets using multiplex. Treg subsets were sorted from young mice injected with IL-2 + IL-33 and incubated during 24 h in 10% FBS complete RPMI medium before the assay (n = 3). Heat map (h) and statistical comparisons of the secretion of different cytokines by rTreg, aTreg and kTreg cells. Heat map values are relative to the maximum of each cytokine. Quantification (i) of SASP-related cytokines secreted by rTreg, aTreg and kTreg cells. gMFI, geometric mean fluorescence intensity. Each dot represents an individual mouse. Data are presented as mean values ± s.e.m. Statistical analysis was performed using one-way ANOVA with post hoc Tukey’s correction (c: CD45.1; d and e), Krukal–Wallis test with post hoc Dunn’s correction (c: CD45.2), Friedman test with post hoc Dunn’s correction (gi). n.s., not significant; *P < 0.05, **P < 0.01, ***P < 0.001, ****P < 0.0001. Exact P values and additional statistical parameters can be found in the source data. Source data
Fig. 8
Fig. 8. KLRG1+ Treg cells are increased in human blood during aging.
a, Representative flow cytometry plots of the gating of KLRG1+ Treg cells in PBMCs samples from young and senior volunteers. bd, Quantifications of the percentage of KLRG1+ Treg cells among Treg cells (b), among CD4+ cells (c) and among total lymphocytes (d) in young (18–25 years old, n = 42) and senior (≥55 years old, n = 75) individuals by flow cytometry. Each dot represents an individual. Data are presented as mean values ± s.e.m. Statistical analysis was performed using two-tailed unpaired Welch’s t-test (b) or Mann–Whitney U test (c and d). *P < 0.05, **P < 0.01, ***P < 0.001, ****P < 0.0001. Exact P values and additional statistical parameters can be found in the source data. Source data
Extended Data Fig. 1
Extended Data Fig. 1. CD4+ T cells progressively lose mitochondrial mass and mitochondrial membrane potential during aging.
(a) Representative plots of mitochondrial mass and mitochondrial membrane potential analyzed by flow cytometry in CD4+ T cells treated or not treated with oligomycin. Cells were gated as MtGhiMtDRhi, MtGhiMtDRlo and MtGloMtDRlo. Mitochondrial mass analyzed as gMFI of MtG (b) and mitochondrial membrane potential analyzed as gMFI of MtDR (c) measured by flow cytometry in circulating CD4+ T cells from mouse from 2- (n = 5), 9- (n = 5), 13- (n = 5), 17- (n = 5) and 21- (n = 6) month-old mice. (d) Representative flow cytometry plots and quantifications of the simultaneous analysis of MtG and TMRM in splenic CD4+ T cells from young (2-month-old, n = 5) and old (21-month-old, n = 4) mice. (e) Quantification of the MtDR/MtG ratio in MtGhiMtDRhi and MtGloMtDRlo CD4+ T cells from mice at different ages (n = 6 mice per group). gMFI: Geometric Mean Fluorescence Intensity; MtG: Mitotracker Green; MtDR: Mitotracker DeepRed. Each dot represents an individual mouse. Data are presented as mean values ± SEM. Statistical analysis was performed using one-way ANOVA with post hoc Tukey’s correction (b), Kruskal-Wallis test with post hoc Dunn’s correction (c), two-tailed Student’s t test [(d): TMRMhiMtGhi; (e)] or two-tailed unpaired Welch’s t test [(d): TMRMloMtGlo] (b). *P < 0.05; **P < 0.01; ***P < 0.001; ****P < 0.0001. Exact P values and additional statistical parameters can be found in the source data. Source data
Extended Data Fig. 2
Extended Data Fig. 2. Identification of age-associated T cells by scRNAseq and by spectral flow cytometry.
(a) UMAP representation of CD4+ T cells from young (left) and old mice (right) analyzed by scRNAseq (top) or spectral flow cytometry (bottom). (b) UMAP with clustering overlay showing the distribution of the different clusters of CD4+ T cells identified by scRNAseq or by spectral flow cytometry: naive (blue), naïve_ISG15 (dark blue), rTregs (yellow), aTregs (orange), kTregs (red), TEM (light green), cytotoxic (brown) and exhausted (dark green) (n = 4 mice per group). (c) Percentage of circulating KLRG1+ cells in CD4+ T cells from 2- (n = 6), 9- (n = 6), 13- (n = 5), 17- (n = 6) and 21- (n = 6) month-old mice assessed by flow cytometry. (d-e) Percentage of splenic KLRG1+ cells in CD4+FOXP3+CD25+ T cells (d) or in CD4+ T cells (e) from 2- (n = 3), 9- (n = 4), 17- (n = 4) and 21- (n = 4) month-old mice. Each dot represents an individual mouse. Data are presented as mean values ± SEM. Statistical analysis was performed using one-way ANOVA with post hoc Tukey’s correction [(c), (d), (e)]. *P < 0.05; **P < 0.01; ***P < 0.001; ****P < 0.0001. Exact P values and additional statistical parameters can be found in the source data. Source data
Extended Data Fig. 3
Extended Data Fig. 3. Reanalysis of publicly available scRNAseq data identifies kTregs with a pro-inflammatory signature.
(a) UMAP representation and clustering of a new analysis of publicly available scRNAseq data from CD4+ T cells from young and old mice. Clusters are colored as naïve (blue), rTregs (yellow), aTregs (orange), kTregs (red), TEM (light green), cytotoxic (brown) and exhausted (dark green). (b) Quantification of the percentage of kTreg cells in young and old mice (n = 4 mice per group). (c) Comparative expression of genes related to Treg function in aTreg and kTreg (n = 4 mice per group). (d) Violin plots showing the expression of several pro-inflammatory markers in each cluster of CD4+ T cells (n = 4 mice per group). Each dot represents an individual mouse. Box-and-whisker plots show the median, the maximum, the minimum and 25th and 75th percentiles. Statistical analysis was performed using two-tailed unpaired Welch’s t test (b). Exact P values and additional statistical parameters can be found in the source data. Source data
Extended Data Fig. 4
Extended Data Fig. 4. Analysis of the expression of different transcription factors in the Treg subsets.
Representative histograms and quantifications of the expression of different transcription factors by flow cytometry in splenic rTreg (yellow), aTreg (orange) and kTregs (red) from young (2-month-old) mice (n = 6 mice per group) measured as gMFI. gMFI values are relative to the MFI in rTregs (n = 6 per group). gMFI: Geometric Mean Fluorescence Intensity. Each dot represents an individual mouse. Data are presented as mean values ± SEM. Statistical analysis was performed using Friedman test with post hoc Dunn’s correction. *P < 0.05; **P < 0.01; ***P < 0.001; ****P < 0.0001. Exact P values and additional statistical parameters can be found in the source data. Source data
Extended Data Fig. 5
Extended Data Fig. 5. KLRG1+ Tregs show a pro-inflammatory phenotype and induce inflammation.
(a-b) In vitro assessment of the suppressive activity of KLRG1+ Tregs. KLRG1- or KLRG1+ Tregs were sorted from old (22-month-old) and co-cultured with CD45.1 naïve CD4+ T responder cells labelled with CellTrace Violet at 2:1 ratio (2 naïve:1 Treg) for 72 h in the presence of α-CD3/α-CD28 (n = 3 mice). (a) Representative histogram of the CellTrace Violet signal measured by flow cytometry in CD45.1 CD4+ T conventional responder cells after 72 h of culture. (b) Quantification of the capacity of KLRG1- and KLRG1+ Treg cells to suppress the proliferation of CD45.1 CD4+ responder T cells. The percentage of suppression was determined as: 100 − (% of proliferating cells with Tregs)/(% of proliferating cells without Tregs). (c) Representative histograms and quantifications of the expression of different cytokines by flow cytometry in splenic rTreg (yellow), aTreg (orange) and kTregs (red) from old (21-month-old) mice measured as gMFI. gMFI values are relative to the MFI in rTregs (n = 6 mice per group). (d-e) Analysis of the secretion of different cytokines by the Treg subsets in activating conditions using multiplex. Treg subsets were sorted from young mice injected with IL-2 + IL-33 and incubated during 24 h in the presence of α-CD3/α-CD28 before the assay (n = 3 mice). (d) Heatmap and statistical comparisons of the secretion of different cytokines by rTreg, aTreg and kTregs. Heatmap values are relative to the maximum of each cytokine. (e) Quantification of IL-10, IL-6, GM-CSF and CXCL2 secreted by activated rTreg, aTreg and kTregs. (f-h) In vivo assessment of the pro-inflammatory activity of KLRG1+ Tregs: CD3ε-/- T cell deficient mice were injected with splenic KLRG1- or KLRG1+ Tregs isolated from young mice injected with IL-2 + IL-33. The mice were analyzed four months after the adoptive transfer (n = 3 mice per group). (f) Schematic diagram depicting the adoptive transfer of kTregs. (g) Spleen weight from CD3ε-/- mice non-injected or injected with KLRG1- or KLRG1+ T cells. (h) Quantification of the percentage of circulating neutrophils or basophils in CD3ε-/- mice non-injected or injected with KLRG1- or KLRG1+ T cells. gMFI: Geometric Mean Fluorescence Intensity. Each dot represents an individual mouse. Data are presented as mean values ± SEM. Statistical analysis was performed using two-tailed unpaired Student’s t test (b), Friedman test with post hoc Dunn’s correction [(c), (e): IL-6], RM one-way ANOVA with post hoc Tukey’s correction [(d); (e): IL10, GM-CSF, CXCL2] or ANOVA with post hoc Tukey’s correction [(g), (h)]. *P < 0.05; **P < 0.01; ***P < 0.001; ****P < 0.0001. Exact P values and additional statistical parameters can be found in the source data. Source data
Extended Data Fig. 6
Extended Data Fig. 6. Gating strategy to identify KLRG1+ Tregs in human PBMCs.
Gating strategy followed to identify KLRG1+ Tregs (CD45+CD3+CD4+CD8-CD25+IL7R-KLRG1+) in human PBMCs.

References

    1. Franceschi, C. & Campisi, J. Chronic inflammation (inflammaging) and its potential contribution to age-associated diseases. J. Gerontol. A69, S4–S9 (2014). - PubMed
    1. Ferrucci, L. & Fabbri, E. Inflammageing: chronic inflammation in ageing, cardiovascular disease, and frailty. Nat. Rev. Cardiol.15, 505–522 (2018). - PMC - PubMed
    1. Goronzy, J. J. & Weyand, C. M. Immune aging and autoimmunity. Cell. Mol. Life Sci.69, 1615–1623 (2012). - PMC - PubMed
    1. Carrasco, E. et al. The role of T cells in age-related diseases. Nat. Rev. Immunol.22, 97–111 (2022). - PubMed
    1. Elyahu, Y. et al. Aging promotes reorganization of the CD4 T cell landscape toward extreme regulatory and effector phenotypes. Sci. Adv.5, eaaw8330 (2019). - PMC - PubMed