. 2025 Jun;642(8068):766-775.
doi: 10.1038/s41586-025-08945-9. Epub 2025 Apr 30.

Selective inhibition of stromal mechanosensing suppresses cardiac fibrosis

Affiliations

Selective inhibition of stromal mechanosensing suppresses cardiac fibrosis

Sangkyun Cho et al. Nature. 2025 Jun.

Abstract

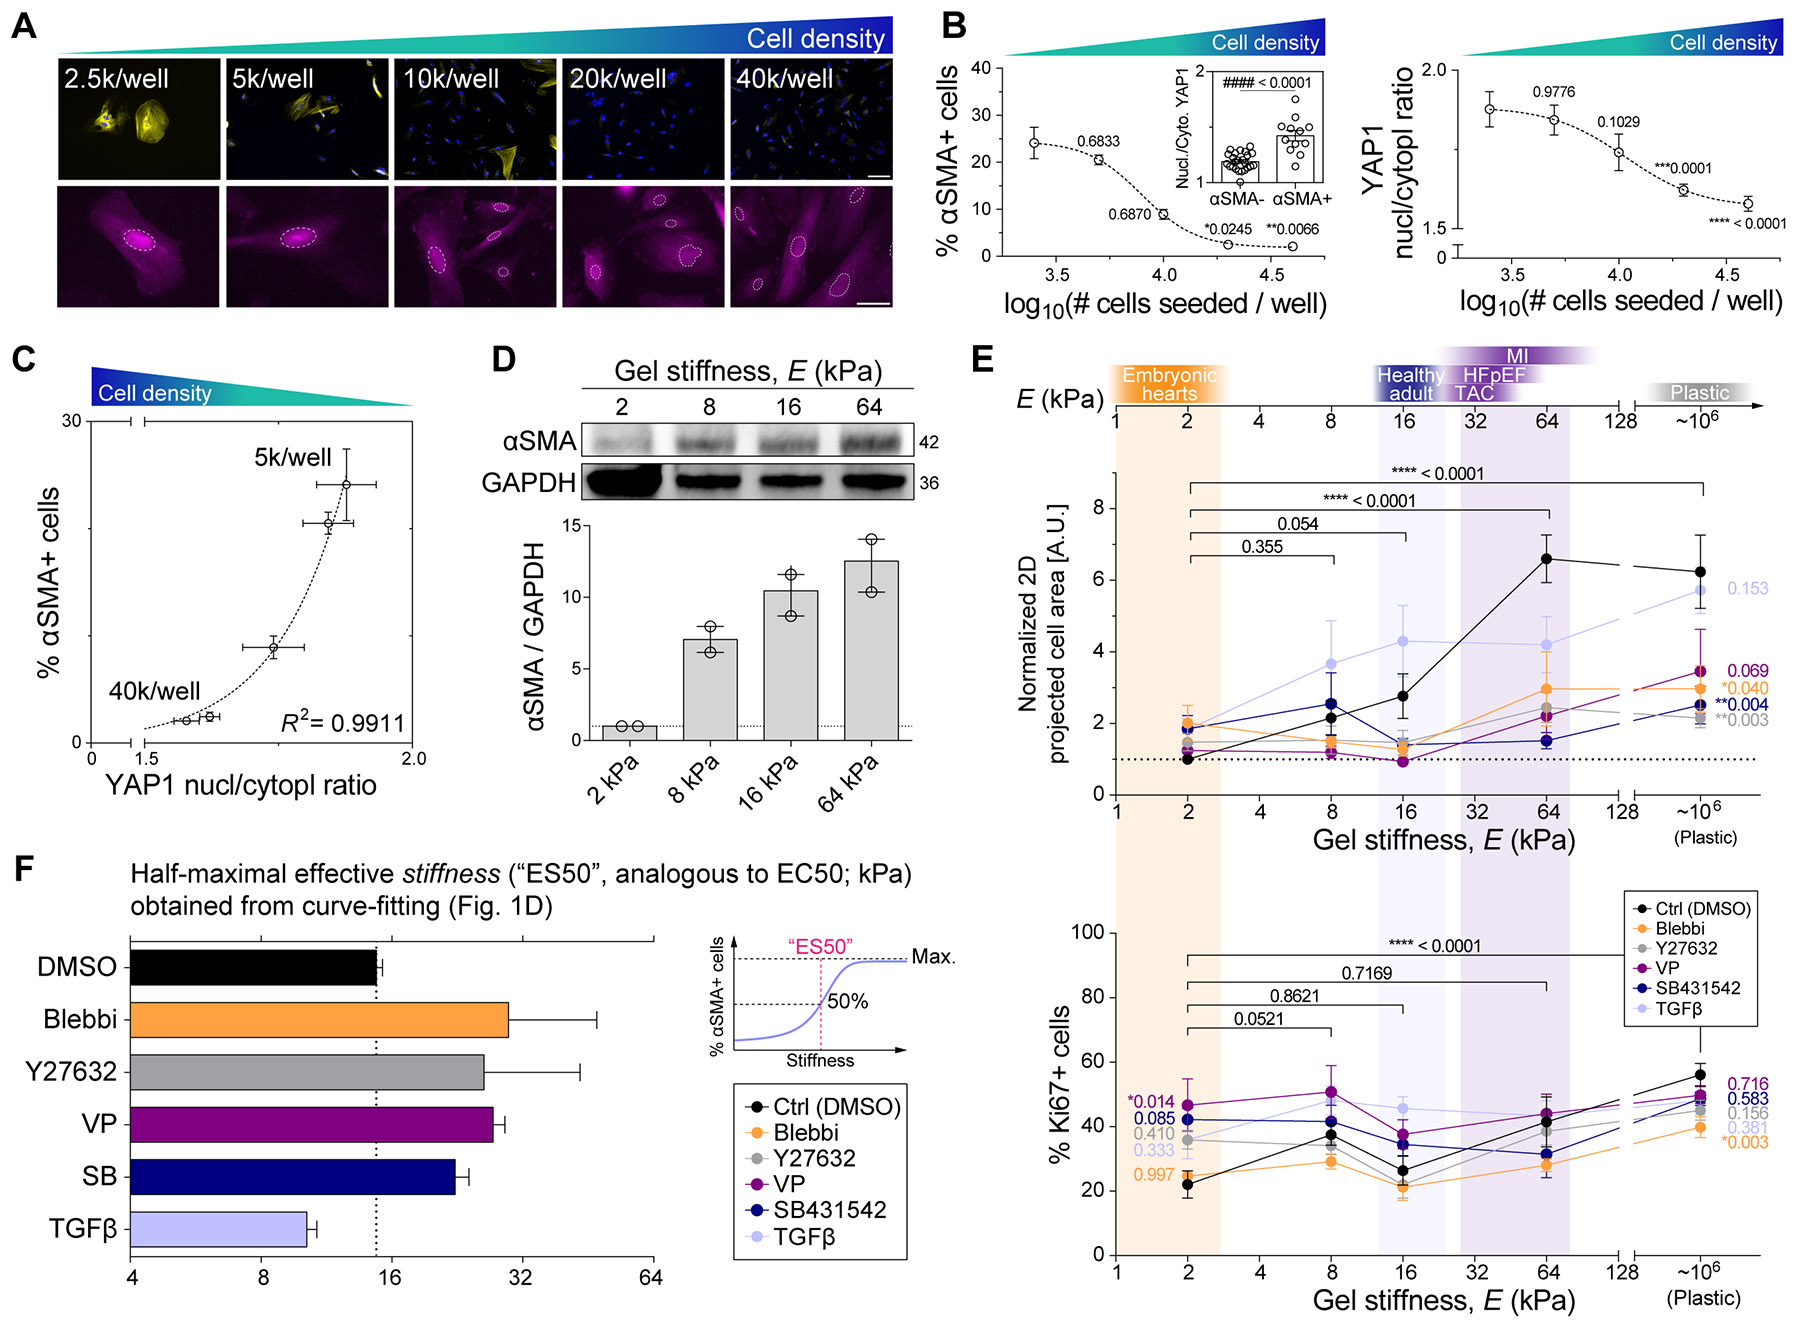
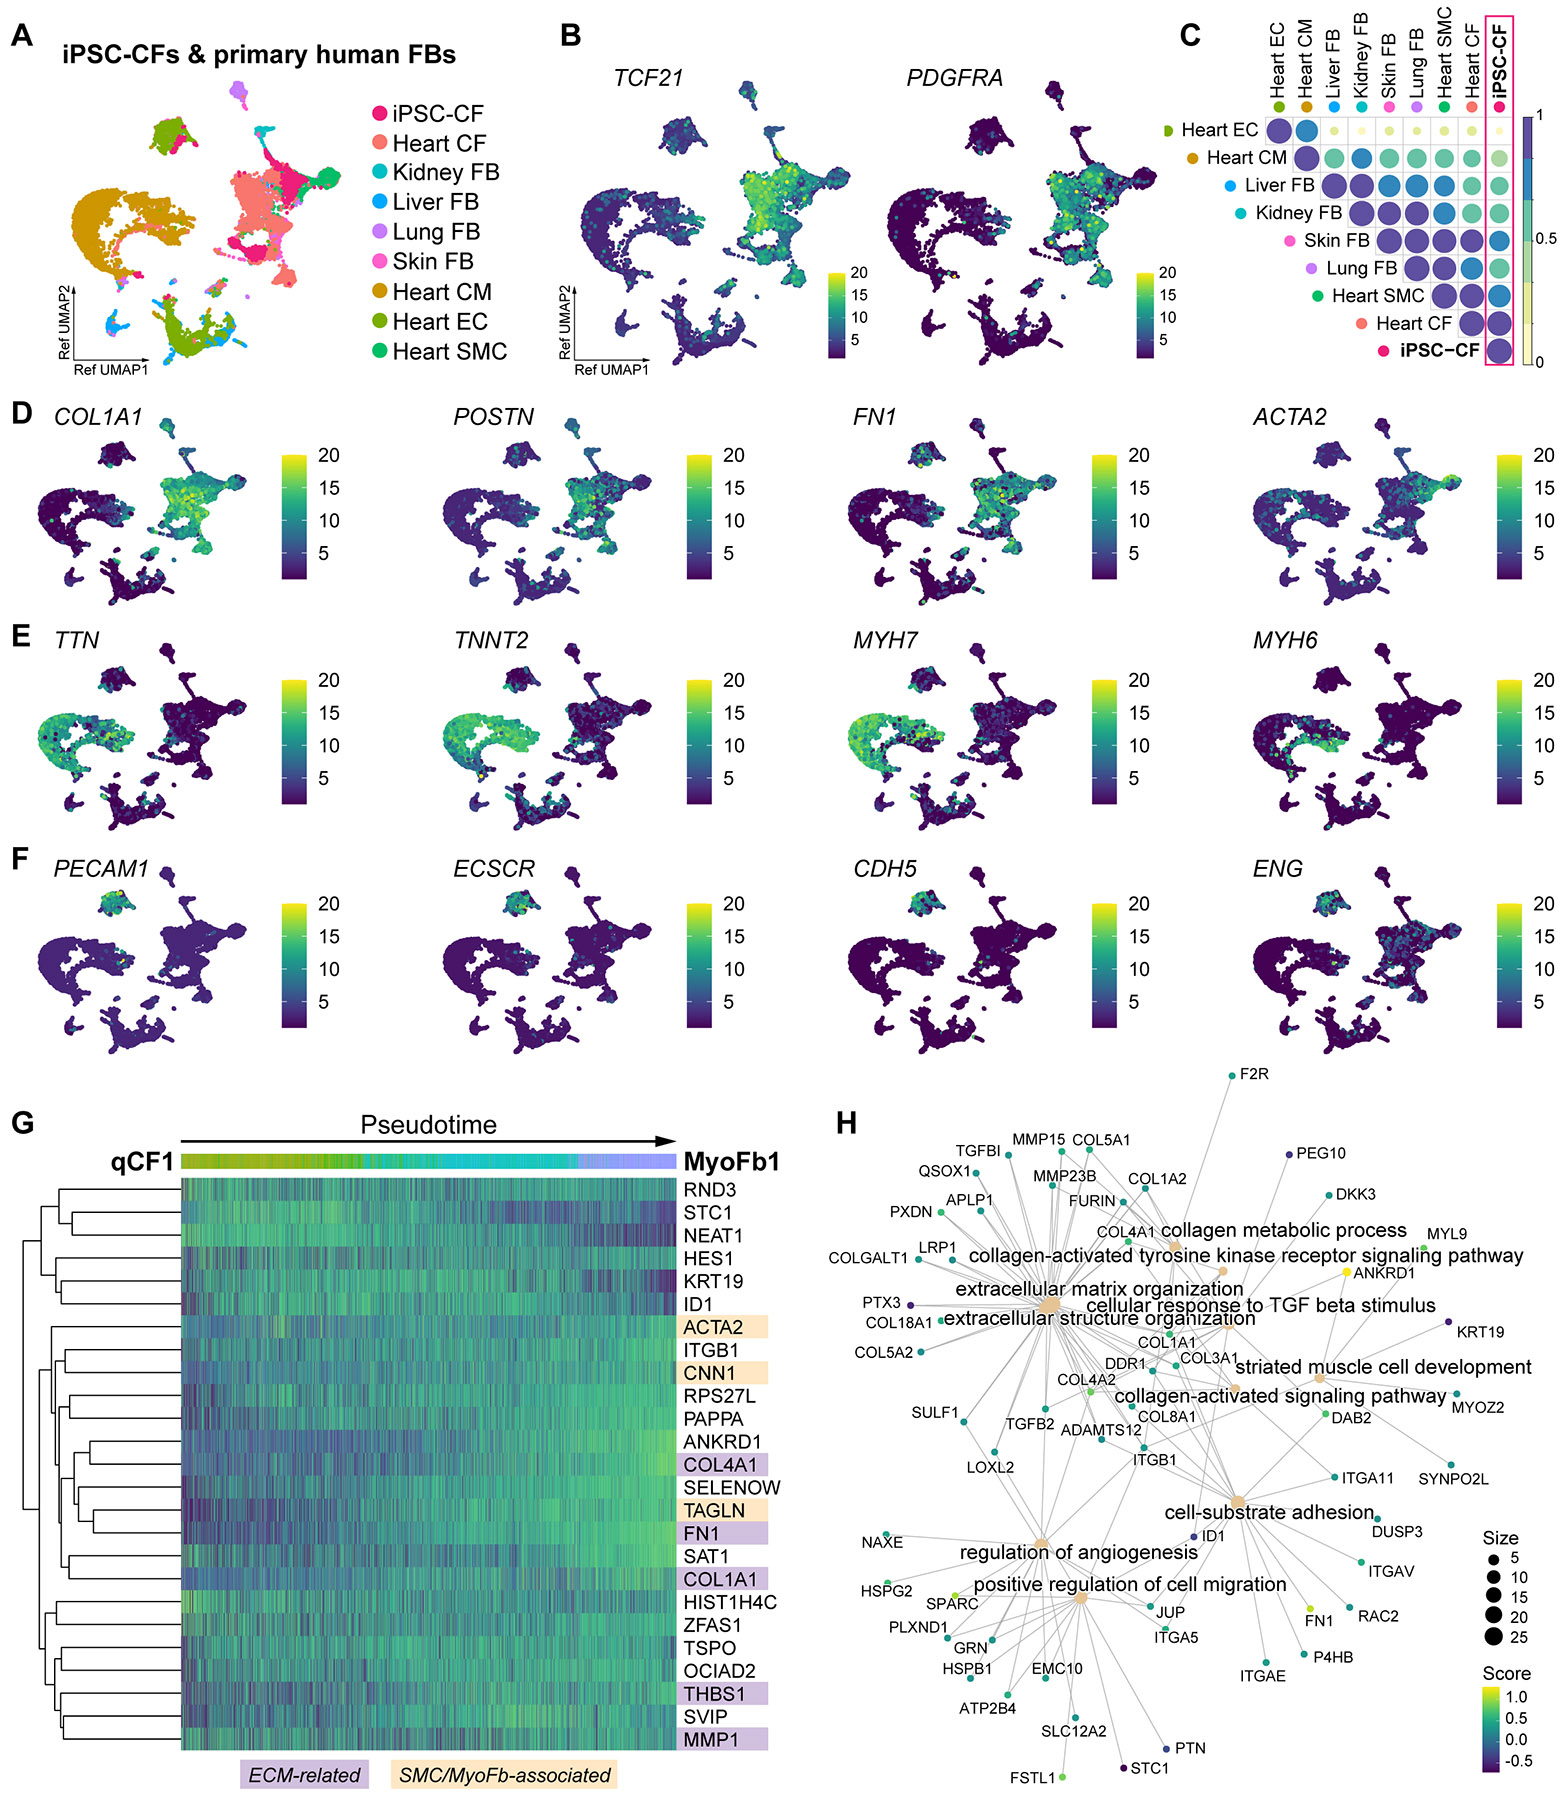
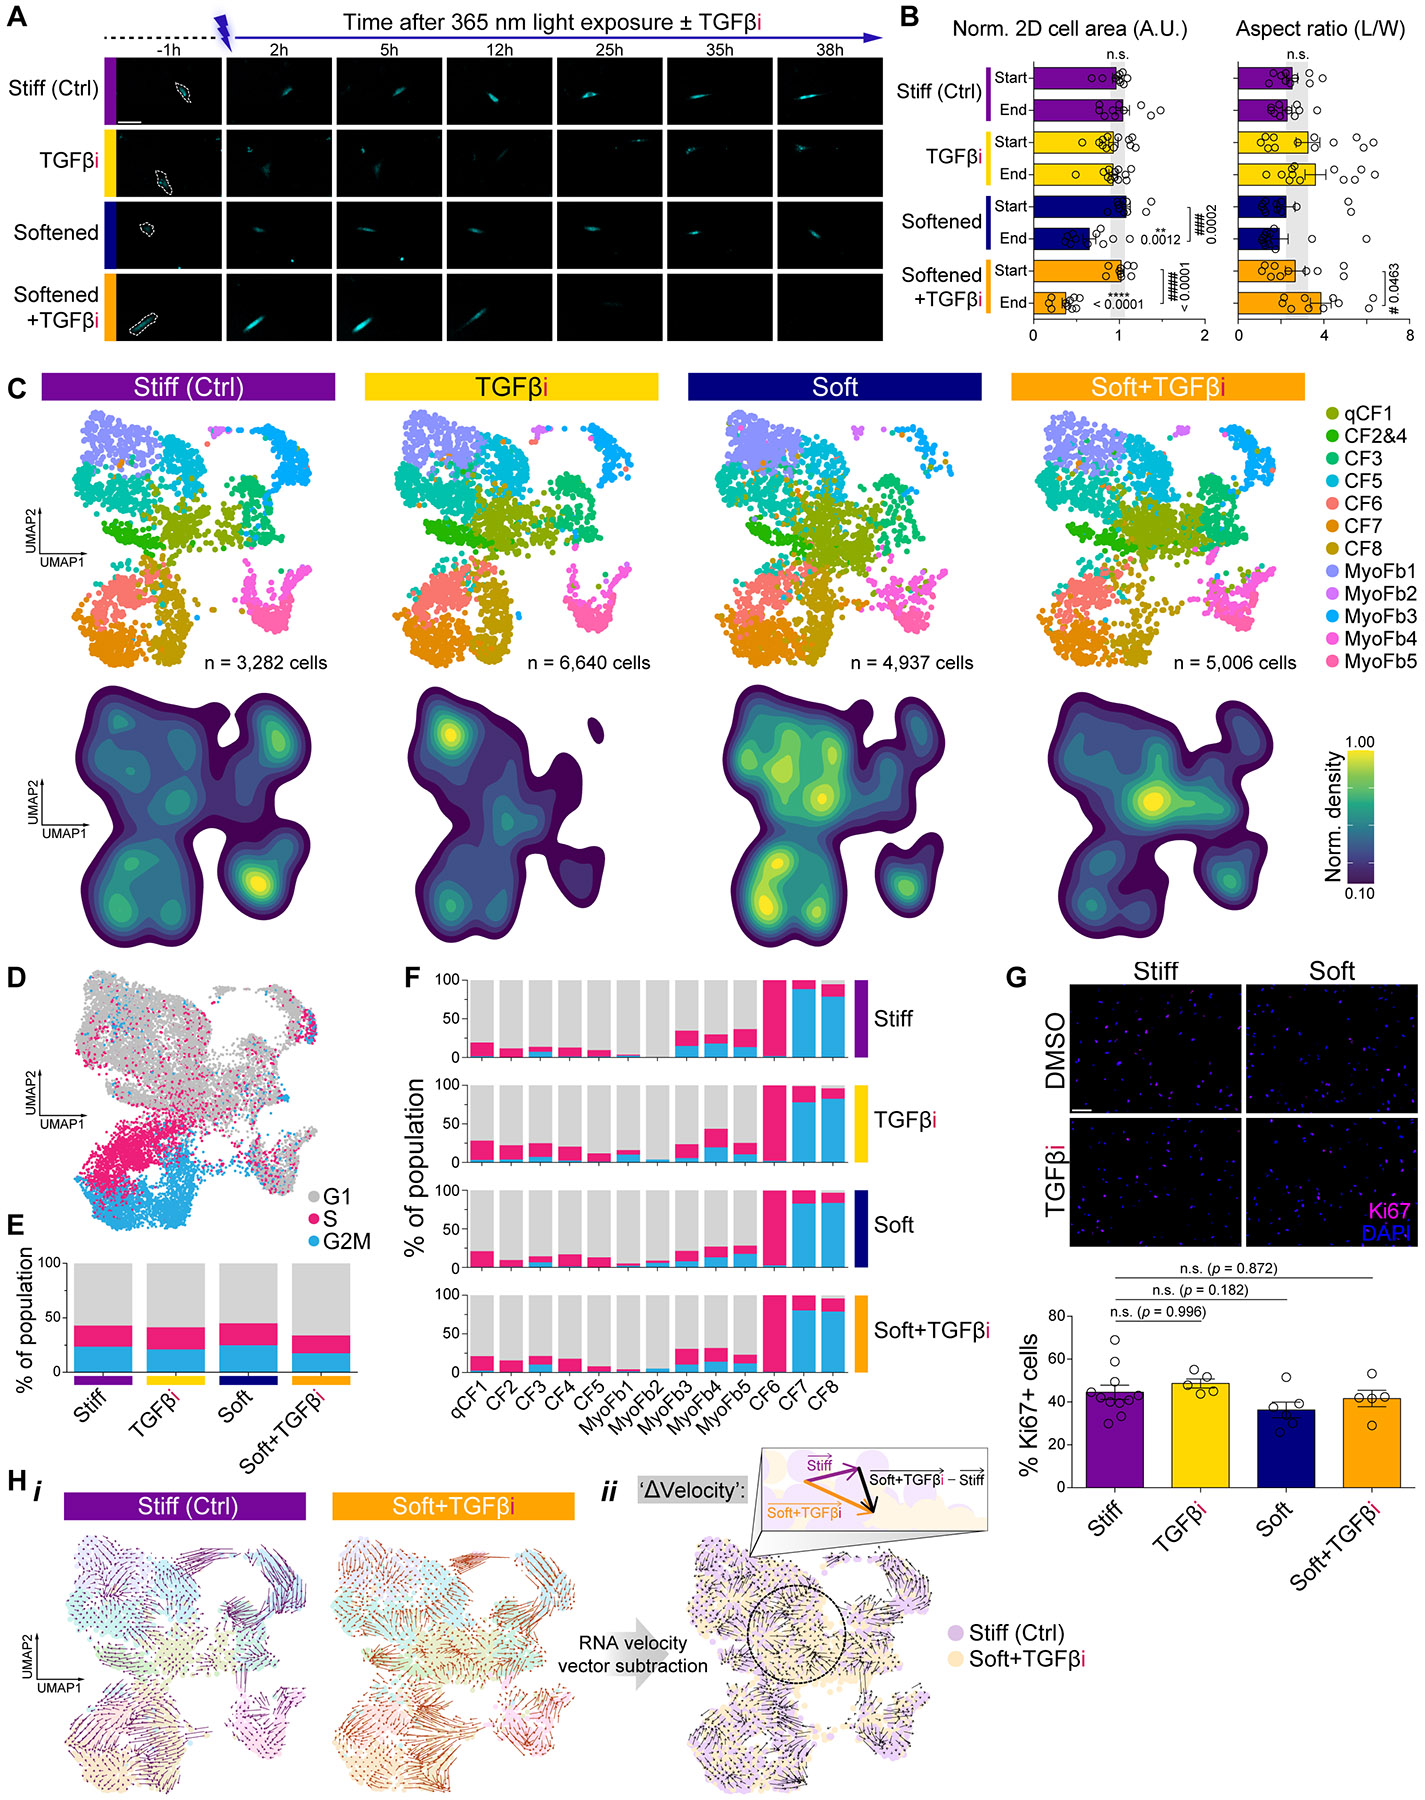
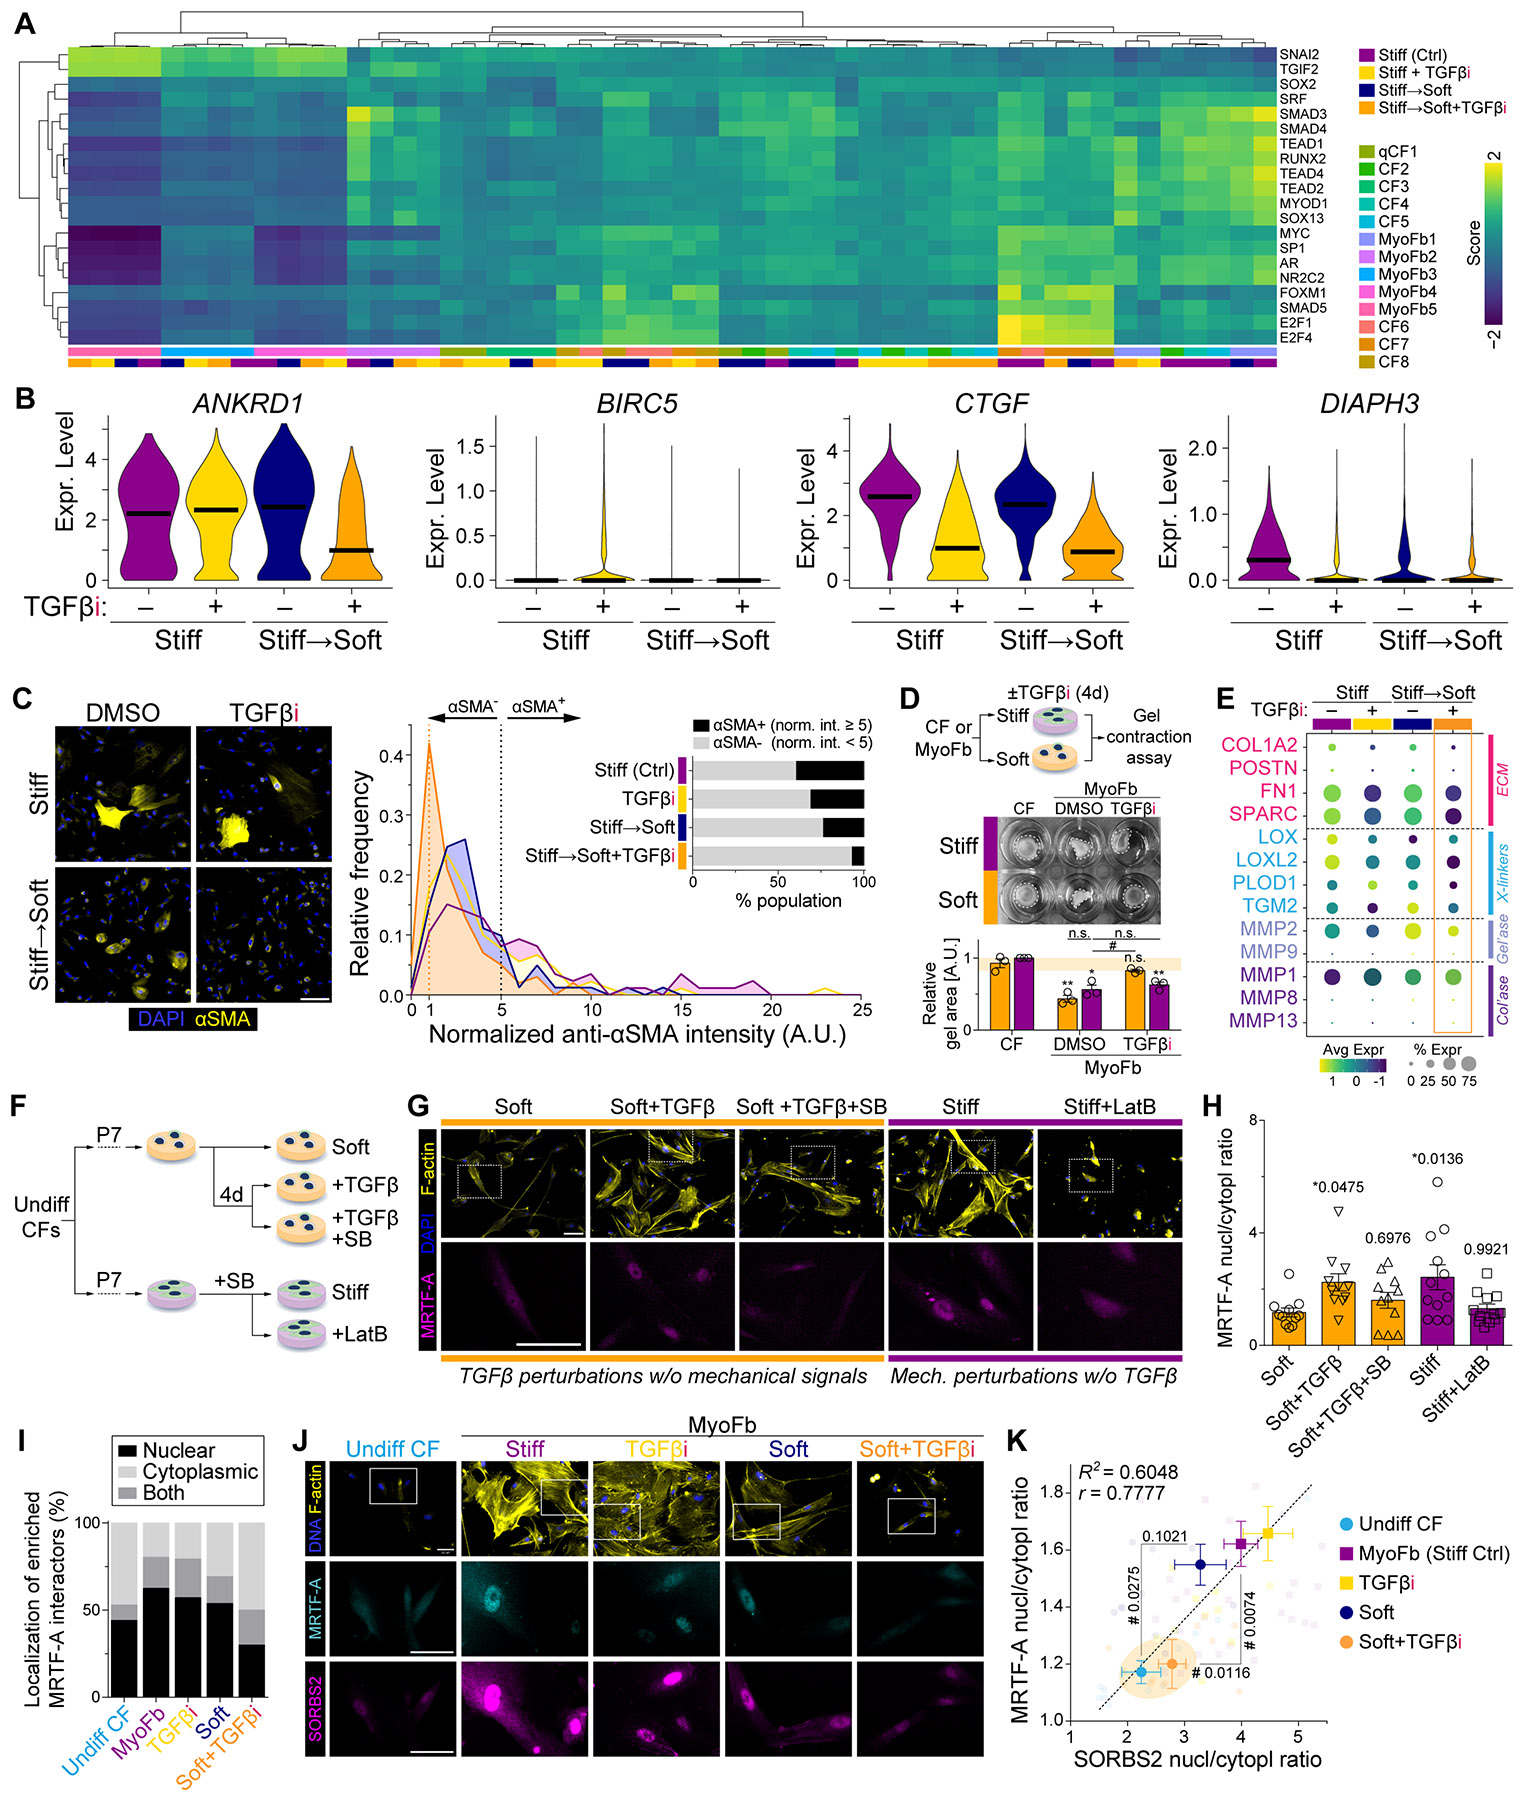
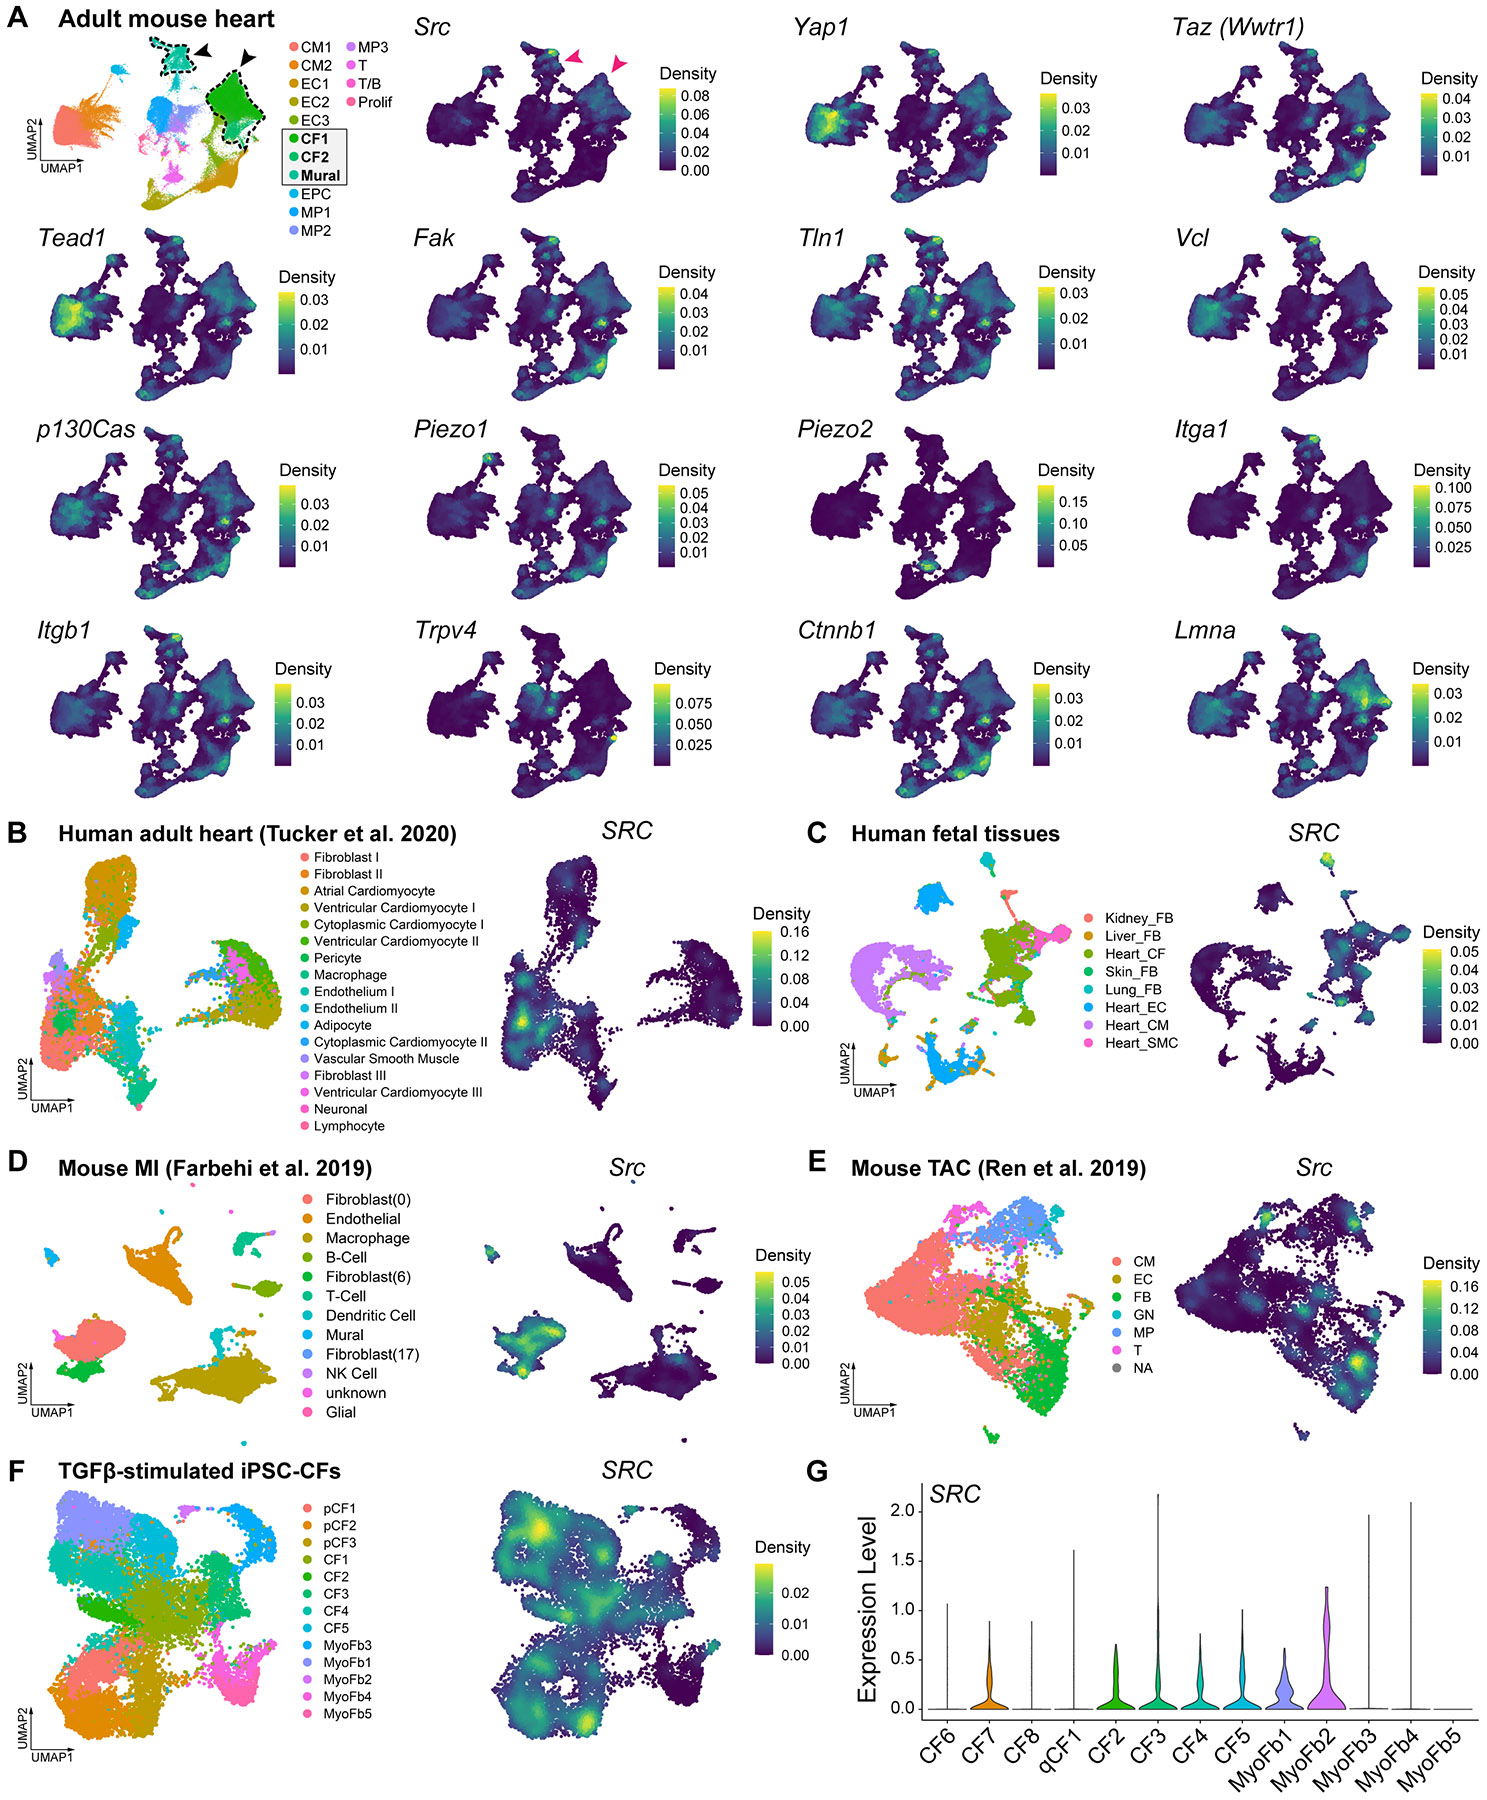
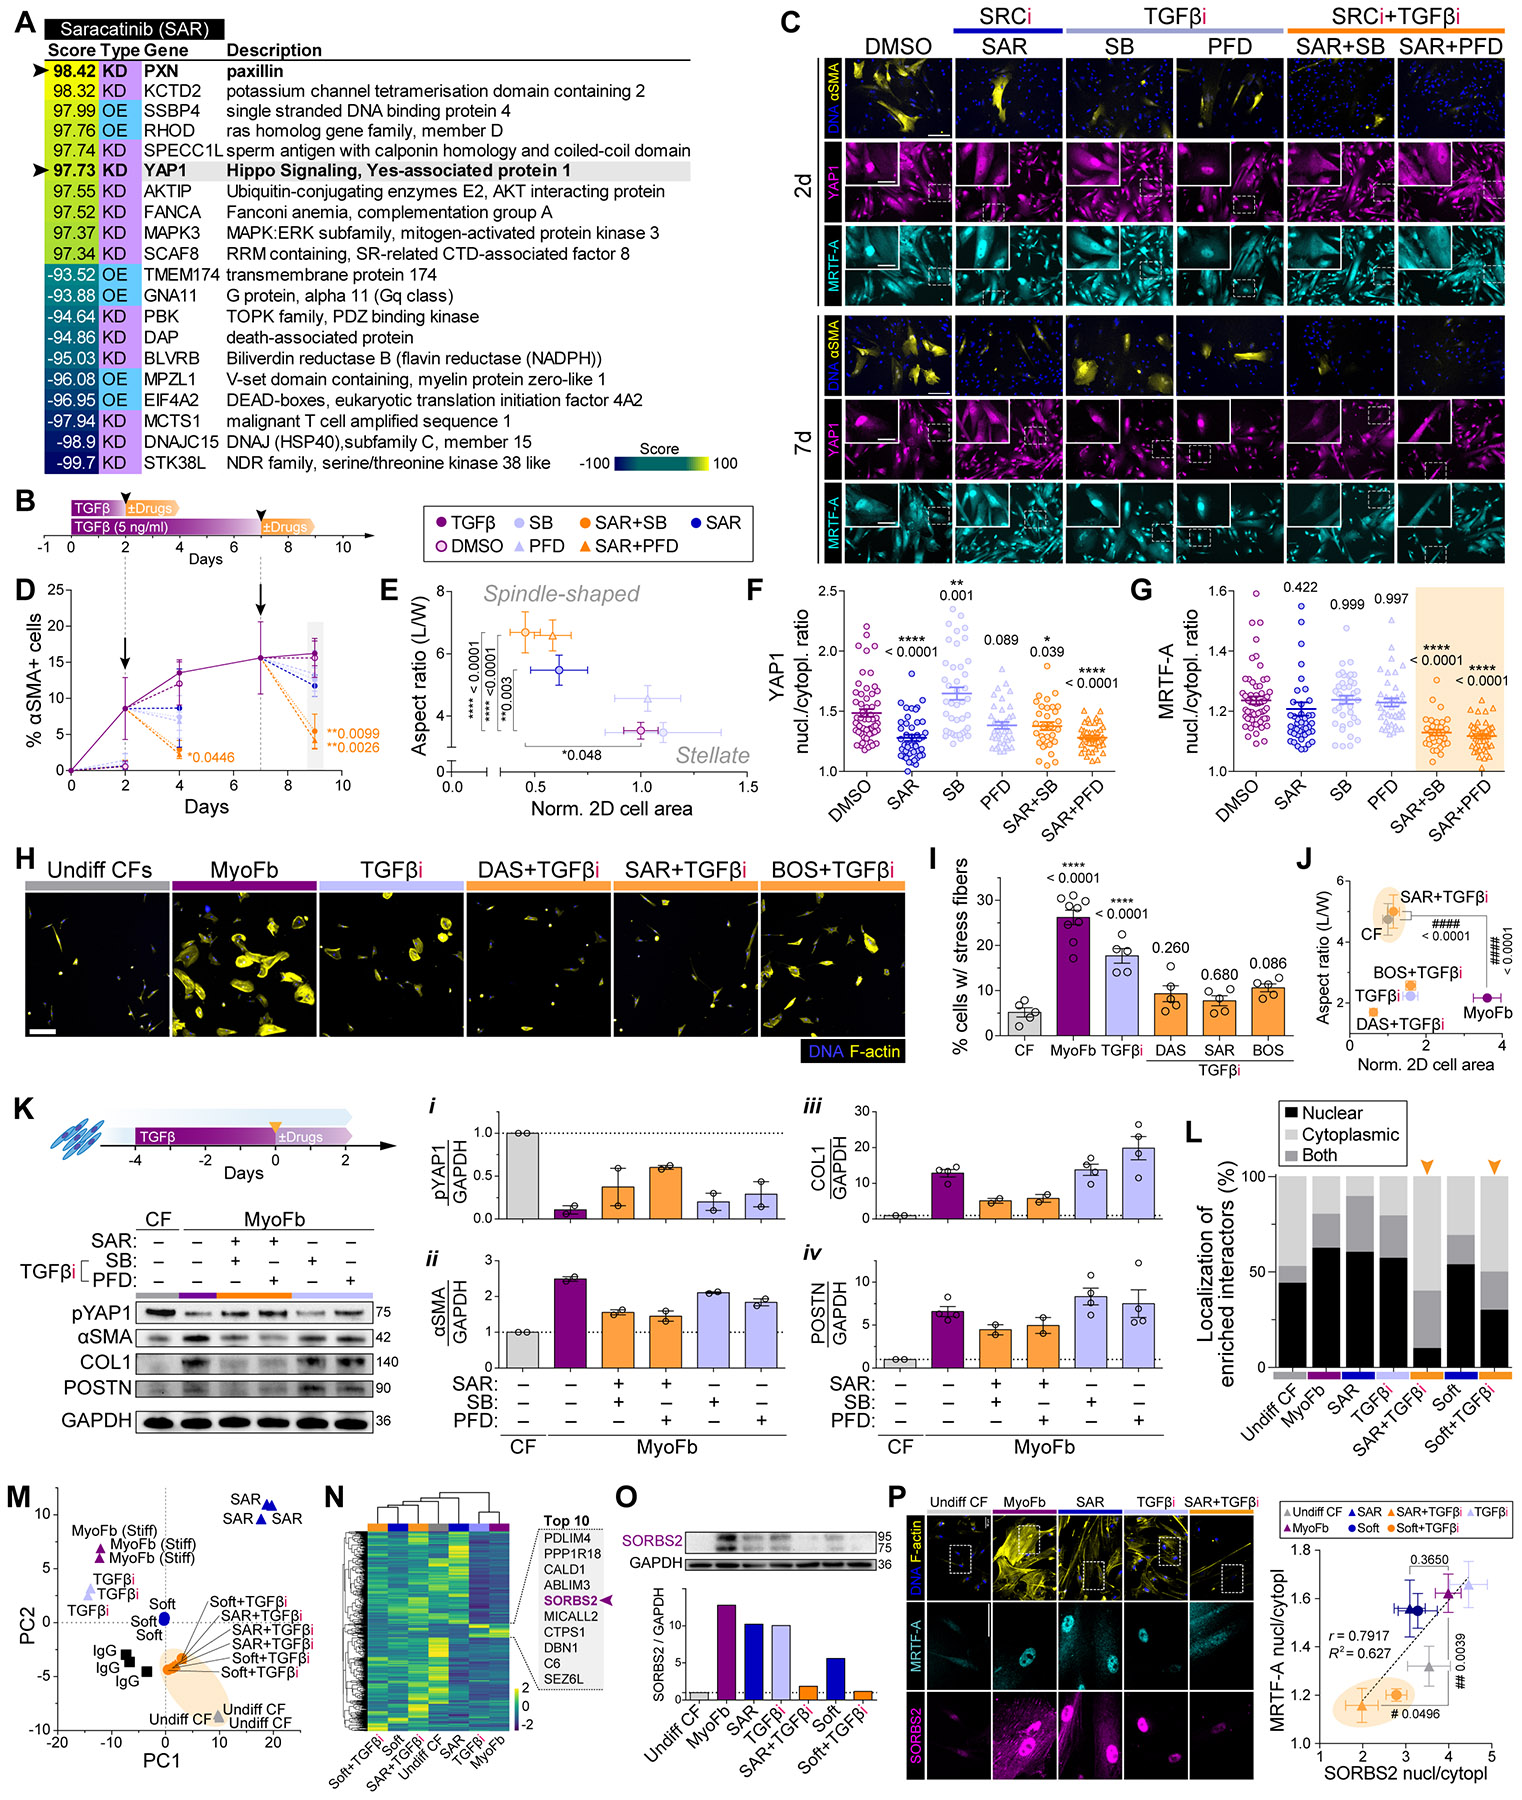
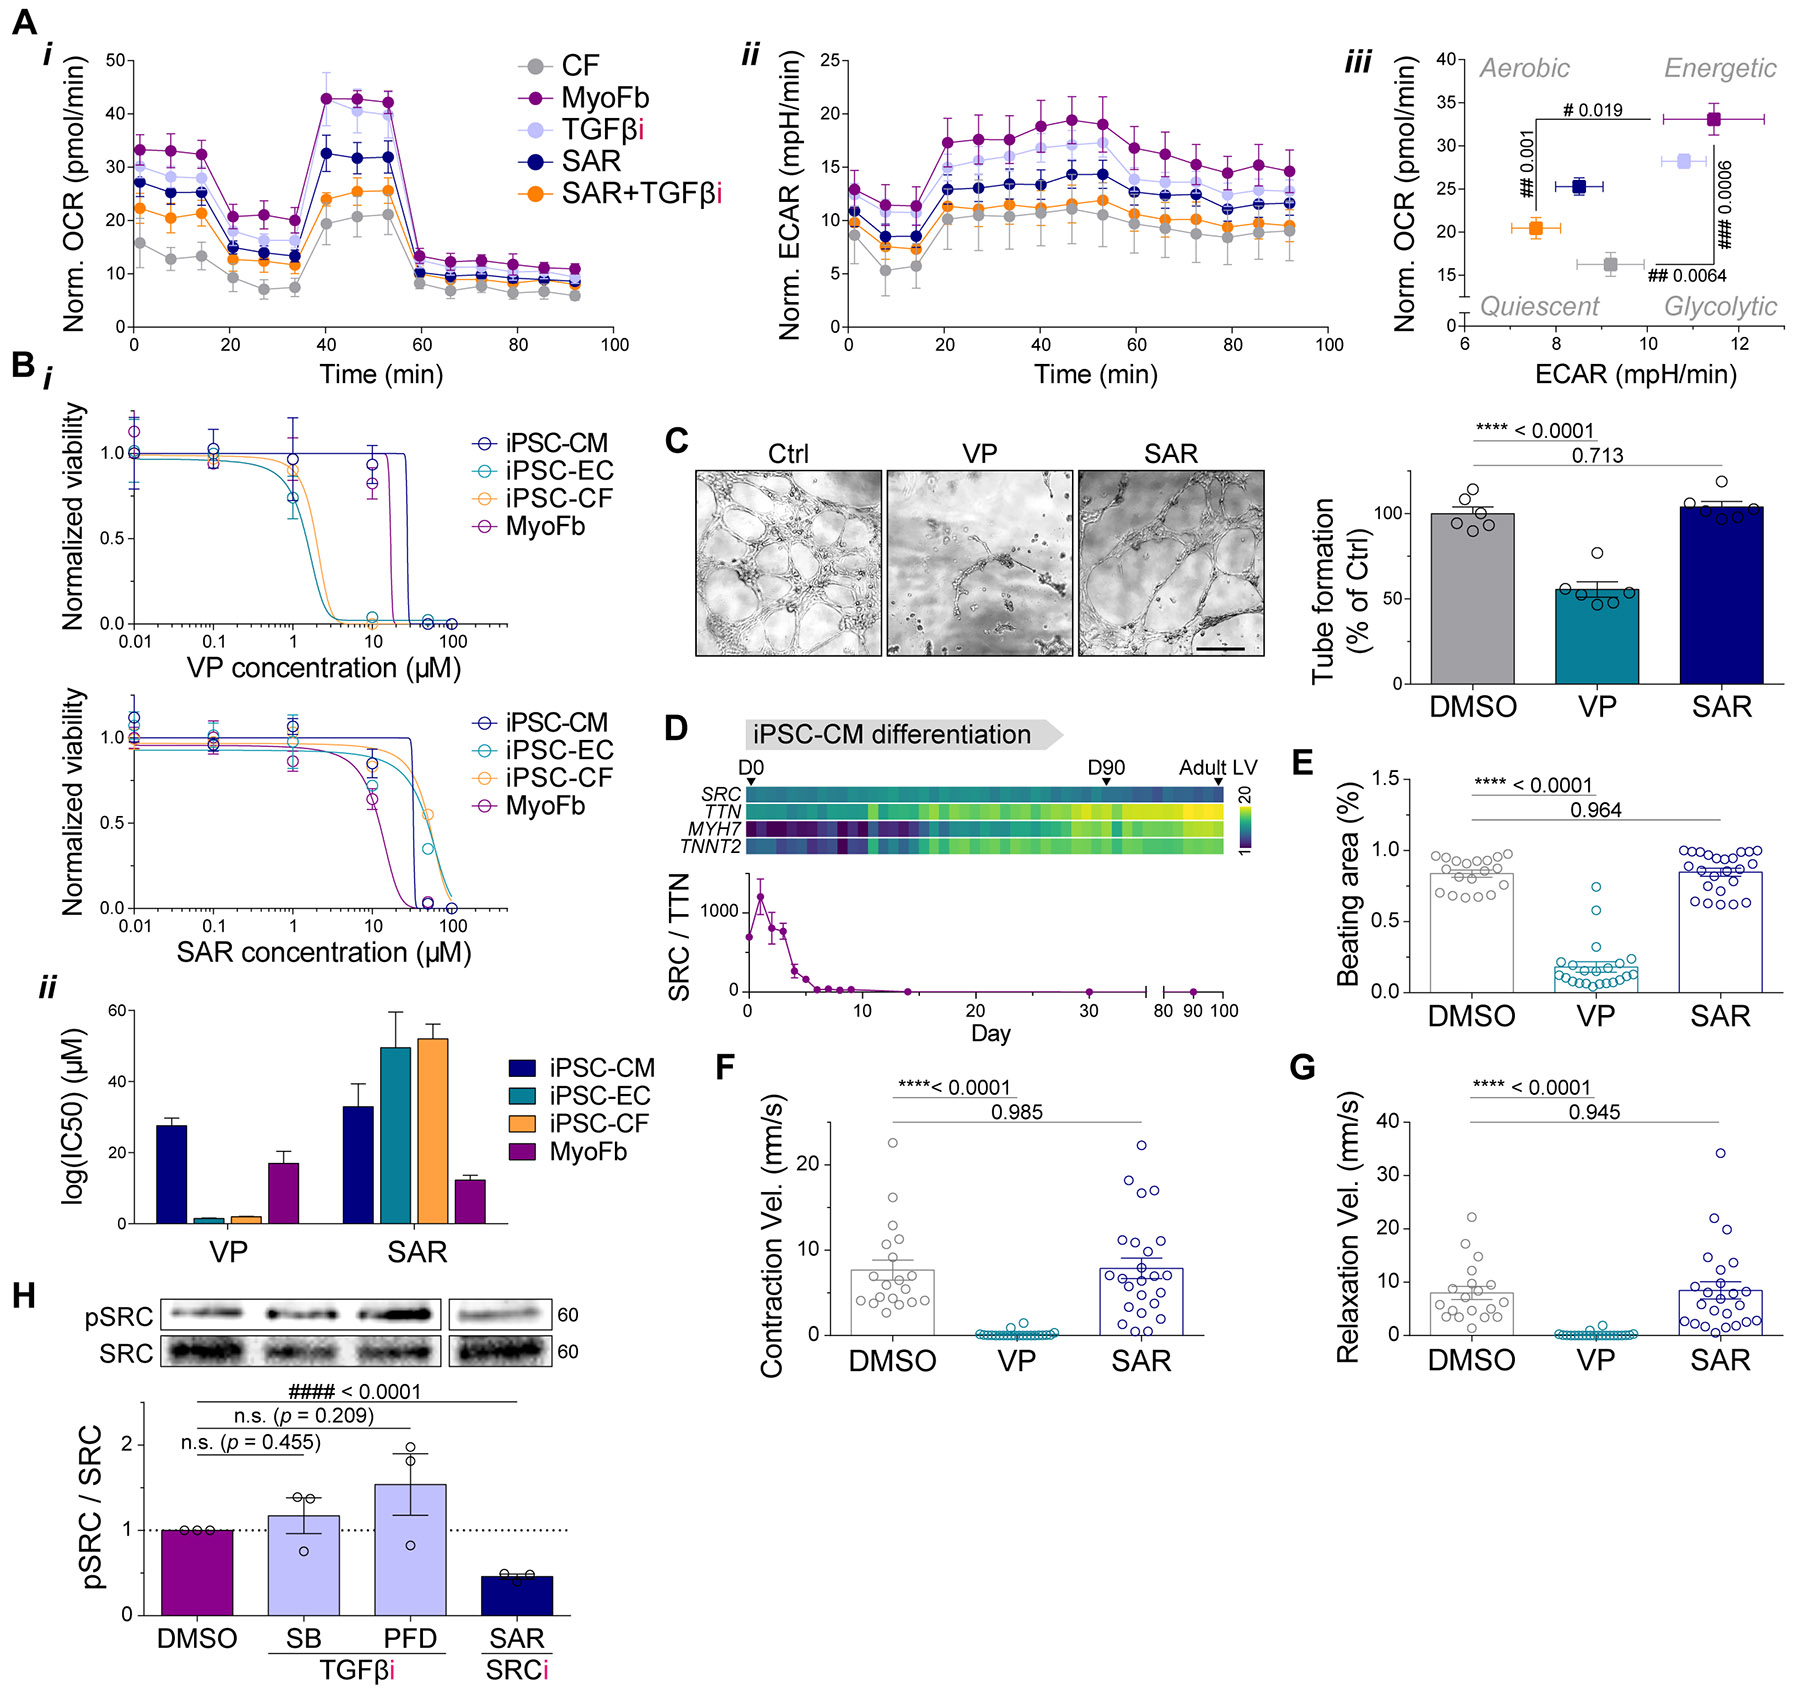
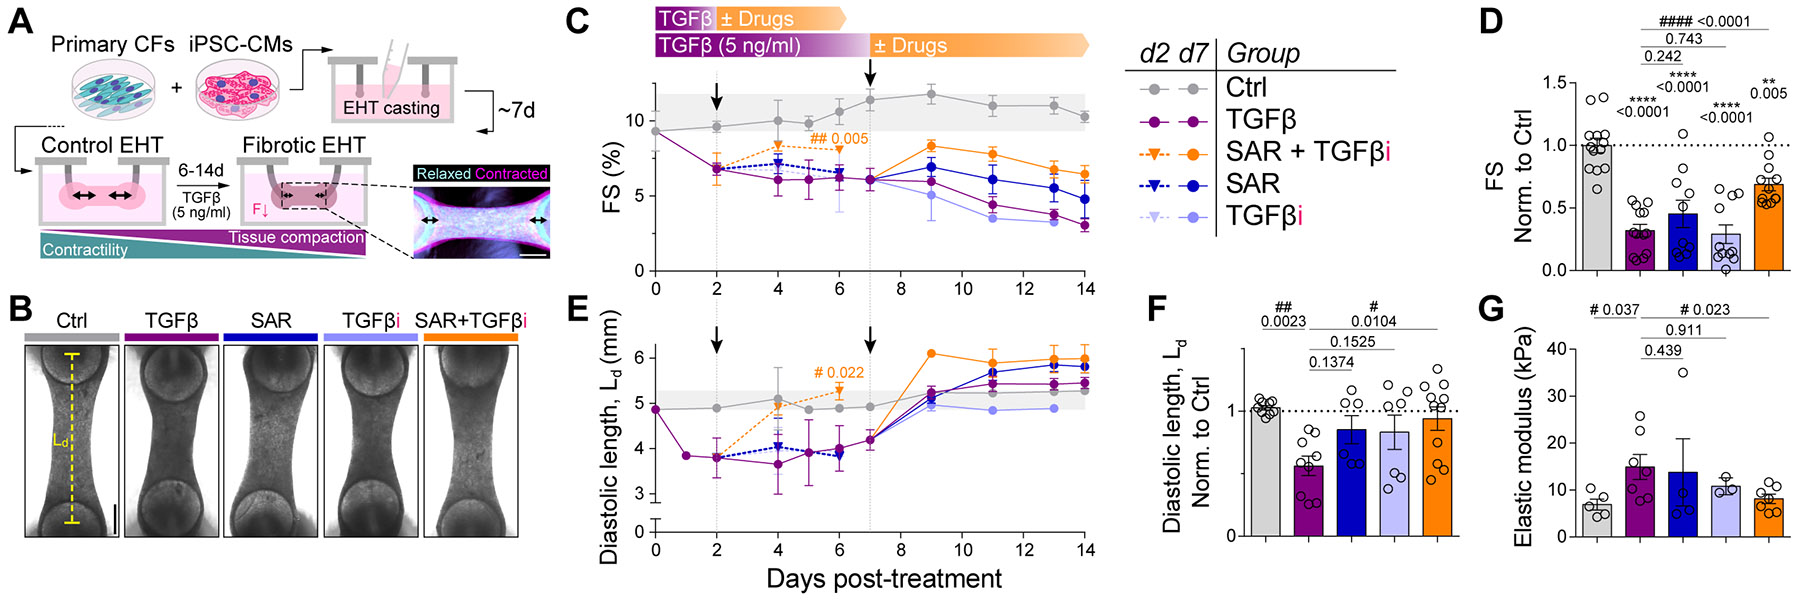
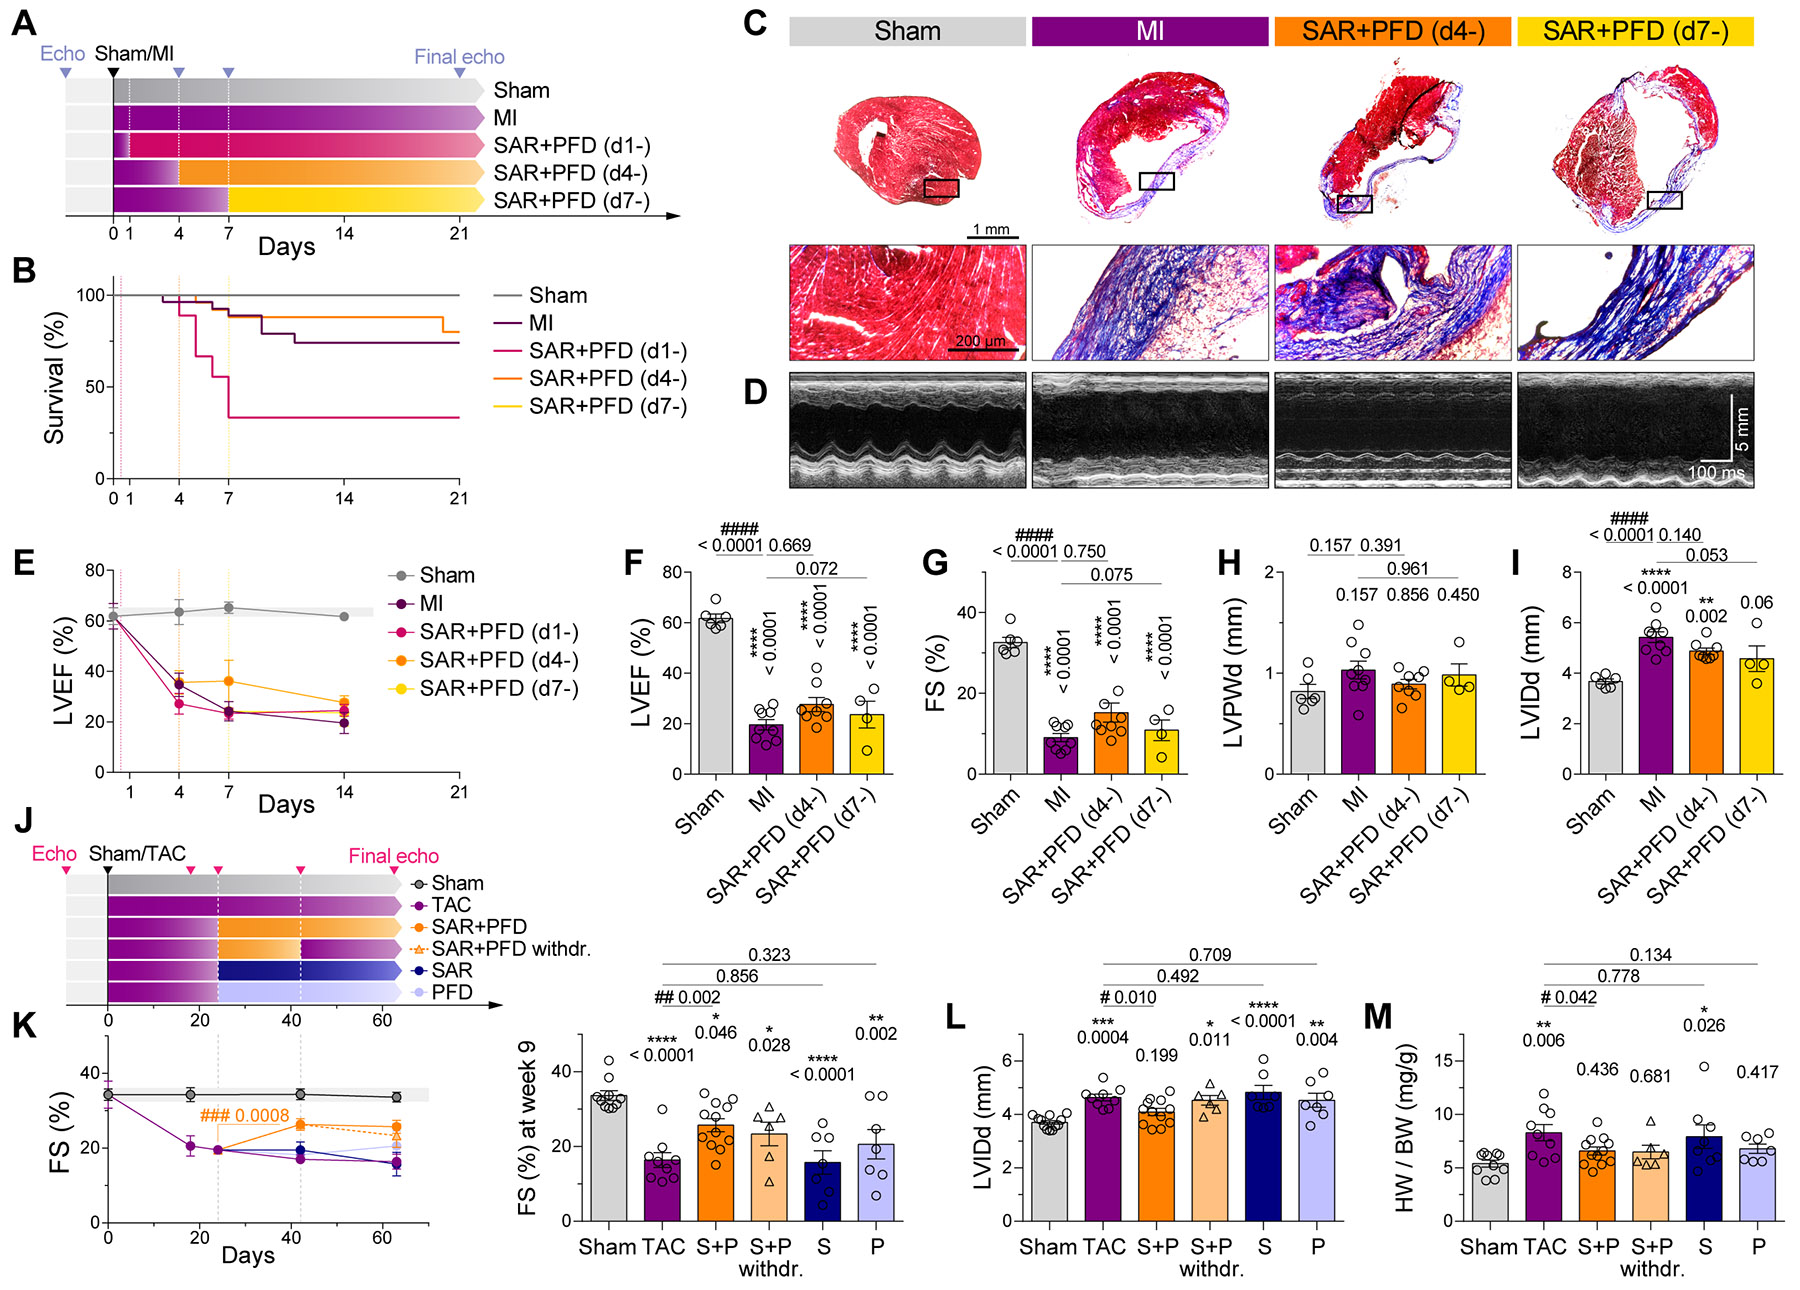
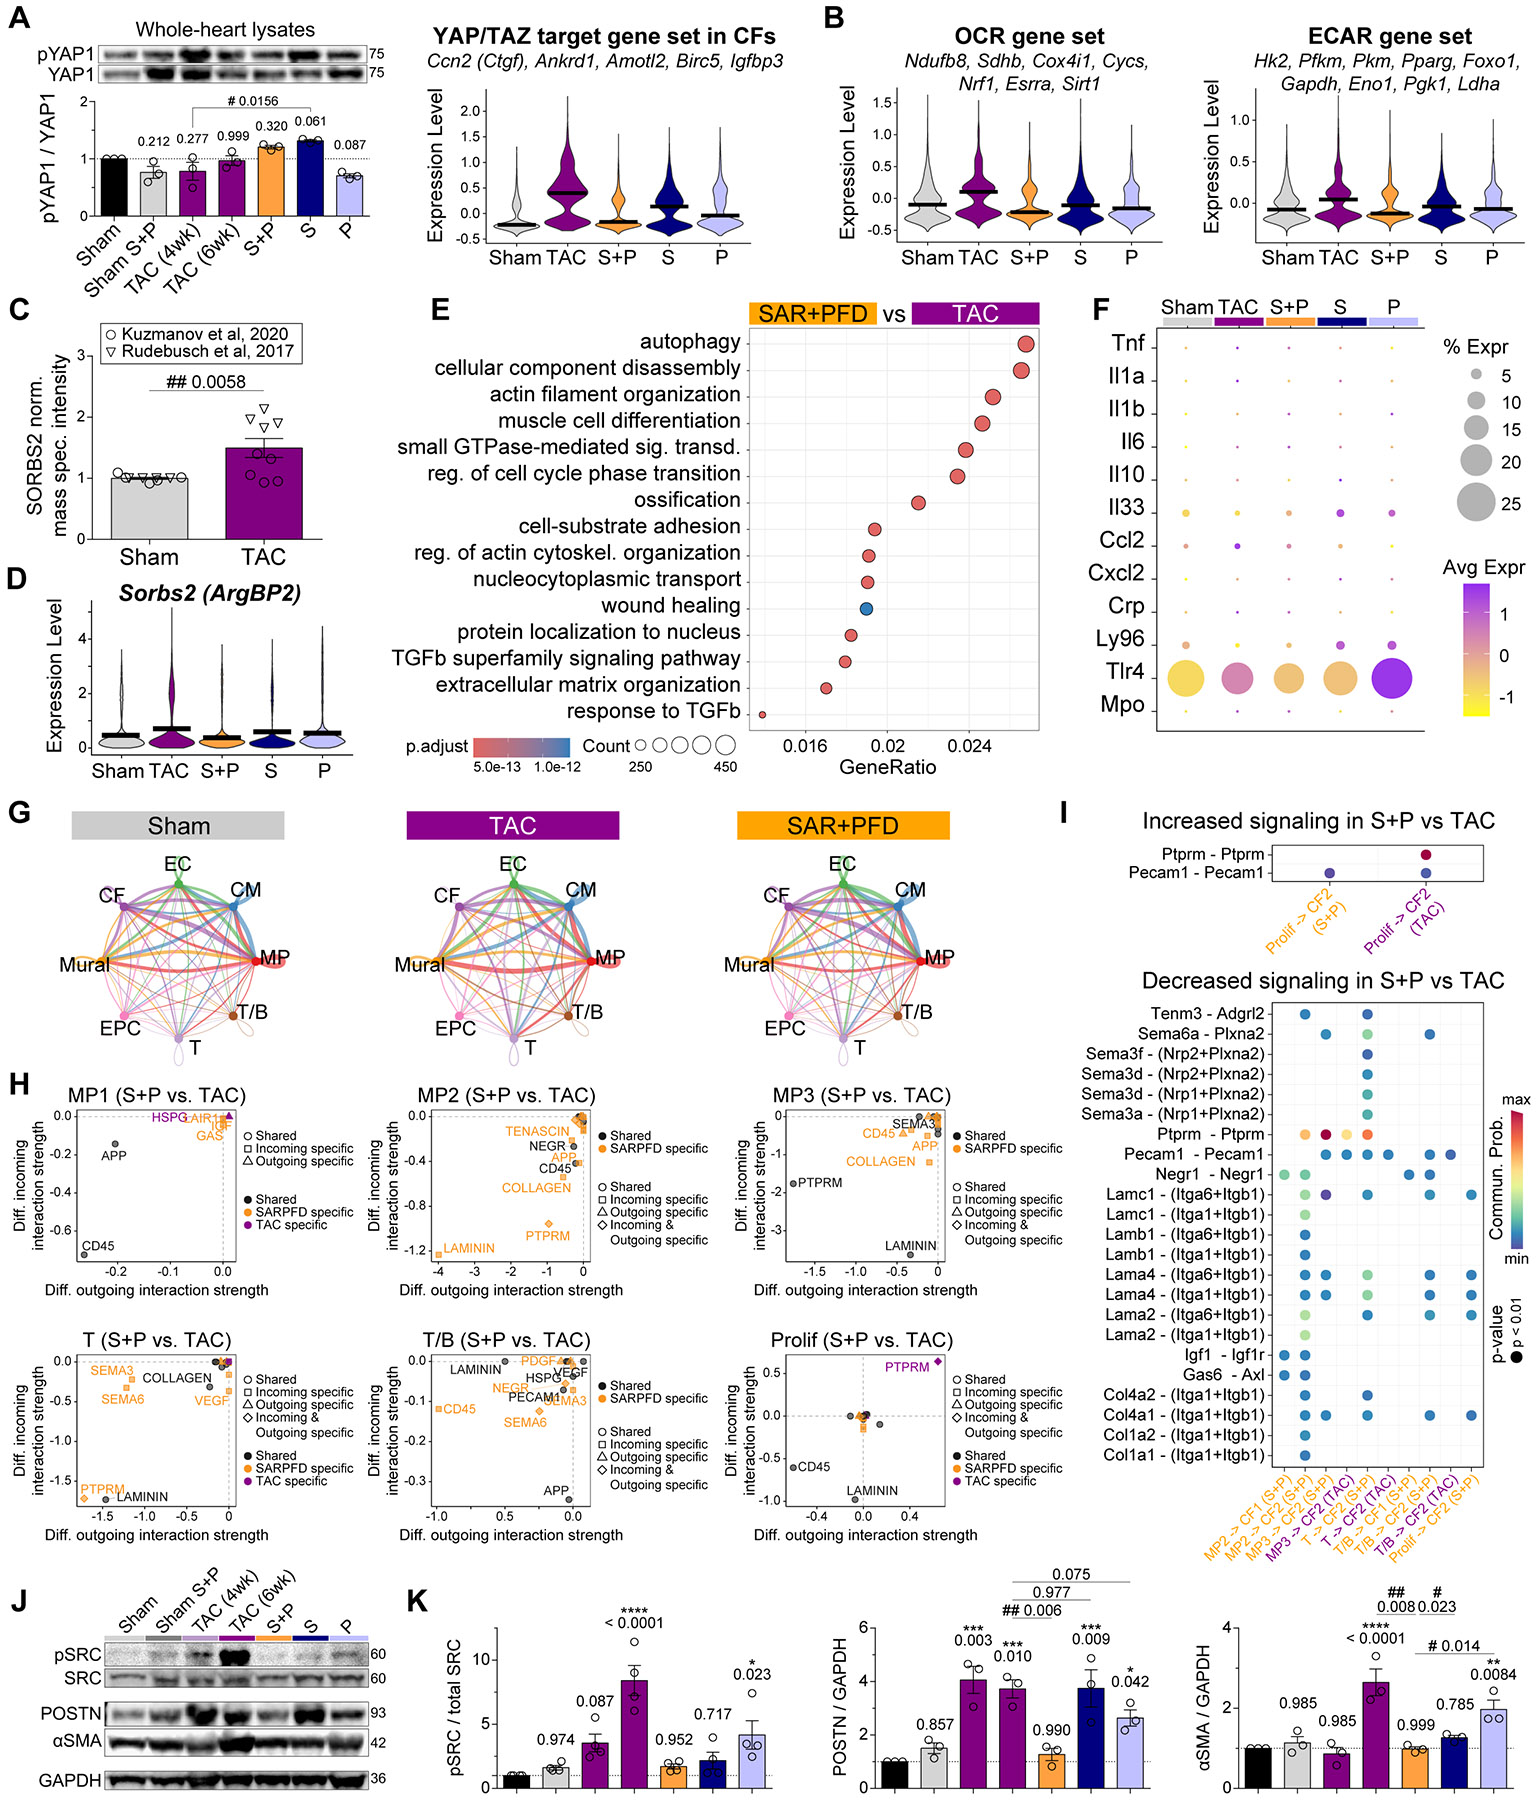
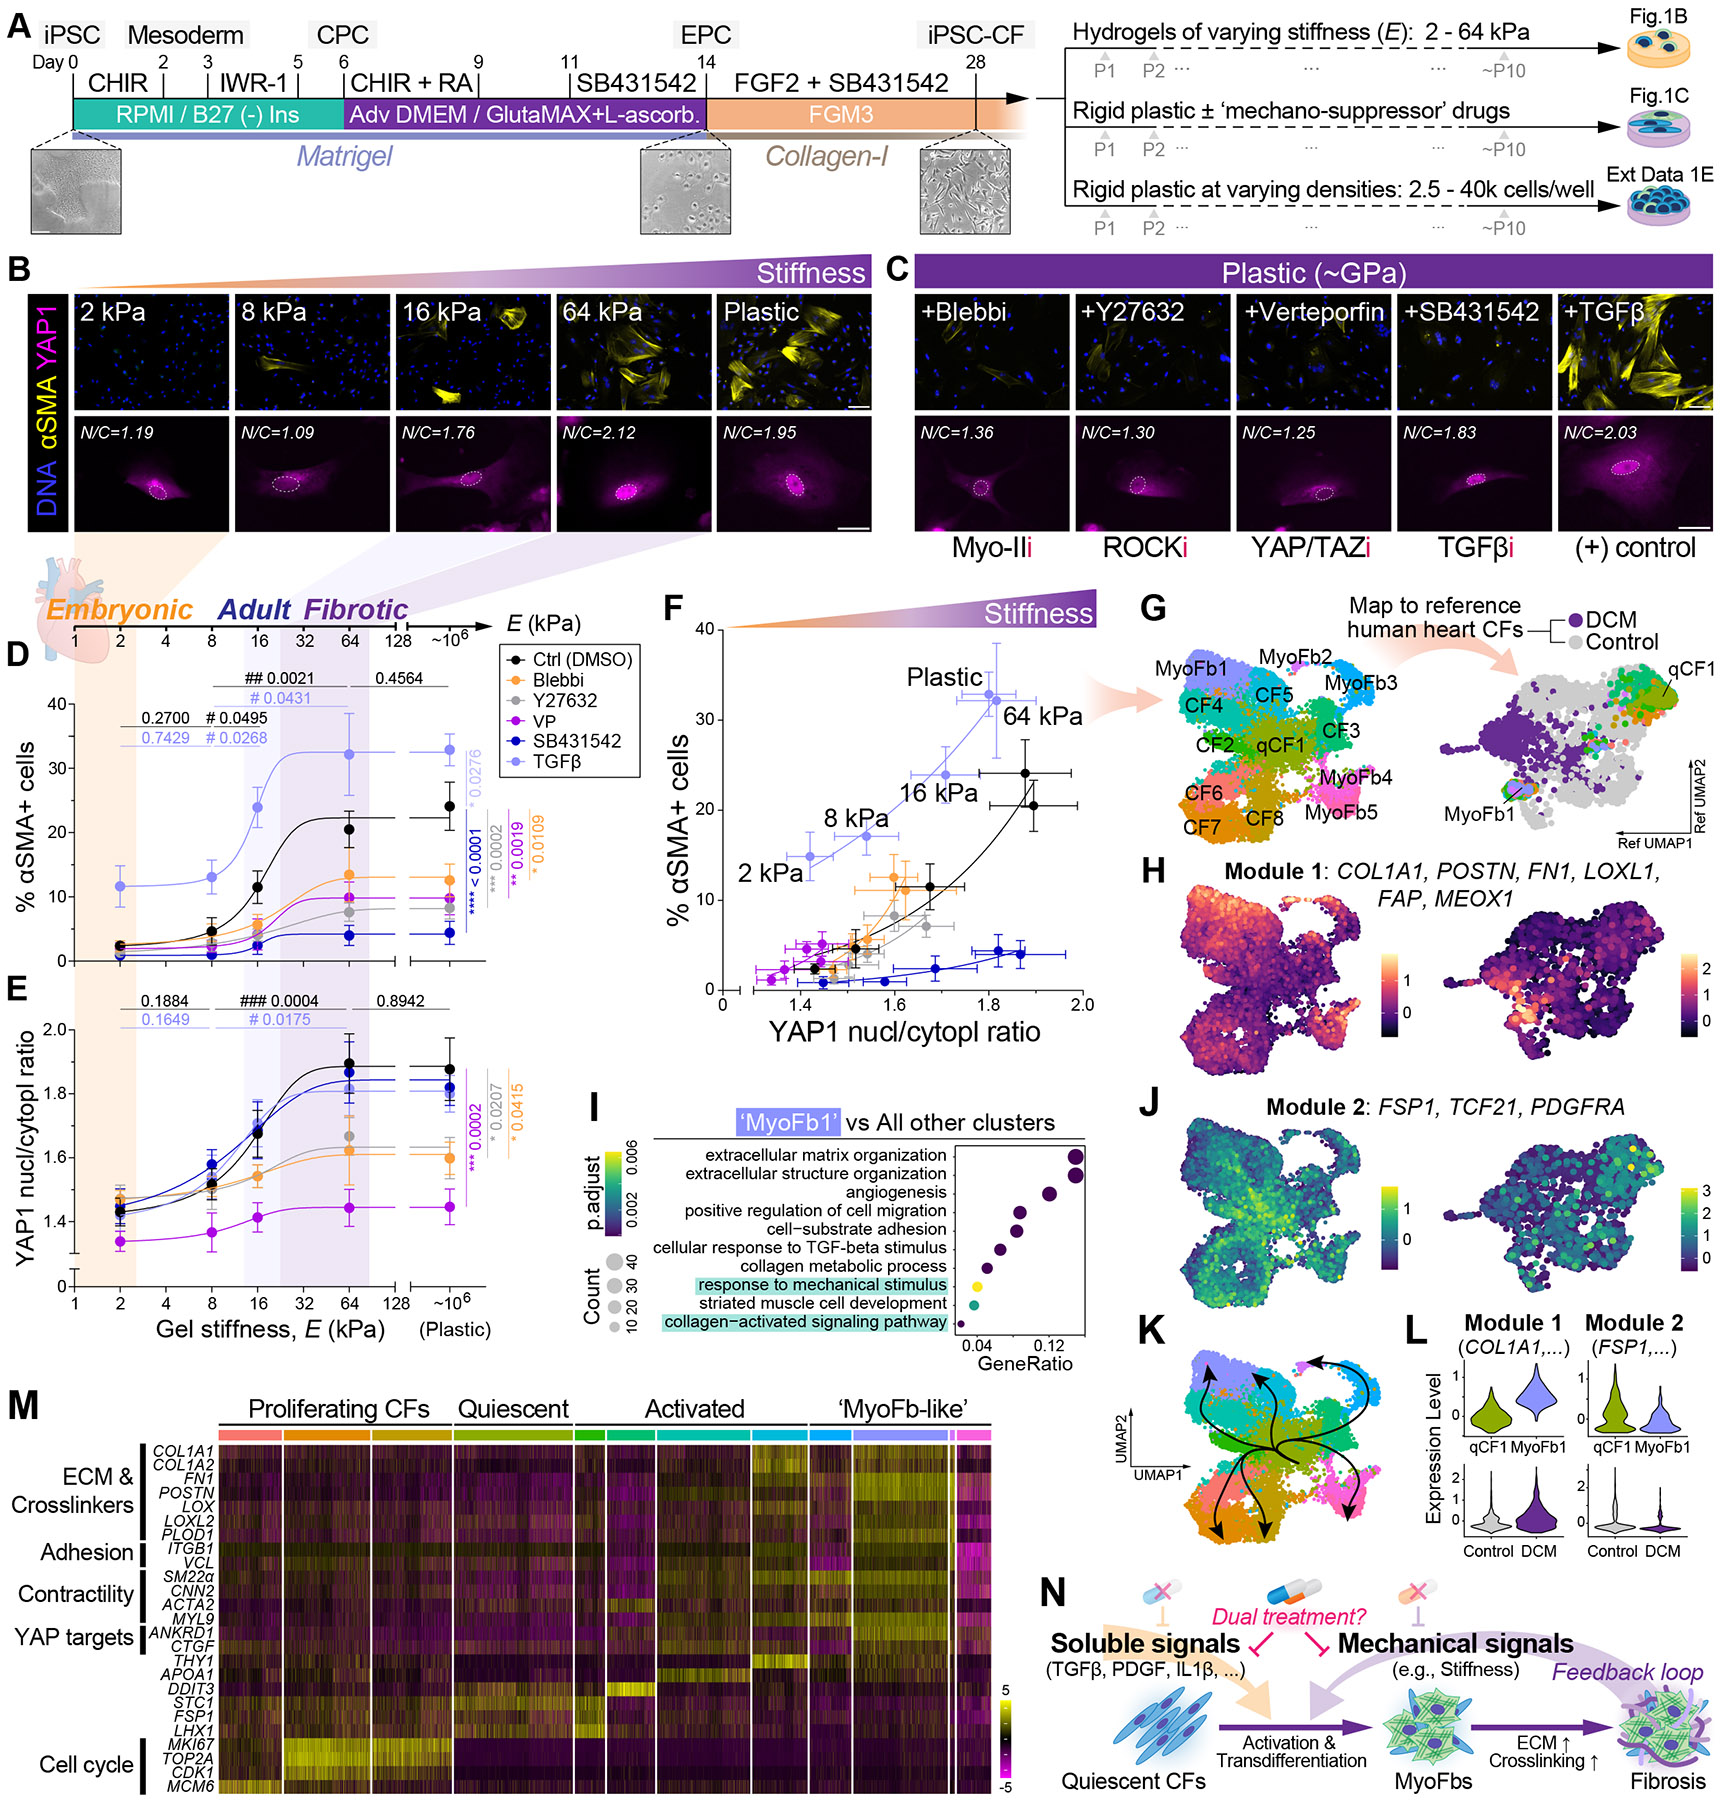
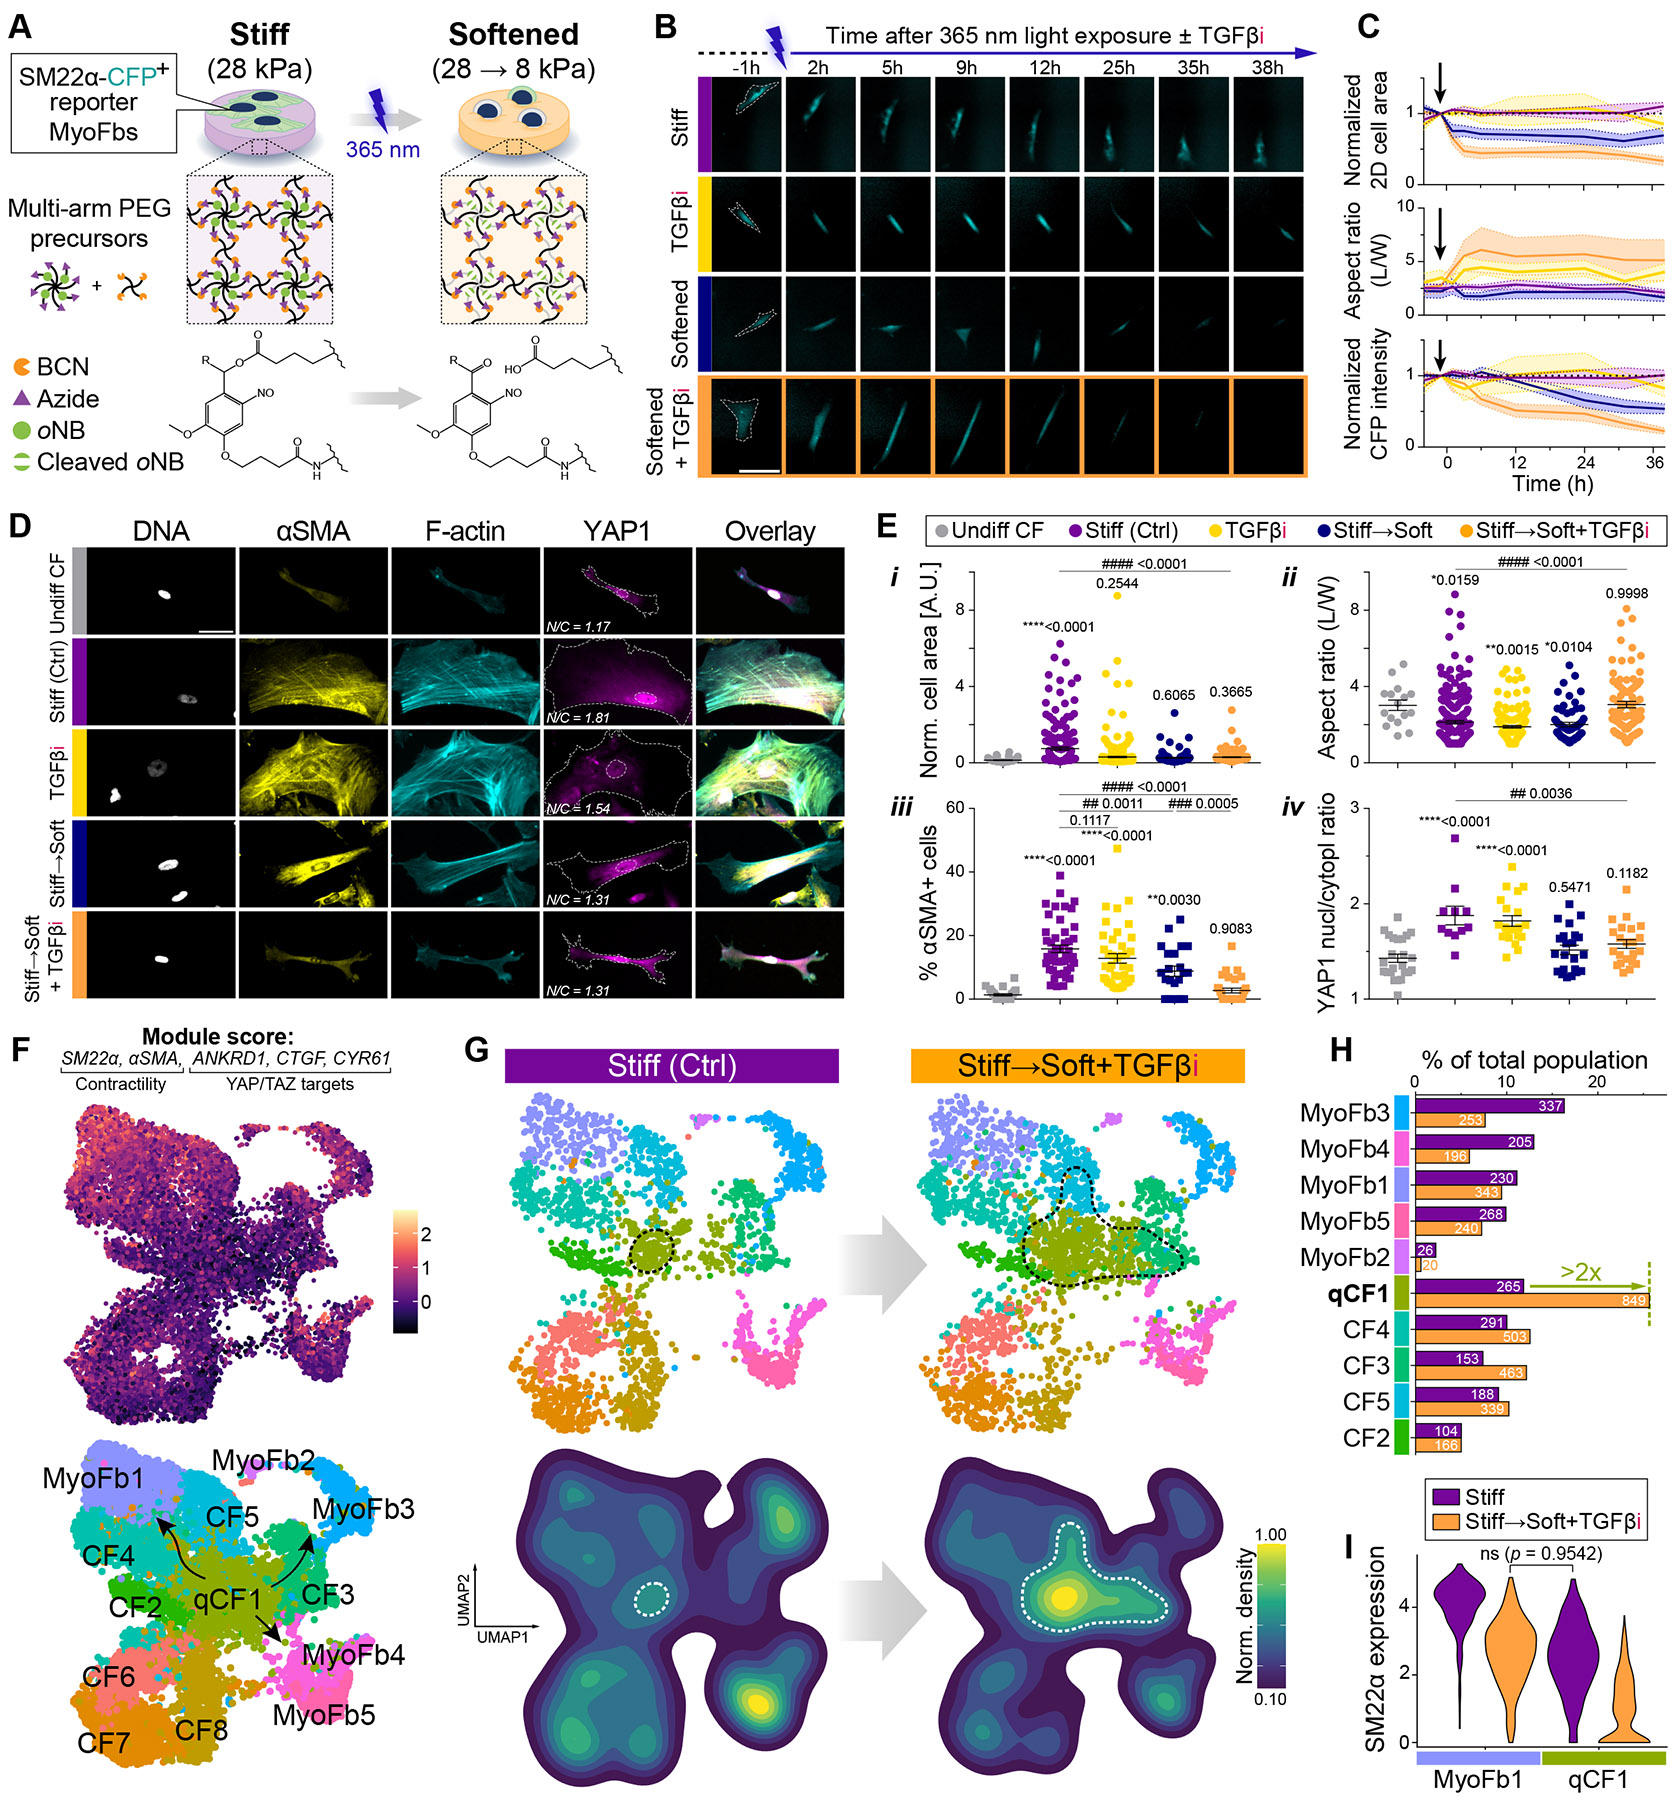
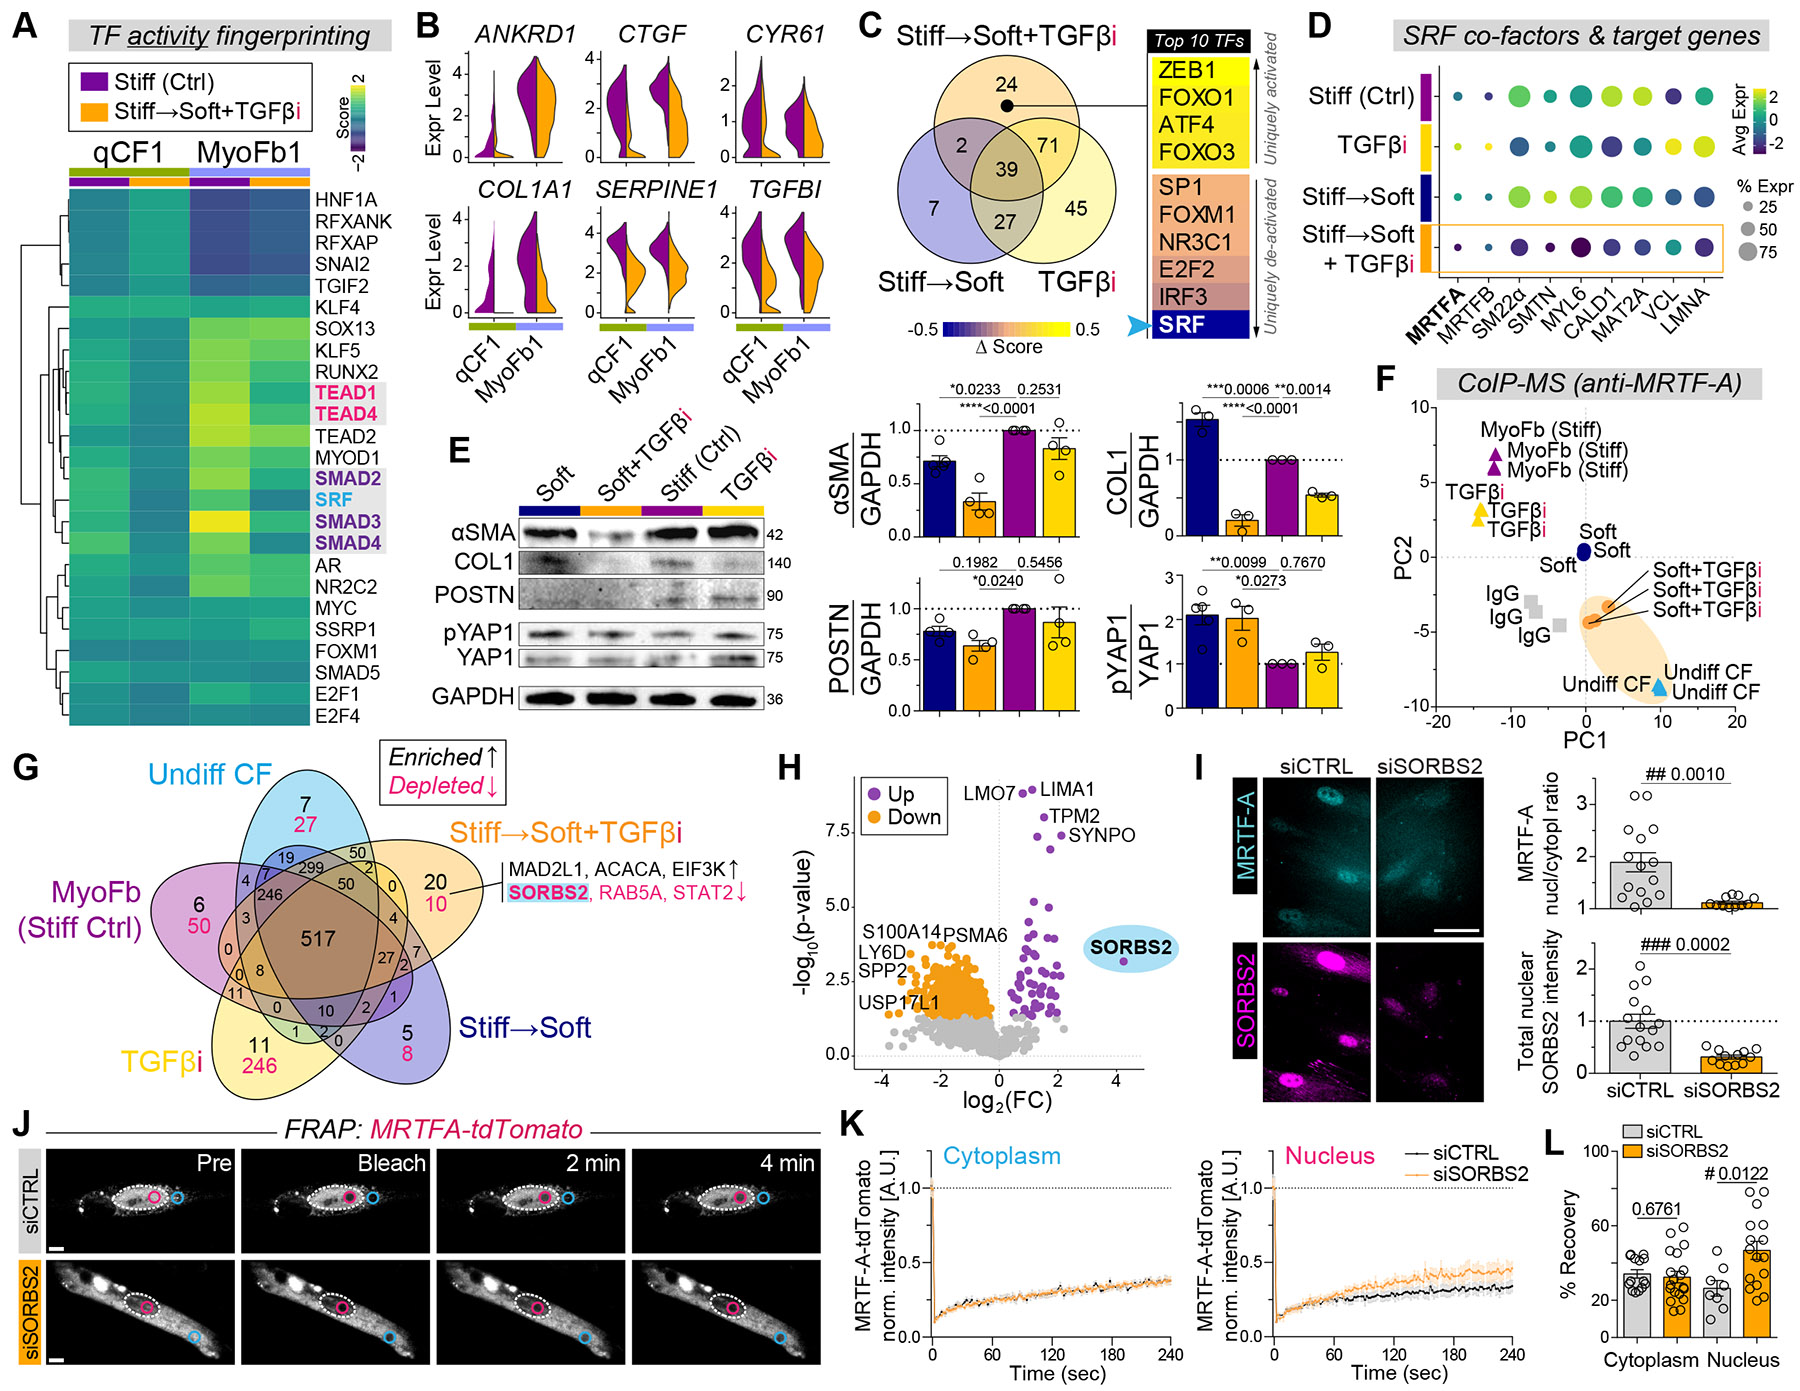
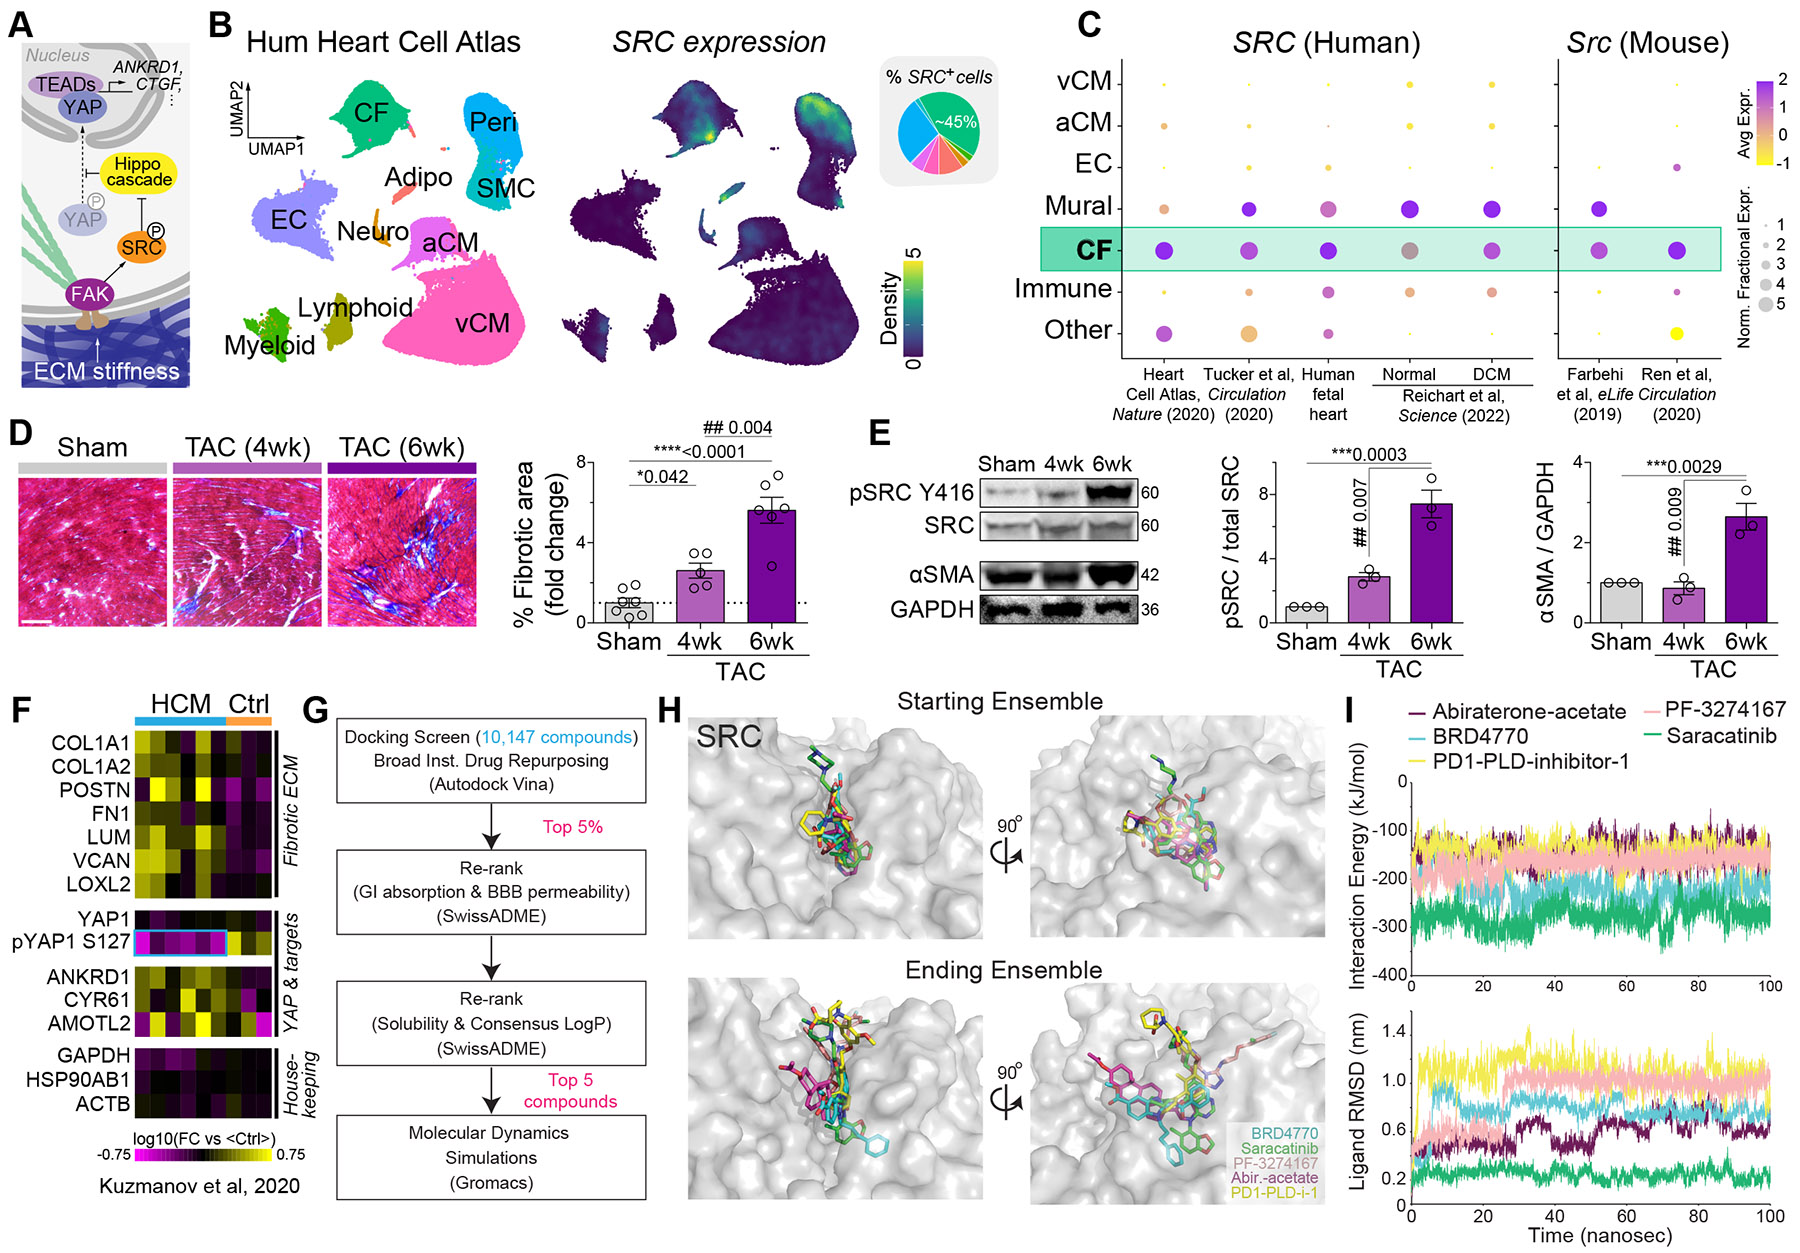
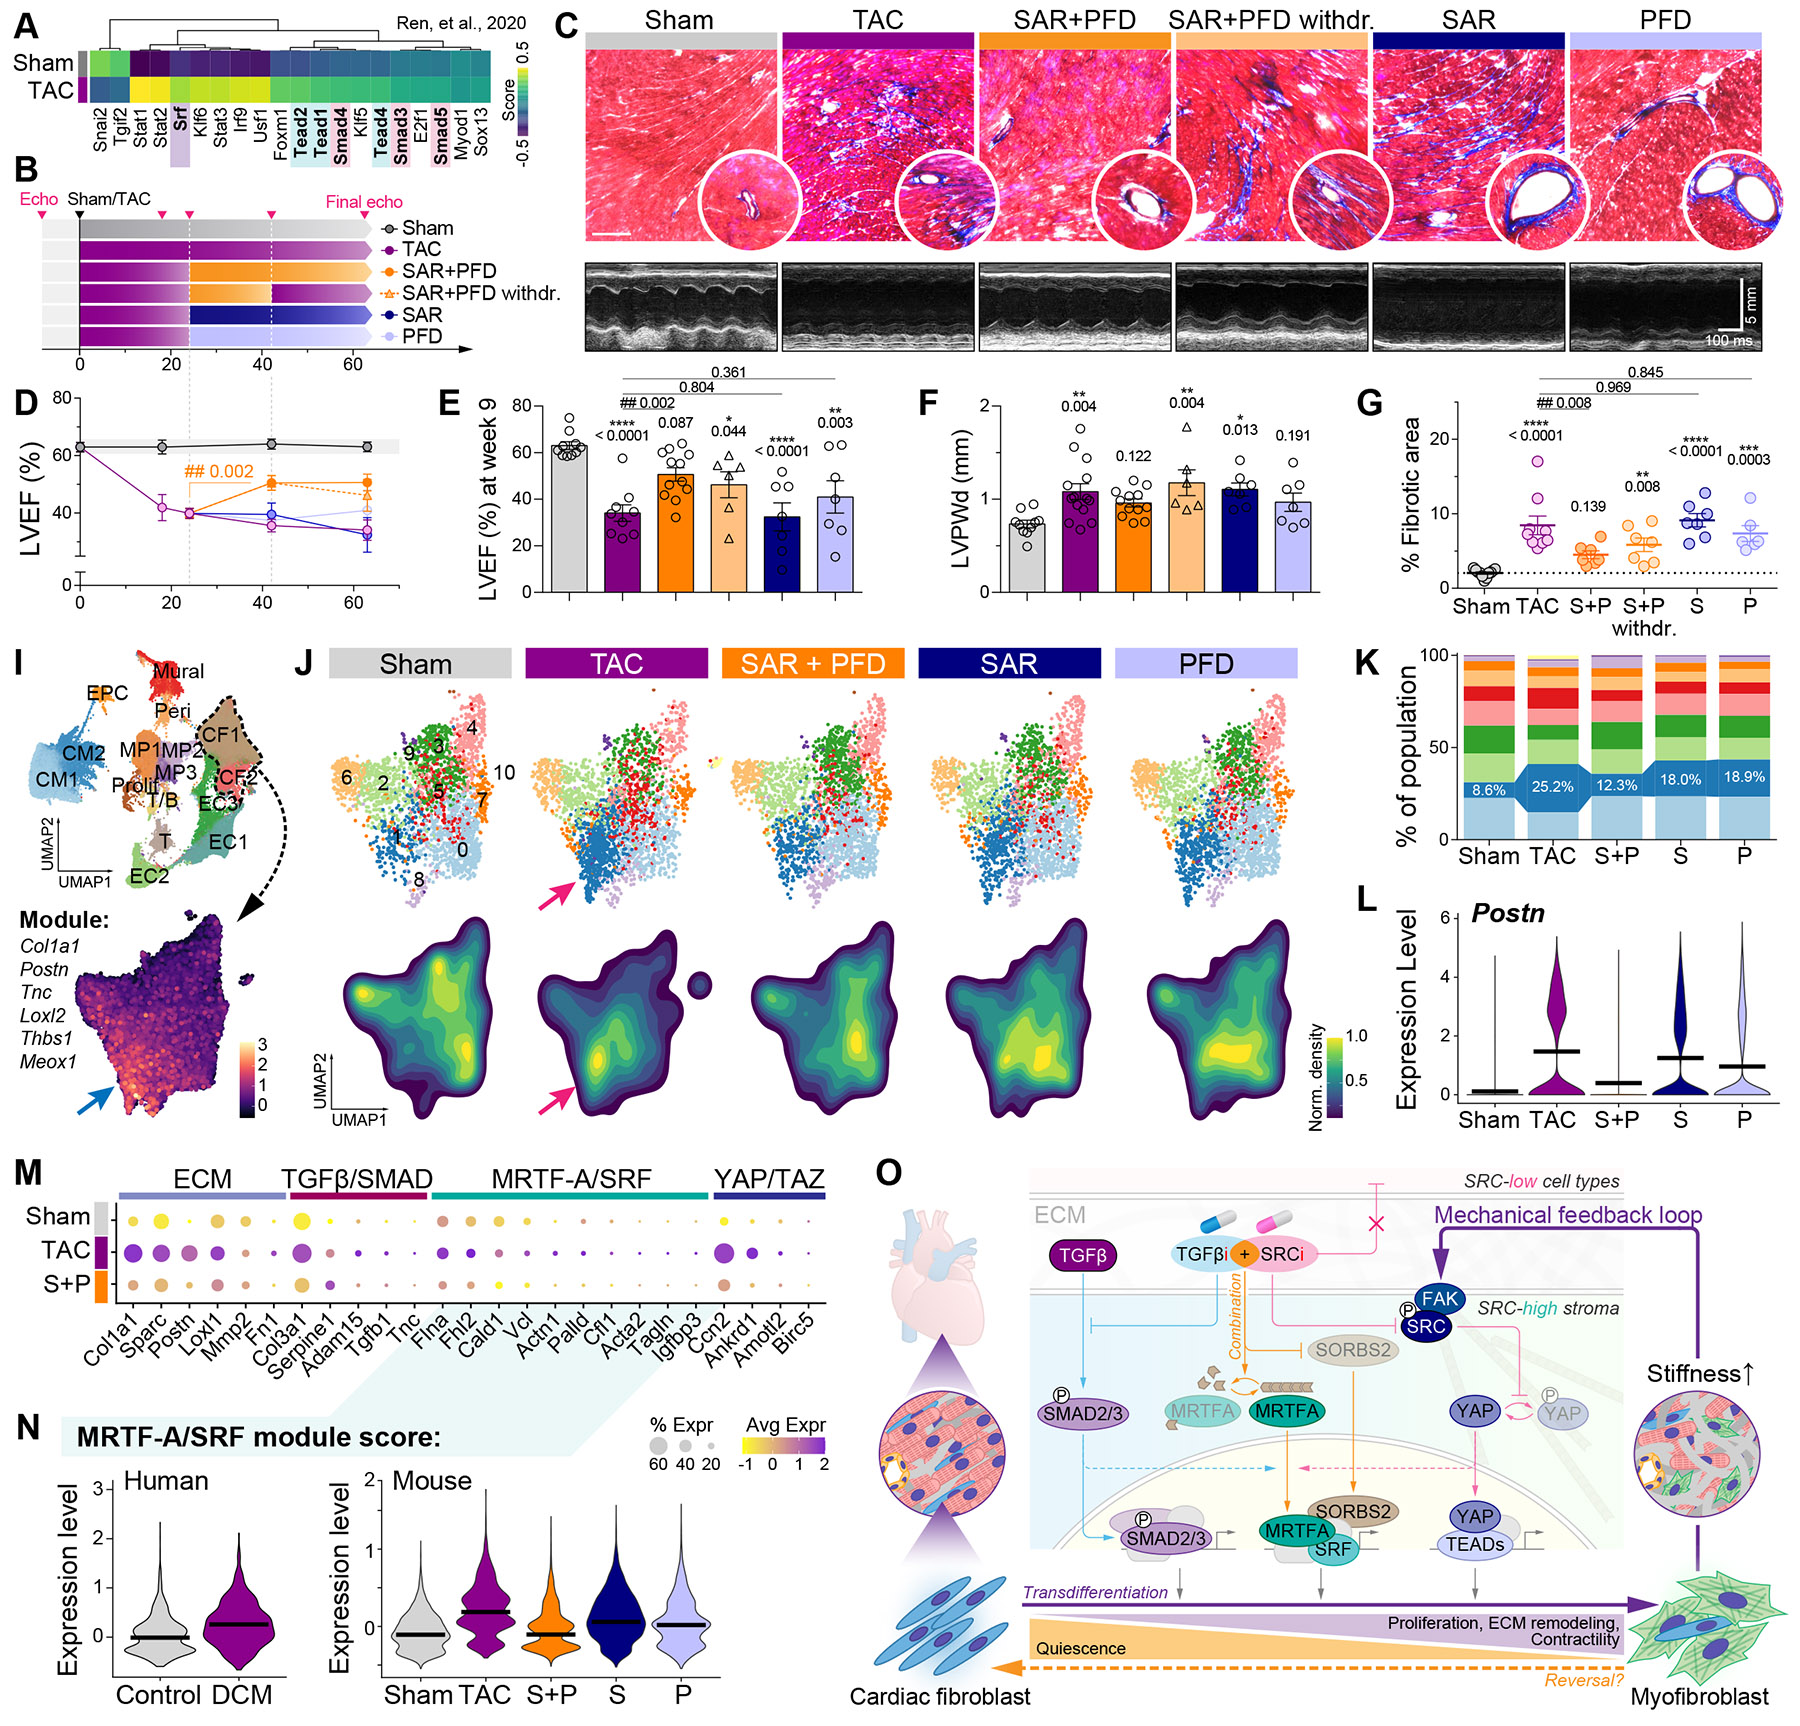
Matrix-derived biophysical cues are known to regulate the activation of fibroblasts and their subsequent transdifferentiation into myofibroblasts1-6, but whether modulation of these signals can suppress fibrosis in intact tissues remains unclear, particularly in the cardiovascular system7-10. Here we demonstrate across multiple scales that inhibition of matrix mechanosensing in persistently activated cardiac fibroblasts potentiates-in concert with soluble regulators of the TGFβ pathway-a robust transcriptomic, morphological and metabolic shift towards quiescence. By conducting a meta-analysis of public human and mouse single-cell sequencing datasets, we identify the focal-adhesion-associated tyrosine kinase SRC as a fibroblast-enriched mechanosensor that can be targeted selectively in stromal cells to mimic the effects of matrix softening in vivo. Pharmacological inhibition of SRC by saracatinib, coupled with TGFβ suppression, induces synergistic repression of key profibrotic gene programs in fibroblasts, characterized by a marked inhibition of the MRTF-SRF pathway, which is not seen after treatment with either drug alone. Importantly, the dual treatment alleviates contractile dysfunction in fibrotic engineered heart tissues and in a mouse model of heart failure. Our findings point to joint inhibition of SRC-mediated stromal mechanosensing and TGFβ signalling as a potential mechanotherapeutic strategy for treating cardiovascular fibrosis.


Conflict of interest statement

Competing interests: J.C.W. is a co-founder and member of the scientific advisory board of Greenstone Biosciences. H.M.B. is a cofounder and member of the scientific advisory board of Epirium Bio. The other authors declare no competing interests.

Figures

Extended Data Figure 1.
Extended Data Figure 1.. iPSC-CFs undergo spontaneous activation on stiff environments or at low cell densities unless mechanosensing is inhibited.
(A) Representative immunofluorescence images of αSMA (ACTA2) and YAP1 staining in iPSC-CFs cultured for ~10 passages on rigid tissue culture plastic (~GPa) at varying cell densities (initial seeding at 2.5 – 40k cells/well). Images are representative of experiments repeated twice independently with similar results. Top row scale bar = 100 μm; bottom row scale bar = 10 μm. (B) % αSMA+ cells (left) and YAP1 N/C ratio (right) plotted versus cell seeding density: 2.5k, 5k, 10k, 20k, 40k cells/well: % αSMA+ cells (n = 13, 15, 15, 15, 20 randomly selected fields of view, respectively, from n = 3 biological replicates/group) and YAP1 N/C (n = 20, 18, 21, 26, 27 cells, respectively, from n = 3 biological replicates/group). (C) % αSMA+ cells plotted versus YAP1 N/C ratio (n-numbers equivalent to those of panel B). (D) αSMA immunoblot of iPSC-CFs undergoing spontaneous CF-to-MyoFb transition on hydrogels of varying stiffness for ~10 passages. Blots are representative of n = 2 independently performed experiments with similar results. (E) Reported stiffness ranges for embryonic, healthy adult, myocardial infarction (MI), heart failure with preserved ejection fraction (HFpEF), and transverse aortic constriction (TAC) hearts,. Normalized 2D projected cell area (top) and % of Ki67+ cells (bottom) versus stiffness: 2, 8, 16, 64 kPa and rigid plastic. Normalized cell area (n = 21, 18, 22, 13, 11 cells, respectively, from n = 3 biological replicates/group) and Ki67+ (n = 9, 15, 7, 5, 5, 8 randomly selected fields of view, respectively, from n = 3 biological replicates/group). (F) Half-maximal effective stiffness (“ES50”, analogous to EC50 for a drug dose-response, in units of kPa) for each group, obtained from curve-fitting (data in main Fig. 1D, four-parameter dose-response stimulation with variable slope on GraphPad Prism v6.0). ES50 is defined as the gel stiffness at which the half-maximal response is produced, which in this case is the % of αSMA+ cells. ES50 for each group is plotted as individual bars, and the asymptotic standard error obtained from the best-fit curves (“Std. Error” values) are presented as error bars. P-values were calculated based on ordinary one-way ANOVA with Dunnett’s test (*’s) versus 2.5k/well (panel B), versus 2 kPa (panel E), or versus DMSO on plastic (panel E); and the two-sided Student’s t-test (#’s). Data are mean ± SEM (with the exception of panel F, for which individual bars ± error bars represent ES50 ± Std. Error).
Extended Data Figure 2.
Extended Data Figure 2.. iPSC-CFs resemble primary human foetal CFs at the transcriptomic level.
(A) UMAP plot of quiescent iPSC-CFs mapped onto a reference dataset of primary fibroblasts (FBs) from various human foetal tissues (heart, lung, skin, kidney, and liver). (B) Feature plots showing expression of TCF21 and PDGFRA in iPSC-CFs and primary CFs. (C) Correlation plot of iPSC-CFs, FBs from various foetal tissues (lung, skin, kidney, liver), and major cardiac cell types (CFs, SMCs, CMs, and ECs). (D-F) Representative feature plots for: (D) pan-fibroblast genes, (E) CM marker genes, and (F) EC marker genes. (G) The 25 most variable genes along pseudotime inferred by Slingshot-based trajectory analysis of TGFβ-activated iPSC-CFs. Notable ECM genes (purple) and SMC/MyoFb-associated genes (orange) are highlighted. (H) Gene network plot (“cnetplot” generated by clusterProfiler) for the MyoFb1 cluster.
Extended Data Figure 3.
Extended Data Figure 3.. Combination treatment drives morphological remodelling and population re-distribution at the single-cell transcriptomic level without altering cell cycle.
(A) Additional representative time-lapse images of SM22α (TAGLN)-CFP reporter iPSC-derived MyoFbs subjected to light-induced matrix softening over 38 hrs, either with or without TGFβi. Scale bar = 100 μm. (B) Normalized 2D cell projected area and cell aspect ratio (length/width; L/W) before and 38 hrs after matrix softening. Stiff control (n = 10), TGFβi (n = 12), Softened (n = 11), Softened+ TGFβi (n = 10 cells). Data from the two separate experiments were normalized and pooled. (C) Individual UMAP plots (top row) and corresponding cell density plots (bottom row) for all four treatment groups. (D) UMAP plot generated based on the cell cycle phase of each cell, scored using canonical markers. (E) Cell cycle distribution of the total population in each of the four treatment conditions. (F) Cell cycle distribution by cluster in the four treatment conditions. (G) Representative immunofluorescence images of Ki67 and DAPI-stained MyoFbs. Bottom: quantitation of % Ki67+ cells in the four treatment conditions: Stiff control (n = 11), TGFβi (n = 5), Soft (n = 6), Soft+TGFβi (n = 5 randomly selected fields of view, from n = 3 biological replicates/group). (H) (i) RNA velocity plots of Stiff control (purple) and Soft+TGFβi (orange), and (ii) ‘ΔRNA velocity’ generated by subtracting individual velocity vectors (Soft+TGFβ1-St1ff) on the coordinate grid. Images in panels A and G are each representative of experiments repeated twice independently with similar results. P-values were calculated based on ordinary one-way ANOVA with Dunnett’s test (*’s) versus Stiff baseline control; and the two-sided Student’s t-test (#’s). Data are mean ± SEM.
Extended Data Figure 4.
Extended Data Figure 4.. Combination treatment downregulates pro-fibrotic pathways and synergistically inhibits MRTF-A retention in the MyoFb nucleus.
(A) Heatmap of the top 25 TFs whose activity levels were most variable across the treatment conditions, for all identified clusters, based on activity fingerprinting by DoRothEA. (B) Violin plots of key downstream target genes of YAP/TAZ-TEAD. (C) Representative αSMA immunofluorescence images (left) and corresponding histogram of anti-αSMA intensity in single MyoFbs. Inset: bar graph of % αSMA+ cells (threshold set at 5-fold increase relative to baseline). Stiff (n = 49), TGFβi (n = 41), Stiff→Soft (n = 22), Stiff→Soft+ TGFβi (n = 30 randomly selected fields of view). Images are representative of experiments repeated n = 3 times independently with similar results. Scale bar = 100 μm. (D) Gel contraction assay of undifferentiated iPSC-CFs and MyoFbs after culturing (‘priming’) for 4 days on soft or stiff substrates, with or without TGFβi treatment. Primed cells were trypsinized and mixed with a commercially available gel solution for the contraction assay. 2D gel areas were measured after 12h (n = 3 biological replicates per group). (E) Dot plot showing the expression of major fibrosis-associated ECM proteins, ECM cross-linkers, and various MMP isoforms (collagenases and gelatinases) in the four groups after 2 days of treatment. (F) Schematic of experimental design illustrating TGFβ perturbations in a soft matrix background (orange), or stiff matrix culture in the presence of TGFβi. (G-H) Representative immunofluorescence images and quantitation of MRTF-A N/C ratio in the five treatment groups: Soft (n = 11), Stiff (n = 12), Stiff+LatB (latrunculin-B; n = 12), Soft+TGFβ (n = 11), Soft+TGFβ+SB (n = 11 cells). (I) Subcellular localization of enriched MRTF-A interactors in the CoIP-MS data. (J-K) Representative immunofluorescence images and quantitation of MRTF-A and SORBS2 co-localization in the nucleus and cytoplasm under the different treatment conditions: Undiff CF (n = 8), MyoFb (n = 37), TGFβi (n = 18), Soft (n = 12), Soft+TGFβi (n = 11 cells). Individual cells are shown as opaque data points in the background in panel K. Images in panels G and J are representative of experiments repeated twice independently with similar results. P-values were calculated based on ordinary one-way ANOVA with Dunnett’s test (*’s) versus Soft control (panel H); and the two-sided Student’s t-test (#’s) versus MyoFb (panel K). Data are mean ± SEM.
Extended Data Figure 5.
Extended Data Figure 5.. SRC is unique among major cellular mechanosensors in its enrichment in cardiac stromal cells.
(A) Nebulosa feature plots for a broad range of major mechanosensors, including mechano-responsive TFs (e.g., YAP/TAZ), focal adhesion components (e.g., FAK (PTK2)), mechanically-gated ion channels (e.g., PIEZO2), integrins (e.g., ITGA1), and nuclear envelope proteins (e.g., LMNA) in adult mouse heart. SRC’s unique enrichment in CFs and mural cell populations is highlighted with arrowheads (magenta). (B-F) Representative UMAP plots and Nebulosa feature plots illustrating SRC expression in scRNA-seq datasets of: (B) human adult heart, (C) FBs isolated from various human fetal tissues, (D) mouse model of myocardial infarction (MI), (E) additional mouse data set for TAC hearts, and (F) TGFβ-simulated iPSC-CFs. (G) Violin plot of SRC expression across all clusters in TGFβ-simulated iPSC-CFs.
Extended Data Figure 6.
Extended Data Figure 6.. Saracatinib recapitulates the effects of matrix softening in vitro.
(A) Connectivity Map (CMap) analysis showing the top 20 genes for which overexpression (OE) or knockdown (KD) results in similar perturbation signatures as saracatinib treatment. (B-C) Schematic of the experiment timeline (B) and representative immunofluorescence images (C) of cells treated with various drug combinations: “SAR” = saracatinib; “SB” = SB431542; “PFD” = pirfenidone; Scale bar = 150 μm; inset = 50 μm. (D) % αSMA-positive cells (defined as ≥ 5X versus baseline control) over the course of the experiment. For days 2, 4, and 9: DMSO (n = 4, 11, 13), SAR (n = 2, 8, 10), SB (n = 3, 7, 8), PFD (n = 2, 8, 6), SAR+SB (n = 3, 6, 8), SAR+PFD (n = 3, 11, 14 randomly selected frames of view, respectively, from n = 3 biological replicates/group). (E-G) Cell aspect ratio (elongation) versus normalized 2D cell area (E), and nuclear/cytoplasmic ratio of (F) YAP1 and (G) MRTF-A at day 9. DMSO (n = 58), SAR (n = 44), SB (n = 41), PFD (n = 38), SAR+SB (n = 31), SAR+PFD (n = 44 cells). (H) Representative images of f-actin and DNA in cells treated with TGFβi, either alone or with three different SRC inhibitors (“DAS” = dasatinib; “BOS” = bosutinib). Scale bar = 150 μm. (I) % cells with actomyosin stress fibres in the different treatment groups: CF, MyoFb, TGFβi, TGFβi+DAS, TGFβi+SAR, TGFβi+BOS (n = 5, 8, 6, 5, 5, 5 randomly selected fields of view, respectively, from n = 3 biological replicates/group). (J) Scatter plot of cell aspect ratio (length/width; L/W) versus 2D area. CF (n = 35), MyoFb (n = 42), TGFβi (n = 69), TGFβi+DAS (n = 25), TGFβi+SAR (n = 35), TGFβi+BOS (n = 77 cells). (K) Immunoblots and corresponding densitometry quantitation of pYAP1, αSMA, collagen-I, and POSTN. Blots are representative of n = 2 independently performed experiments with similar results (for collagen-I and POSTN, data from two additional experiments were normalized and pooled). Images shown are from two blots derived from the same samples from the same experiment, processed in parallel. For groups with n = 2, the error bars indicate the range between the two data points. (L) Subcellular localization of enriched MRTF-A interactors in the CoIP-MS data. (M) PCA analysis of CoIP-MS data from Fig. 3F, now including the SAR and SAR+TGFβi groups. (N) Heatmap of the anti-MRTF-A CoIP-MS data, showing all seven experimental groups (including those from Fig. 3F-H). The top 10 differentially enriched MRTF-A protein interactors in the MyoFb group (purple) are shown on the right. (O) Anti-SORBS2 immunoblot of the CoIP-MS input. The blot was not repeated due to sample availability after running the CoIP-MS. (P) Representative images (left) and quantitation (right) of MRTF-A and SORBS2 co-localization in the nucleus and cytoplasm across the different treatment groups (including those from Extended Data Figs. 4J,K. Undiff CF (n = 9), MyoFb (n = 37), TGFβi (n = 19), Soft (n = 12), Soft+TGFβi (n = 11), SAR (n = 11), SAR+TGFβi (n = 9 cells). Images in panels C, H, and P are representative of experiments repeated twice independently with similar results. P-values were calculated based on ordinary one-way ANOVA with Dunnett’s test (*’s) versus DMSO (panels D-G) or Undiff CF control (panel I); and the two-sided Student’s t-test (#’s) versus MyoFb (panels J, P). Data are mean ± SEM.
Extended Data Figure 7.
Extended Data Figure 7.. Saracatinib potentiates reversal of metabolic states in MyoFbs without affecting the viability and function of cardiomyocytes and endothelial cells.
(A) Seahorse XF Assay measurements of: (i) oxygen consumption rate (OCR), (ii) extracellular acidification rate (ECAR), and (iii) OCR versus ECAR after 2 days of drug treatments (n = 4 replicates/condition). (B-i) PrestoBlue viability assay for varying concentrations of a direct YAP/TAZ inhibitor verteporfin (‘VP’, top) and the SRC inhibitor saracatinib (‘SAR’, bottom) in iPSC-CMs, iPSC-ECs, iPSC-CFs, and iPSC-MyoFbs (n = 3 replicates per group). (B-ii) Half-maximal inhibitory concentration (IC50) values for VP and SAR, for each cell type. IC50 values were obtained from curve-fitting (data from panel B-ii, four-parameter dose-response inhibition with variable slope on GraphPad Prism v6.0). IC50 for each group is plotted as individual bars, and the asymptotic standard error obtained from the best-fit curves (“Std. Error” values) are presented as error bars. (C) Representative images (left) and quantitation (right) of EC tube formation assay after treatment with VP or SAR (1 μM each). n = 6 randomly selected fields of view, from n = 3 biological replicates/group. Images are representative of experiments repeated twice independently with similar results. (D) Heatmap (top) and line graph (bottom) illustrating the sharp decrease in SRC expression relative to cardiac genes (TTN, MYH7, and TNNT2) throughout the course of iPSC-CM differentiation (bulk RNA-seq, n = 3 technical replicates per time point). (E-G) Beating area, contraction velocity, and relaxation velocity measurements in VP- and SAR-treated iPSC-CMs at differentiation day 90 (D90): DMSO (n = 19), VP (n = 22), SAR (n = 24 randomly selected fields of view, from n = 3 biological replicates/group). (H) Western blot of phosphorylated SRC (Y416) and total SRC in MyoFbs under TGFβ drug perturbations. SAR was included as a positive control. Blots are representative of n = 3 experiments repeated with similar results. Images are from two blots from the same samples from the same experiment, processed in parallel. P-values were calculated based on ordinary one-way ANOVA with Dunnett’s test (*’s) versus DMSO control; and the two-sided Student’s t-test (#’s). Data are mean ± SEM (with the exception of panel B-ii, for which individual bars ± error bars represent IC50 ± Std. Error).
Extended Data Figure 8.
Extended Data Figure 8.. Combination treatment alleviates contractile dysfunction in fibrotic engineered heart tissues.
(A) Schematic of EHT formation and fibrotic compaction of EHTs upon TGFβ stimulation. Right inset: snapshots of relaxed (diastole; cyan) and contracted (systole; magenta) states. (B) Representative images of EHTs for each condition in their relaxed states (diastole). The distance between the centre of the two silicon posts were used to measure the diastolic tissue length, Ld (yellow dotted line). Images are representative of experiments repeated four times with similar results. Scale bar = 1 mm. (C-F) Fractional shortening (FS%) and diastolic tissue length (Ld) measured over time for each drug treatment group (C,E) and FS% and Ld after 2 days of treatment with the different drugs, normalized to DMSO control (D,F). Ctrl (n = 13), TGFβ (n = 13), S (n = 10), P (n = 11), S+P (n = 12 EHTs). (G) Elastic modulus (stiffness) of EHTs 4 days after the drug treatments: Ctrl (n = 5), TGFβ (n = 7), S (n = 4), P (n = 3), S+P (n = 7). For panels C and E (between days 0 and 6) and for panels D and G, data from four separate experiments were normalized and pooled. P-values were calculated based on ordinary one-way ANOVA with Dunnett’s test (*’s) versus control EHTs; and the two-sided Student’s t-test (#’s). Data are mean ± SEM.
Extended Data Figure 9.
Extended Data Figure 9.. Combination treatment in MI and TAC models of cardiac fibrosis.
(A) Schematic summary of the MI experiment. SAR+PFD (‘S+P’) dual treatment was started at three different time points: Sham (n = 6), MI (n = 14), and S+P starting on day 1 (n = 8), day 4 (n = 10), and day 7 (n = 4 animals) post-MI surgery. (B) Survival curves for the five treatment groups. (C) Representative images of Masson’s trichrome-stained tissue sections and (D) M-mode echocardiography scans for each group at day 21 post-MI. Images are representative of at least four animals per group, from one MI cohort. (E-I) Time-course of left ventricular ejection fraction, LVEF (%, (E)), and endpoint echocardiography measurements of LVEF (%) (F), fractional shortening (FS%, (G)), left ventricular posterior wall thickness in diastole (LPWd, (H)), and left ventricular internal diameter (LVIDd, (I)). At endpoint, Sham (n = 6), MI (n = 9), ‘S+P (d4-)’ (n = 8), and ‘S+P (d7-)’ (n = 4 animals). (J) Schematic summary of the TAC experiment, copied from Fig. 5B. (K-M) Time-course measurements of FS (K, left; for days 18, 24, and 42, data from three separate experiments were normalized and pooled), and week 9 measurements of: FS (K, right), left ventricular internal diameter (LVIDd, (L)), and heart weight / body weight (mg/g) ratio (M). Sham, TAC, S+P, S+P withdrawn, S, and P (n = 10, 12, 12, 6, 7, 7 animals, respectively). P-values were calculated based on ordinary one-way ANOVA with Dunnett’s test (*’s) versus Sham; and the two-sided Student’s t-test (#’s) versus MI (panels F-I) or versus TAC (panels K-M). Data are mean ± SEM.
Extended Data Figure 10.
Extended Data Figure 10.. Combination treatment induces transcriptional and protein-level changes in TAC hearts without significantly affecting inflammation or immune signalling.
(A) Left: Western blot of phosphorylated YAP (S127) and total YAP in whole heart lysates from the different drug treatment groups: Sham, Sham S+P, TAC 4 wk, TAC 6 wk, S+P, S, P (n = 5, 5, 10, 9, 9, 8, 9 hearts per lysate, respectively). Right: snRNA-seq violin plot displaying module scores for major YAP/TAZ target genes (Ccn2 (CTGF), Ankrd1, Amotl2, Birc5, and Igfbp2) specifically in CFs. (B) Violin plots showing module scores for common genes associated with oxygen consumption rate (OCR, left) and extracellular acidification rate (ECAR, right). (C) Normalized mass spectrometry intensity values for SORBS2 (ArgBP2) in two published datasets of mouse TAC hearts,: Kuzmanov et al and Rudebusch et al. (n = 5 and 4 tissue samples, respectively). (D) Violin plot of Sorbs2 expression in the five groups. Horizontal bars indicate mean. Cells with >0 Sorbs2 expression are shown. (E) Gene Ontology enrichment analysis for SAR+PFD versus TAC hearts. Fisher’s exact test (with Benjamini-Hochberg adjustment; one-sided). (F) Dot plot of major pro-inflammatory cytokine genes in the heart. (G-I) CellChat-based inference of cell-cell communication mechanisms, showing changes in modes of signalling from immune cells to CF populations (immune→CF) in the SAR+PFD group relative to TAC (H,I). A permutation test (randomization; one-sided) was used to compute communication probability strength of ligand-receptor pairs. (J-K) Immunoblots and corresponding quantitation of SRC phosphorylation and key fibrosis-associated proteins αSMA and POSTN for each group: Sham, Sham S+P, TAC (4 wk), TAC (6 wk), S+P, S, P (n = 5, 5, 10, 9, 9, 8, 9 hearts per lysate, respectively). Immunoblots in panels A and K are representative of n = 3 experiments performed independently with similar results. Images are from two blots from the same samples from the same experiment, processed under identical conditions. For panel K, data from an additional experiment was normalized and pooled. P-values were calculated based on ordinary one-way ANOVA with Dunnett’s test (*’s) versus Sham; and the two-sided Student’s t-test (#’s). Data are mean ± SEM.
Figure 1.
Figure 1.. CF sensitivity to matrix mechanics underlies a pro-fibrotic feedback loop.
(A) iPSC-CF differentiation protocol and experimental design. Representative immunofluorescence images of αSMA and YAP1 in iPSC-CFs cultured for ~10 passages on (B) hydrogels of varying stiffness, or on (C) rigid plastic with or without various ‘mechanosuppressor’ drugs. Scale bar = 100 (top) and 10 μm (bottom row). “N/C” = nuclear/cytoplasmic ratio. (D-E) % αSMA+ cells (threshold: >5X baseline, n = 3 biological replicates/group) and YAP1 N/C versus stiffness. For 2, 8, 16, 64 kPa, and plastic: DMSO (n = 24, 22, 18, 13, 11), blebbistatin (n = 14, 15, 16, 13, 11), Y27632 (n = 14, 19, 15, 24, 17), verteporfin (n = 14, 12, 15, 14, 15), SB431542 (n = 17, 22, 13, 21, 20), and TGFβ (n = 14, 13, 14, 13, 17 cells, respectively). Ordinary one-way ANOVA with Dunnett’s test (*’s) versus DMSO on plastic, and two-sided Student’s t-test (#’s). (F) % αSMA+ cells versus YAP1 N/C (equivalent n-numbers as D-E). (G) Left: UMAP of iPSC-CFs stimulated by TGFβ for 4d on plastic. Right: iPSC-CF data mapped to a reference human heart dataset of control and DCM CFs (only “pathogenic variant-negative” samples were analysed to minimize confounding effects). (H) Feature plots of iPSC-CFs (left) and in vivo human CFs (right) displaying module scores for major fibrosis-associated genes. (I) Gene Ontology analysis for the largest MyoFb cluster, “MyoFb1”. Fisher’s exact test (Benjamini-Hochberg adjustment; one-sided). (J) Module scores for FSP1, TCF21, and PDGFRA. (K) Trajectories inferred by Slingshot, with “qCF1” as the cluster of origin. (L) Violin plots of Modules 1 & 2 (H & J), in qCF1 versus MyoFb1 (top) and Control versus DCM CFs (bottom). (M) Heatmap of differentially expressed fibrosis-related genes. (N) Cartoon illustrating the dual treatment strategy. Data are mean ± SEM.
Figure 2.
Figure 2.. Dynamic matrix softening potentiates the reversal of MyoFbs when coupled with acute TGFβ inhibition.
(A) Schematic of the dynamically softening hydrogel system. R = Me; oNB = ortho-nitrobenzyl linker. (B) Representative time-lapse images of SM22α-CFP reporter MyoFbs subjected to dynamic softening, with or without a TGFβ inhibitor (“TGFβi”; 5μM SB431542). Scale bar = 100 μm. (C) Normalized 2D cell projected area, aspect ratio, and CFP intensity upon treatment: Stiff control, Stiff+TGFβi, Softened, or Softened+TGFβi (n = 5, 6, 6, 5 cells, respectively; additional cells analysed in Extended Data Fig. 3A,B). (D) Representative immunofluorescence images of YAP1, αSMA, and f-actin after 48 hrs. Scale bar = 50 μm. “N/C” = nuclear/cytoplasmic ratio. (E) Quantitation of: (i) cell area (from left to right: n = 50, 184, 388, 145, 212 cells), (ii) aspect ratio (n = 16, 187, 125, 60, 85 cells), (iii) % αSMA+ cells (n = 24, 49, 41, 22, 30 cells), and (iv) YAP1 N/C ratio (n = 24, 11, 20, 22, 22 cells)). Data from two separate experiments were normalized and pooled. (F) Top: module score for major MyoFb contractility genes and YAP/TAZ targets. Bottom: integrated UMAP plot with all treatment groups and cluster labels. (G) Separate UMAP plots (top) and corresponding cell density plots (bottom) for “Stiff (Ctrl)” versus “Stiff→Soft+TGFβi”. Dotted outlines from the density plot highlight the change in the size of the qCF1 cluster. (H) Bar graph illustrating the broad population re-distribution from MyoFb toward CF clusters with Stiff→Soft+TGFβi. Actively proliferating clusters CF6-8 were excluded from the graph. Actual cell numbers are shown for each bar. (I) SM22α expression in the MyoFb1 and qCF1 clusters upon Stiff→Soft+TGFβi treatment. P-values were calculated based on ordinary one-way ANOVA with Dunnett’s test (*’s) versus Undiff CF, and two-sided Student’s t-test (#’s). Data are mean ± SEM.
Figure 3.
Figure 3.. Combination treatment suppresses major fibrosis gene programs with synergistic inhibition of MRTF-A/SRF.
(A) Heatmap of the top 25 TFs whose activity levels were most variable between control versus “Stiff→Soft+TGFβi” in the qCF1 and MyoFb1 clusters, based on regulon analysis. The top-ranked TFs are highlighted in grey. (B) Violin plot of representative genes downstream of YAP/TAZ-TEAD (top) and TGFβ-SMAD2/3/4 (bottom). (C) Venn diagram of unique and shared TFs with variable activity versus Stiff. Right: The top 10 TFs uniquely activated or de-activated in the combination group. The #1 ranked TF, SRF, is highlighted (arrowhead). (D) Dot plot of SRF co-factors and targets. (E) Immunoblots of αSMA, collagen-I, periostin, and phospho-YAP1 (repeated n = 4, 3, 4, 3 times, respectively, with similar results). Images are from three blots from the same samples, processed under identical conditions. (F) Principal component analysis of the anti-MRTF-A CoIP-MS data. (G) Venn diagram of differential MRTF-A interactors identified. Enriched and depleted interactors are shown in black and red font, respectively. (H) Volcano plot of “MyoFb (Stiff Ctrl)” versus “Stiff→Soft+TGFβi”. The top-ranked enriched protein in the MyoFb (Stiff Ctrl) group, SORBS2, is highlighted (blue). (I) Left: Representative images and quantitation of MRTF-A N/C (top) and normalized total nuclear intensity of SORBS2 (bottom) upon siCTRL and siSORBS2 treatment (n = 15 and 12 cells, respectively). Scale bar = 50 μm. (J-L) Representative FRAP time-course images (J) and corresponding quantitation of: (K) normalized MRTF-A-tdTomato intensity over time, and (L) % recovery after 4 min. Coloured circles indicate bleached regions: blue = cytoplasmic (n = 14, 19); red = nuclear (n = 8, 16 cells for siCTRL and siSORBS2, respectively). Scale bar = 10 μm. P-values were calculated based on ordinary one-way ANOVA with Dunnett’s test (*’s) versus Stiff, and two-sided Student’s t-test (#’s). Data are mean ± SEM.
Figure 4.
Figure 4.. SRC is a stroma-enriched mechanosensor that can be targeted pharmacologically to mimic matrix softening in vivo.
(A) Schematic illustration of SRC-mediated mechano-signalling. (B) Left: UMAP plot of the human Heart Cell Atlas. Right: Nebulosa-generated UMAP feature plot showing enriched SRC expression in stromal cells (CFs and pericytes). Right inset: pie chart of % of SRC+ cells. (C) Dot plot of SRC expression in common cardiac cell types identified in scRNA-seq datasets of: (i) normal adult human hearts, (ii) human foetal heart dataset from this study, (iii) normal and dilated cardiomyopathy patient hearts, and (iv) adult mouse hearts, (right). (D) Masson’s trichrome-stained sections showing progressive fibrosis in a TAC model of pressure-overload induced hypertrophy and heart failure: Sham (n = 7), TAC at 4 (n = 5) and 6 weeks (n = 6 animals). (E) Immunoblots of SRC phosphorylation at Y416 and αSMA expression in TAC hearts after 4 and 6 weeks. Blots are representative of three independently performed experiments with similar results. Images are from two blots from the same samples, processed in parallel. (F) Analysis of a public proteomics dataset of human hypertrophic cardiomyopathy tissue samples (from septal myectomy) showing fibrotic ECM, phosphorylated YAP, downstream YAP target genes, and ‘housekeeping’ proteins. (G) Strategy for virtual docking screen of ~10,000 compounds to identify small molecule inhibitors of SRC. (H) Front and side views of the docking (“starting ensemble”) and after MD simulation (“end ensemble”) for the top 5 candidate compounds after filtering. (I) Total interaction energy (top) and root mean square deviation (RMSD; bottom) for the top 5 candidate compounds. P-values were calculated based on ordinary one-way ANOVA with Dunnett’s test (*’s) versus Sham, and two-sided Student’s t-test (#’s). Data are mean ± SEM.
Figure 5.
Figure 5.. Combination ‘mechanotherapy’ suppresses fibrosis and improves contractile function in failing mouse hearts.
(A) Heatmap of the top 20 most variable TFs in a published snRNA-seq dataset of TAC (5 weeks) mouse hearts, based on DoRothEA. Transcriptional regulators/effectors of the YAP/TAZ (teal), SRF (purple) and TGFβ (pink) pathways are highlighted. (B) Treatment timeline and experimental design. (C) Masson’s trichrome staining (top; scale bar = 200 μm) and M-mode echocardiography scans (bottom) at week 9 post-TAC. Images are representative of experiments repeated three times independently, with similar results. (D-G) Time-course of left ventricular ejection fraction (LVEF (%)) (D); for days 0, 18, 24, and 42, data from three separate experiments were averaged), and endpoint measurements of LVEF (E), left ventricular posterior wall thickness in diastole (LPWd) (F), and normalized fibrosis area (%) (G): Sham, TAC, S+P, S+P withdrawn, S, and P (n = 10, 12, 12, 6, 7, 7 animals, respectively). (I) Top: UMAP plot of TAC and drug-treated hearts (n = 3 hearts pooled per group). Bottom: Module score for key fibrosis genes in CF populations subsetted out from the original data. (J) Individual UMAPs for each experimental group (top) and corresponding density plots (bottom). Arrows indicate a MyoFb-like subcluster (blue) that grows in number after TAC but shrinks with S+P. (K) Cell composition in the five treatment groups. (L) Violin plot of Postn expression. (M) Dot plot showing broad expression changes in major ECM genes and targets of TGFβ/SMAD, MRTF-A/SRF, and YAP/TAZ induced by S+P. (N) Violin plots displaying module scores for the MRTF-A/SRF target gene set (panel M), in human fibroblasts (left) and in TAC mouse CFs. Bars indicate mean. (O) Graphical summary. P-values were calculated based on ordinary one-way ANOVA with Dunnett’s test (*’s) versus Sham, and two-sided Student’s t-test (#’s). Data are mean ± SEM.

Similar articles

Cited by

References

    1. Davis J & Molkentin JD Myofibroblasts: trust your heart and let fate decide. J Mol Cell Cardiol 70, 9–18 (2014). - PMC - PubMed
    1. Herrera J, Henke CA & Bitterman PB Extracellular matrix as a driver of progressive fibrosis. J Clin Invest 128, 45–53 (2018). - PMC - PubMed
    1. Herum KM, Choppe J, Kumar A, Engler AJ & McCulloch AD Mechanical regulation of cardiac fibroblast profibrotic phenotypes. Mol Biol Cell 28, 1871–1882 (2017). - PMC - PubMed
    1. Pesce M et al. Cardiac fibroblasts and mechanosensation in heart development, health and disease. Nat Rev Cardiol 20, 309–324 (2023). - PubMed
    1. van Putten S, Shafieyan Y & Hinz B Mechanical control of cardiac myofibroblasts. J Mol Cell Cardiol 93, 133–142 (2016). - PubMed

References (Materials and Methods)

    1. Whitehead AJ, Hocker JD, Ren B & Engler AJ Improved epicardial cardiac fibroblast generation from iPSCs. J Mol Cell Cardiol 164, 58–68 (2022). - PMC - PubMed
    1. Zhang H, Shen M & Wu JC Generation of Quiescent Cardiac Fibroblasts Derived from Human Induced Pluripotent Stem Cells. Methods Mol Biol 2454, 109–115 (2022). - PMC - PubMed
    1. Burridge PW et al. Chemically defined generation of human cardiomyocytes. Nat Methods 11, 855–860 (2014). - PMC - PubMed
    1. Lian X et al. Robust cardiomyocyte differentiation from human pluripotent stem cells via temporal modulation of canonical Wnt signaling. Proc Natl Acad Sci U S A 109, E1848–1857 (2012). - PMC - PubMed
    1. Street K et al. Slingshot: cell lineage and pseudotime inference for single-cell transcriptomics. BMC Genomics 19, 477 (2018). - PMC - PubMed

MeSH terms

LinkOut - more resources