. 2025 Jun;642(8066):125-132.
doi: 10.1038/s41586-025-08791-9. Epub 2025 Apr 30.

Picuris Pueblo oral history and genomics reveal continuity in US Southwest

Affiliations

Picuris Pueblo oral history and genomics reveal continuity in US Southwest

Thomaz Pinotti et al. Nature. 2025 Jun.

Abstract

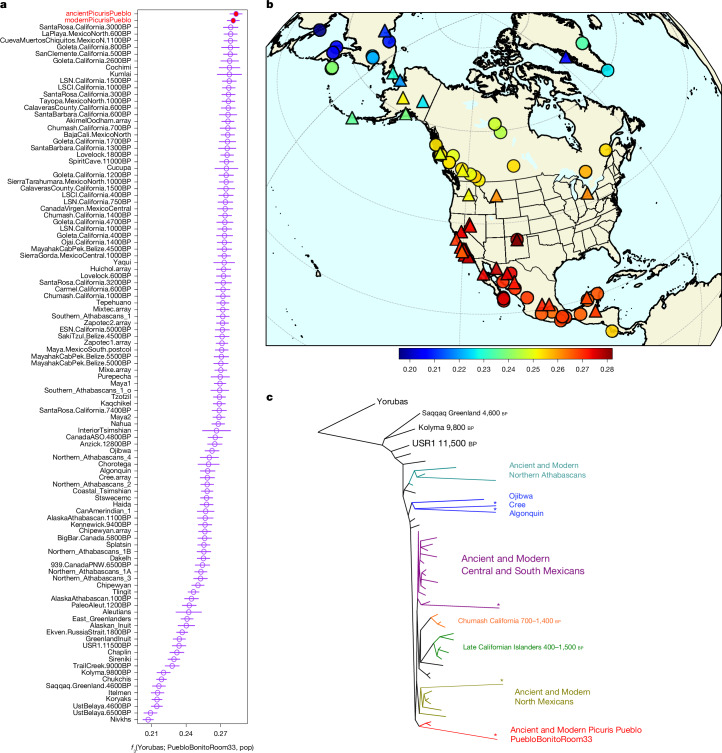
Indigenous groups often encounter significant challenges when asserting ancestral claims and cultural affiliations based on oral histories, particularly in the USA where such narratives have historically been undervalued. Although ancient DNA offers a tool to complement traditional knowledge and address gaps in oral history, longstanding disregard for Indigenous sovereignty and beliefs has understandably led many Indigenous communities to distrust DNA studies1-4. Earlier research often focused on repatriation claims5-7, whereas more recent work has increasingly moved towards enhancing Tribal histories8,9. Here we present a collaborative study initiated by a federally recognized Native American tribe, the sovereign nation of Picuris Pueblo in the Northern Rio Grande region of New Mexico, USA, to address gaps in traditional knowledge and further their understanding of their population history and ancestry. We generated genomes from 16 ancient Picuris individuals and 13 present-day members of Picuris Pueblo, providing genomic data spanning the last millennium. We show genetic continuity between ancient and present-day Picuris, and more broadly with Ancestral Puebloans from Pueblo Bonito in Chaco Canyon10, 275 km to the west. This suggests a firm spatiotemporal link among these Puebloan populations of the North American Southwest. Furthermore, we see no evidence of population decline before European arrival11-13, and no Athabascan ancestry in individuals predating 1500 CE, challenging earlier migration hypotheses14-16. This work prioritizes Indigenous control of genetic data and brings together oral tradition, archaeology, ethnography and genetics.


Conflict of interest statement

Competing interests: The authors declare no competing interests.

Figures

Fig. 1
Fig. 1. Map of the Four Corners region of the US Southwest, naming sites and rivers discussed in the text.
Chaco culture (Ancestral Puebloan) related sites are indicated with circles and present-day Pueblos are indicated with squares. Base elevation data are derived from the USGS EROS SRTM 1-arc second digital elevation model, with smoothing applied to produce derivative hillshade and terrain-relief datasets.
Fig. 2
Fig. 2. Allele-frequency-based analyses between ancient and present-day Picuris individuals with other Indigenous American populations.
a, Outgroup f3 statistics in the format f3(PuebloBonitoRoom33, pop, Yorubas), in which we find present-day and ancient Picuris Pueblo to share the most shared genetic drift with ancient individuals from Pueblo Bonito. Error bars represent about 3.3 standard errors (P ≈ 0.001 in a Z test with 172,863 SNPs in 5-Mb jackknife blocks). b, Same outgroup f3 statistics results, plotted on a map of North America. Warmer colours indicate higher f3 values. Triangle and circle denote ancient and present-day individuals, respectively. c, Treemix maximum-likelihood tree of Indigenous North Americans, rooted using a West African population (Yorubas). Populations were grouped and branches were shortened (denoted with a *) for increased readability. Unedited results can be found in Extended Data Fig. 3.
Fig. 3
Fig. 3. Haplotype and IBD analyses between ancient and present-day Picuris individuals with other Indigenous American populations.
Left, the average shared IBD segments longer than 8 centiMorgans (cM) between Indigenous American populations and present-day individuals from Picuris Pueblo. Populations are ordered by latitude and coloured by major geographic areas. Right, the demographical history of present-day Picuris individuals inferred using HapNe-LD with imputed diploid genotypes. Shaded areas show 95 and 90% confidence intervals, and the dotted line the median estimate. The x axis is the time (measured in generations ago since the time of sampling), and the y axis the effective population size (Ne).
Fig. 4
Fig. 4. Relationship between ancient Picuris individuals and present-day Southern Athabascans.
a, D statistics in the format D(Southern_Athabascans_1, Chipewyan, pop, Yorubas), where warmer colours indicate higher values of D, therefore a stronger genetic similarity with Southern Athabascans. Circles and triangles denote present-day and ancient individuals, respectively. Ancestral Puebloans from Picuris Pueblo is the population that maximize the value of D. Full D statistics results can be found in Supplementary Fig. 36. b, D statistics in the format D(Southern_Athabascans_1, ancientPicurisPueblo, pop, Yorubas). Athabascan speakers from northern North America are the ones to maximize the value of D (for example, Chipewyan). Full D statistics results can be found in Supplementary Fig. 37. For both plots, error bars represent about 3.3 standard errors (P ≈ 0.001 in a Z test with 172,863 SNPs in 5-Mb jackknife blocks).
Extended Data Fig. 1
Extended Data Fig. 1. Maximum-likelihood tree built using Treemix on a dataset of North American Indigenous populations.
The high branch lengths in some populations may reflect analytical artifacts: for ancient individuals, they arise from high error rates due to low coverage and DNA damage, while for present-day individuals, they result from missing data caused by masking non-Indigenous American segments.
Extended Data Fig. 2
Extended Data Fig. 2. Maximum-likelihood tree of mitochondrial haplogroup B2y.
Present-day literature mitogenomes are in black, present-day Picuris in blue and all other ancient mitogenomes in gold. Near-zero length branches were collapsed for convenience.
Extended Data Fig. 3
Extended Data Fig. 3. Placement of ancient and present-day Picuris in a schematic Y-chromosome phylogeny of haplogroup Q-MPB001/M1107.
Ancient Picuris are in red and present-day Picuris in blue. Relevant literature individuals appear in italic. In accordance with Picuris wish to not have its data included in any private database, we do not describe any variant private to them.

References

    1. Claw, K. G. et al. Chaco Canyon dig unearths ethical concerns. Hum. Biol.89, 177 (2017). - PMC - PubMed
    1. Bardill, J. et al. Advancing the ethics of paleogenomics. Science360, 384–385 (2018). - PMC - PubMed
    1. Garrison, N. A. et al. Genomic research through an indigenous lens: understanding the expectations. Ann. Rev. Genom. Hum. Genet.20, 495–517 (2019). - PubMed
    1. Tsosie, K. S. et al. Ancient-DNA researchers write their own rules. Nature600, 37–37 (2021). - PubMed
    1. Rasmussen, M. et al. The genome of a Late Pleistocene human from a Clovis burial site in western Montana. Nature506, 225–229 (2014). - PMC - PubMed

Publication types

LinkOut - more resources