

Regulation of PV interneuron plasticity by neuropeptide-encoding genes
- PMID: 40307547
- PMCID: PMC12222018
- DOI: 10.1038/s41586-025-08933-z
Regulation of PV interneuron plasticity by neuropeptide-encoding genes
Abstract
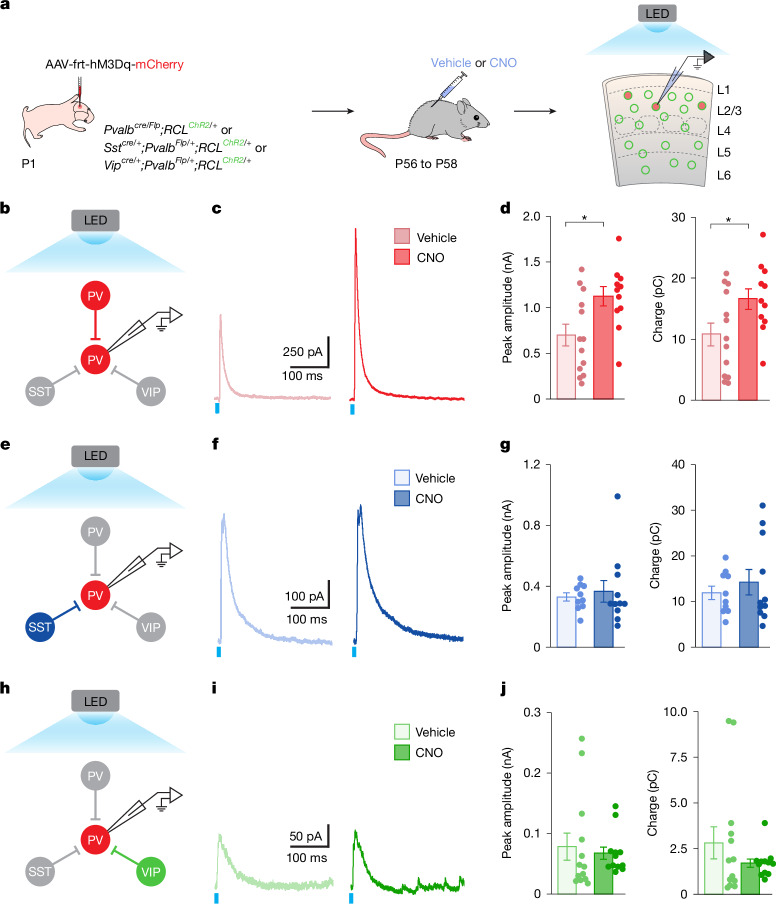
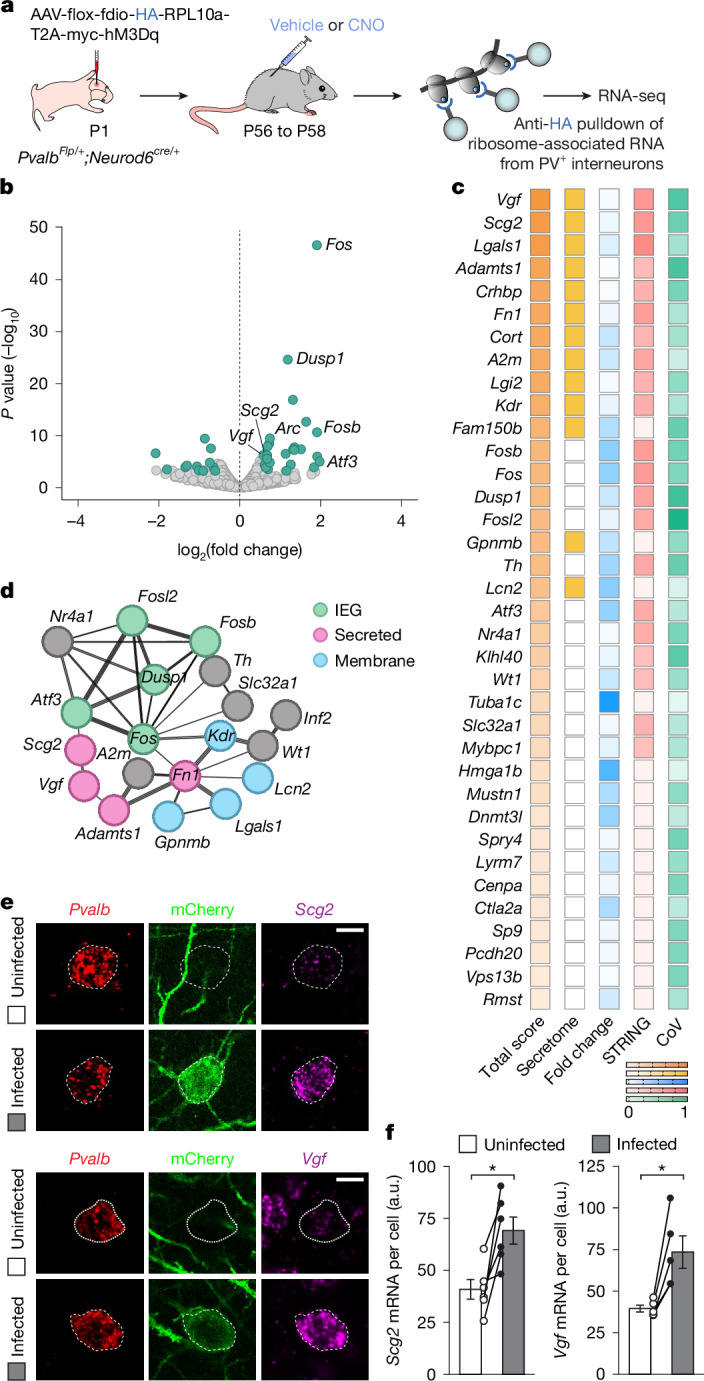
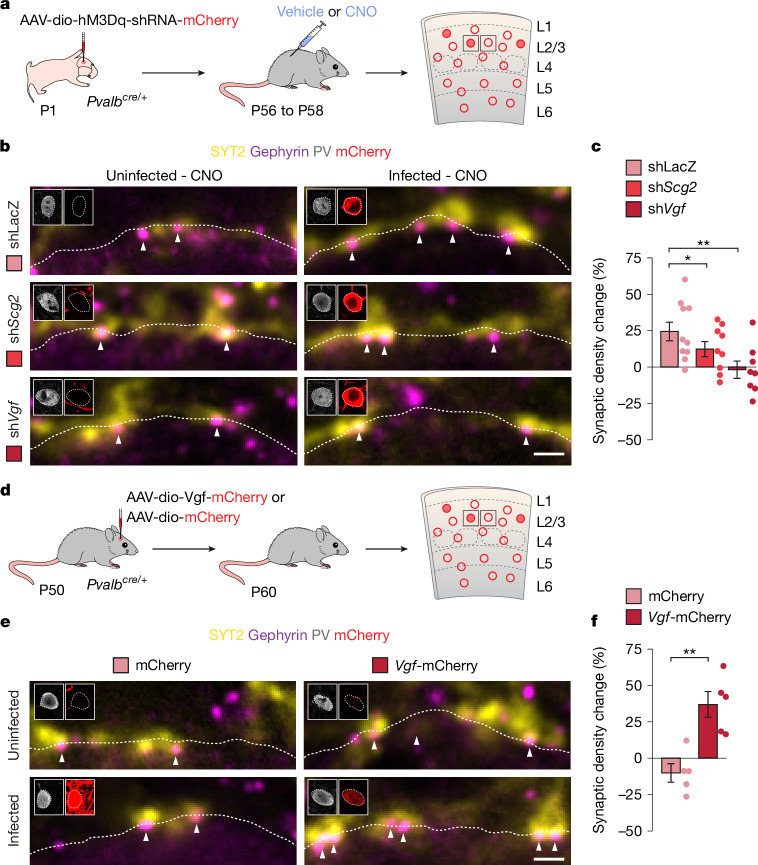
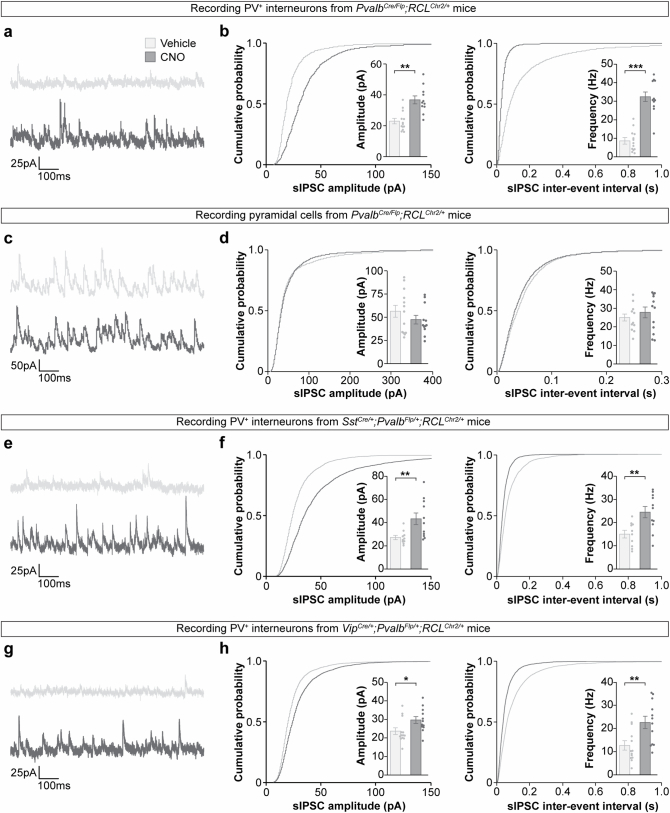
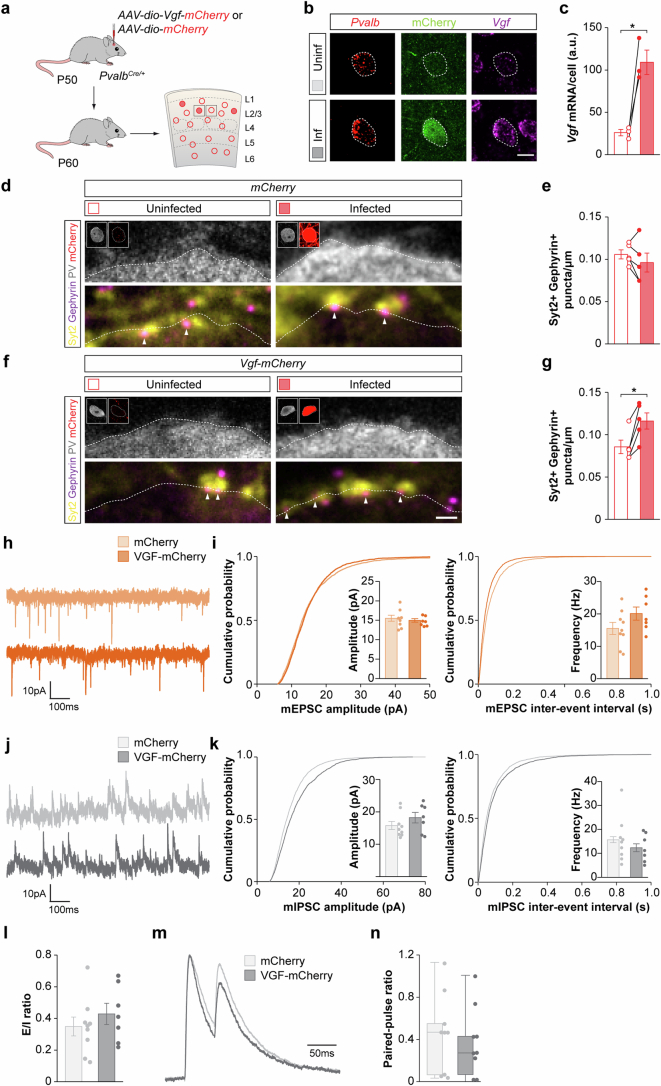
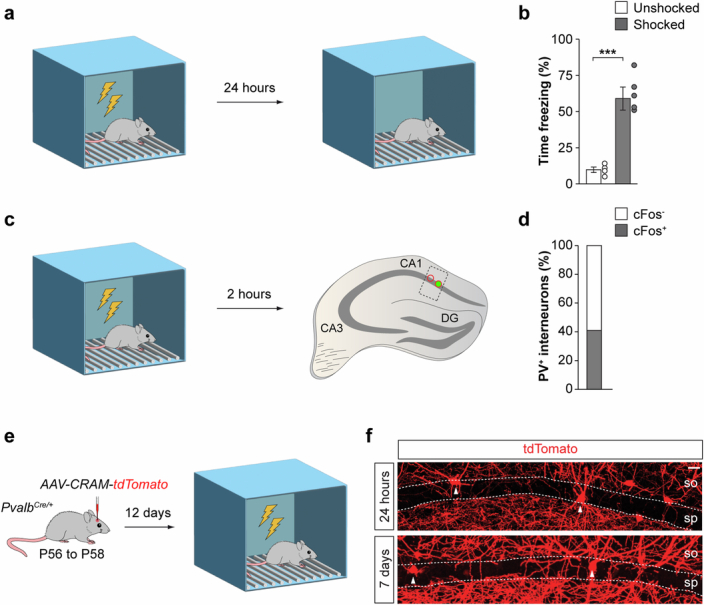
Neuronal activity must be regulated in a narrow permissive band for the proper operation of neural networks. Changes in synaptic connectivity and network activity-for example, during learning-might disturb this balance, eliciting compensatory mechanisms to maintain network function1-3. In the neocortex, excitatory pyramidal cells and inhibitory interneurons exhibit robust forms of stabilizing plasticity. However, although neuronal plasticity has been thoroughly studied in pyramidal cells4-8, little is known about how interneurons adapt to persistent changes in their activity. Here we describe a critical cellular process through which cortical parvalbumin-expressing (PV+) interneurons adapt to changes in their activity levels. We found that changes in the activity of individual PV+ interneurons drive bidirectional compensatory adjustments of the number and strength of inhibitory synapses received by these cells, specifically from other PV+ interneurons. High-throughput profiling of ribosome-associated mRNA revealed that increasing the activity of a PV+ interneuron leads to upregulation of two genes encoding multiple secreted neuropeptides: Vgf and Scg2. Functional experiments demonstrated that VGF is critically required for the activity-dependent scaling of inhibitory PV+ synapses onto PV+ interneurons. Our findings reveal an instructive role for neuropeptide-encoding genes in regulating synaptic connections among PV+ interneurons in the adult mouse neocortex.
© 2025. The Author(s).
Conflict of interest statement
Competing interests: The authors declare no competing interests.
Figures


References
MeSH terms
Substances
LinkOut - more resources
Full Text Sources
Research Materials
