. 2025 Jun;642(8066):154-164.
doi: 10.1038/s41586-025-08809-2. Epub 2025 Apr 30.

Serotonin and neurotensin inputs in the vCA1 dictate opposing social valence

Affiliations

Serotonin and neurotensin inputs in the vCA1 dictate opposing social valence

Julia M Zorab et al. Nature. 2025 Jun.

Abstract

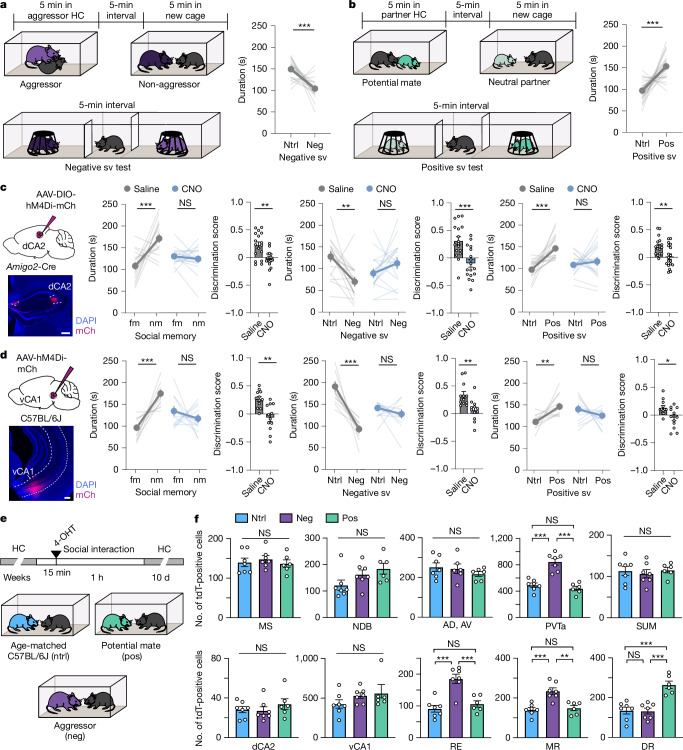
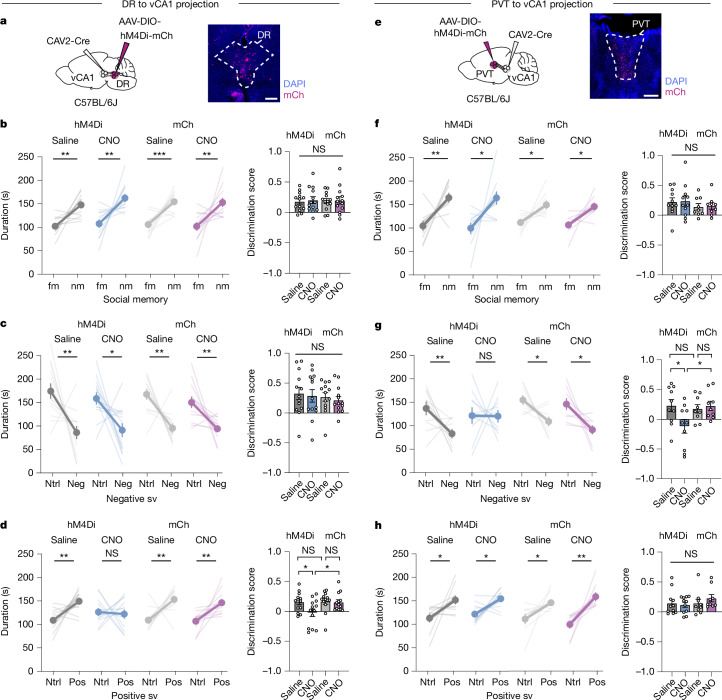
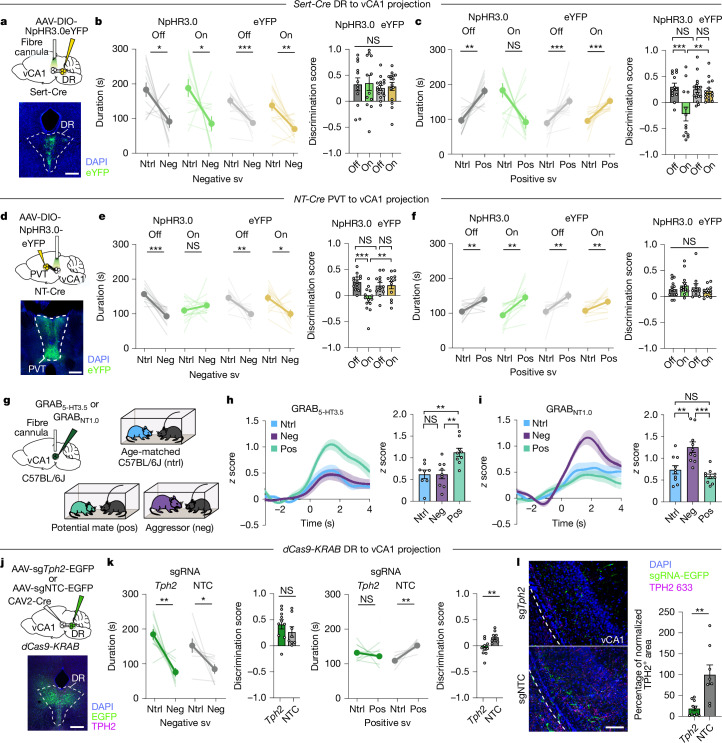
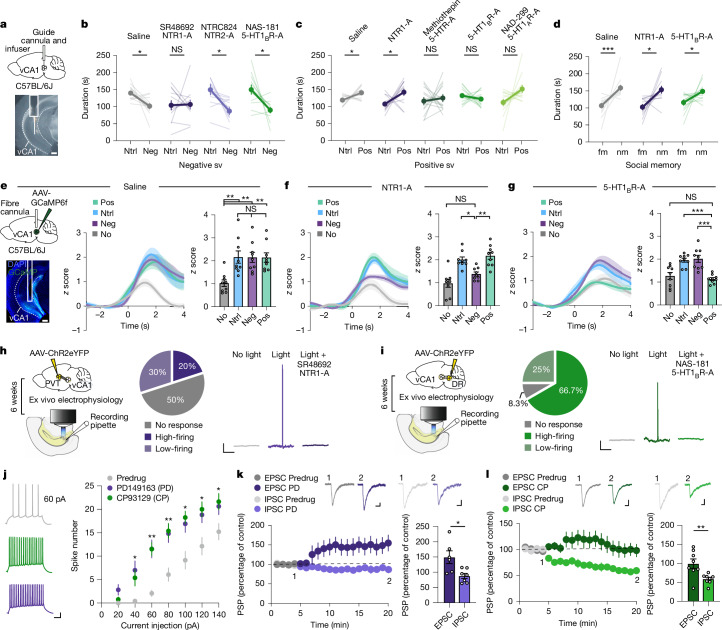
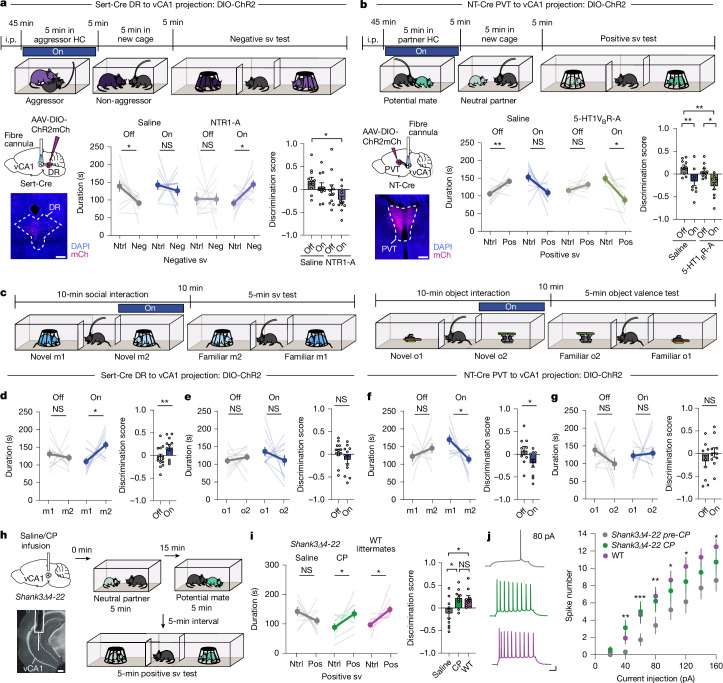
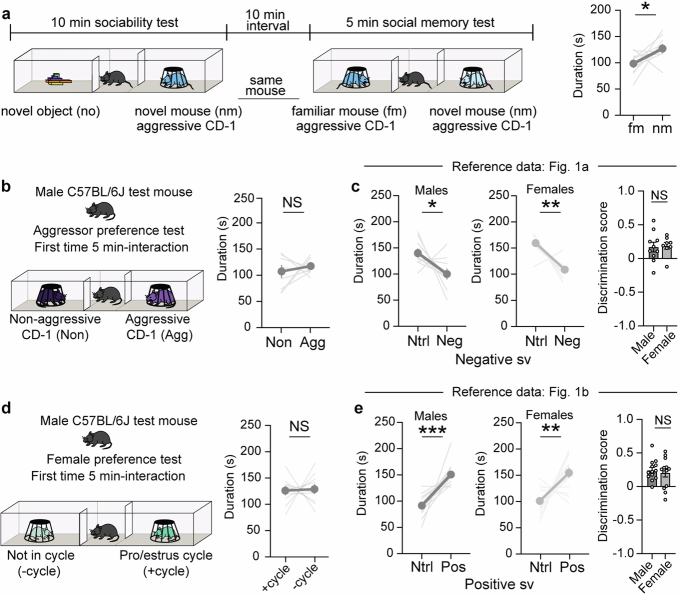
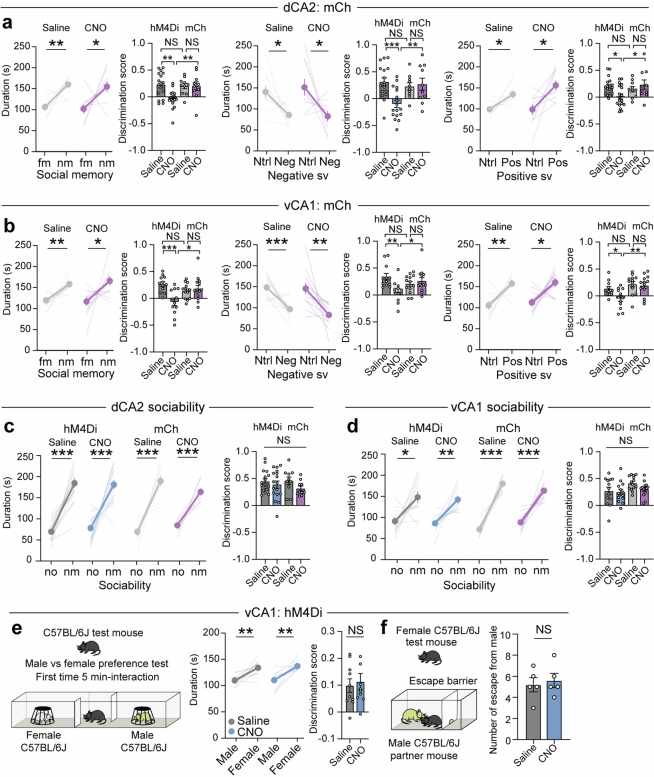
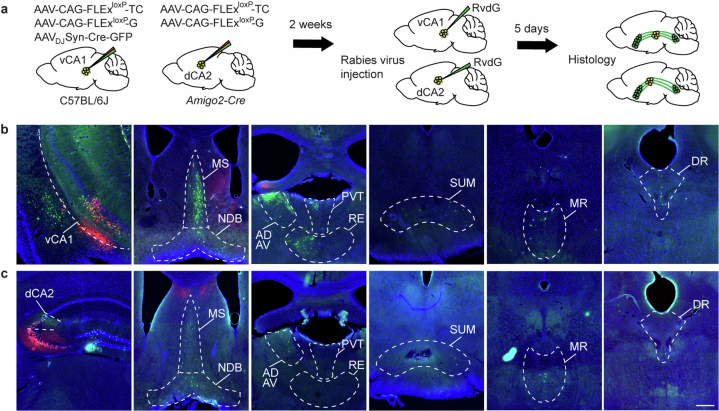
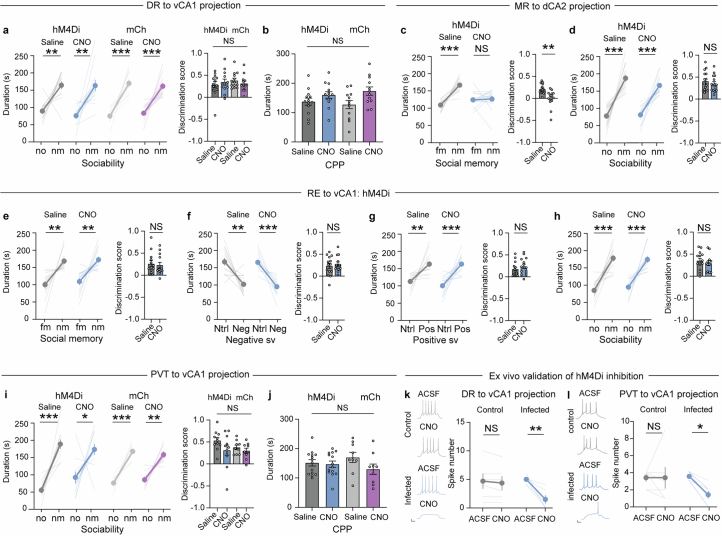
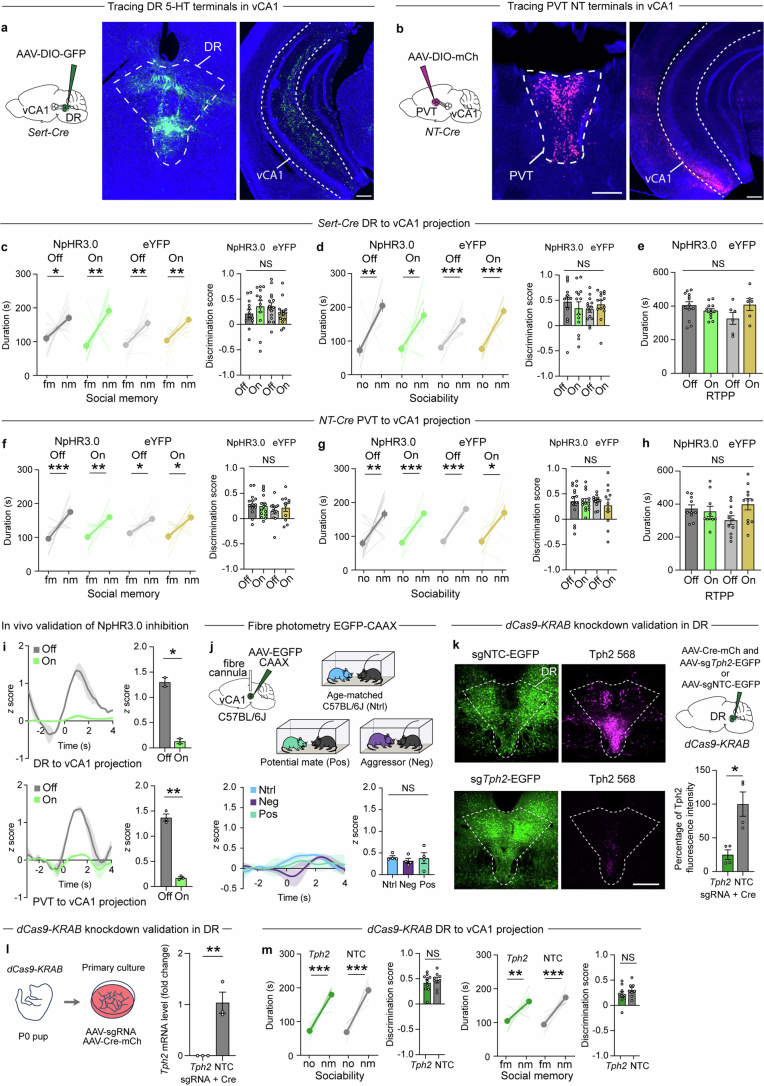
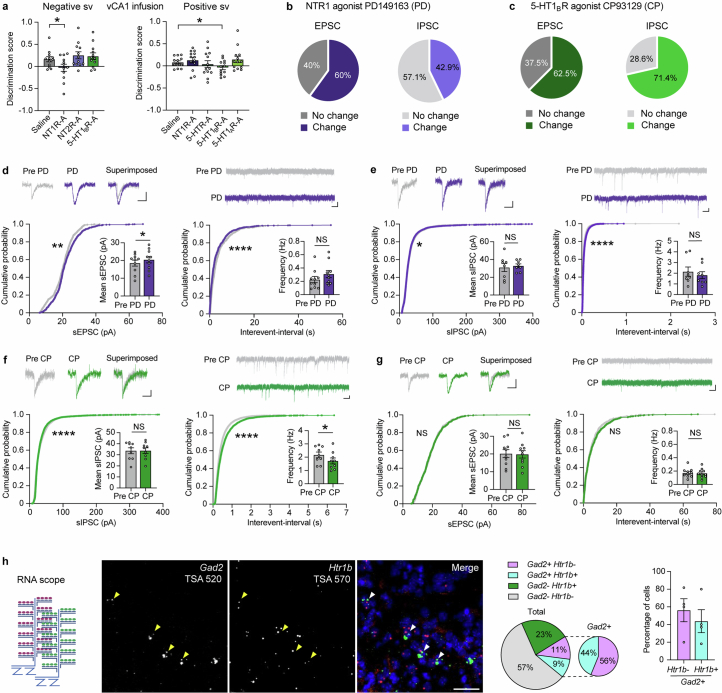
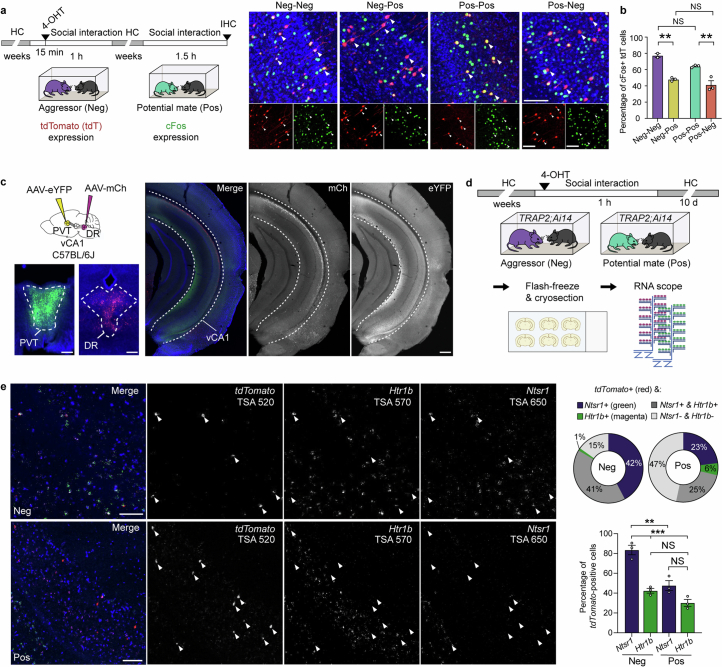
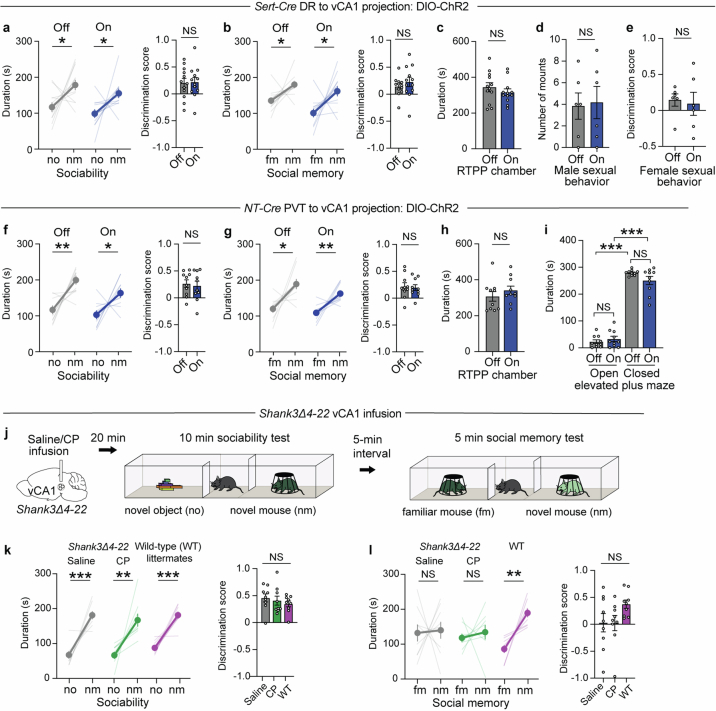
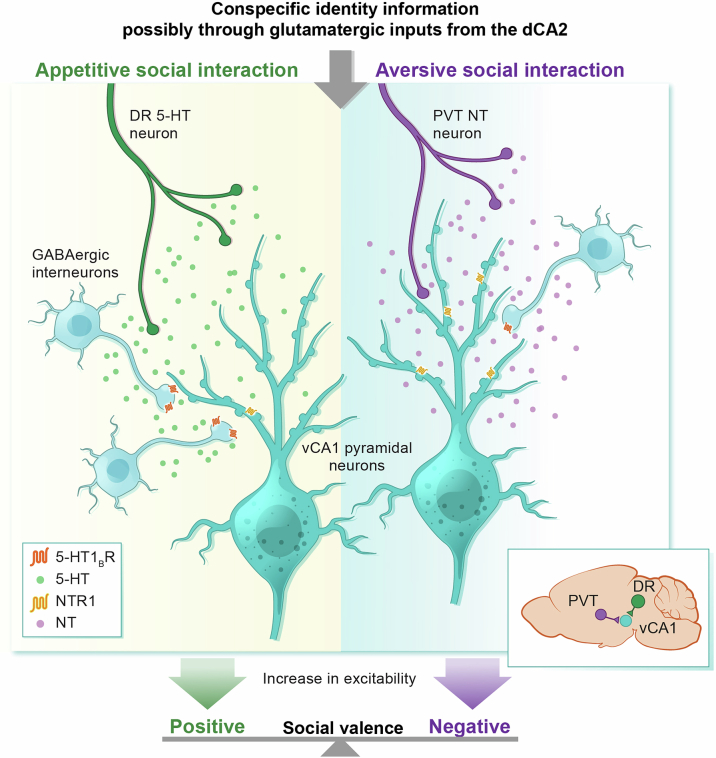
The ability to evaluate valence of a social agent based on social experience is essential for an animal's survival in its social group1. Although hippocampal circuits have been implicated in distinguishing novel and familiar conspecifics2-7, it remains unclear how social valence is constructed on the basis of social history and what mechanisms underlie the heightened valence versatility in dynamic relationships. Here we demonstrate that the ventral (v)CA1 integrates serotonin (5-HT) inputs from the dorsal raphe and neurotensin inputs from the paraventricular nucleus of the thalamus (PVT) to determine positive or negative valence of conspecific representations. Specifically, during an appetitive social interaction 5-HT is released into the vCA1 and disinhibits pyramidal neurons through 5-HT1B receptors, whereas neurotensin is released during an aversive social interaction and potentiates vCA1 neurons directly through NTR1s. Optogenetic silencing of dorsal raphe 5-HT and PVT neurotensin inputs into the vCA1 impairs positive and negative social valence, respectively, and excitation flexibly switches valence assignment. These results show how aversive and rewarding social experiences are linked to conspecific identity through converging dorsal raphe 5-HT and PVT neurotensin signals in the vCA1 that instruct opposing valence, and represent a synaptic switch for flexible social valence computation.


Conflict of interest statement

Competing interests: The authors declare no competing interests.

Figures

Fig. 1
Fig. 1. Inhibition of the dCA2 and vCA1 disrupts social memory and valence.
a, Left, schematic of the negative social valence (sv) test. Right, duration subjects spent in chamber containing the non-aggressor with a previous more neutral (ntrl) encounter or in chamber containing the aggressor with a previous more negative (neg) encounter (t17 = 4.091, P = 0.0008, n = 18). b, Left, schematic of positive social valence test. Right, duration subjects spent in chamber containing the opposite-sex partner with a previous more neutral (ntrl) encounter or in chamber containing the potential with a previous more positive (pos) encounter (t25 = 5.98, P = 0.000003, n = 26). c,d, Schematic and representative image of injection site. Social memory test: duration in chamber with familiar mouse (fm) or novel mouse (nm) and discrimination (d) scores (c, t16 = 3.841, P = 0.0014, n = 17; d, t11 = 3.885, P = 0.0025, n = 12). Negative sv, duration in either chamber and d scores (c, t16 = 4.224, P = 0.0006, n = 17; d, t11 = 3.552, P = 0.0045, n = 12). Positive sv, duration in either chamber and d scores (c, t17 = 3.817, P = 0.0014, n = 18; d, t11 = 2.817, P = 0.0168, n = 12). e, Schematic of TRAP2;Ai14 experiment. f, Quantification of tdTomato (tdT)-positive cells in brain regions (ntrl, neg, n = 7; pos, n = 6): medial septum (MS, F2,17 = 0.3618, P = 0.7016), nucleus of the diagonal band (NDB, P = 0.058), the anterodorsal (AD), anteroventral thalamus (AV) (F2,16 = 0.8131, P = 0.461, neg n = 6), anterior region of the PVT (aPVT, F2,17 = 30.08, P = 0.000003), supramammillary nucleus (SUM, F2,17 = 0.2254, P = 0.8006), dCA2 (F2,17 = 0.6871, P = 0.5165), vCA1 (P = 0.121), nucleus reuniens (RE) (F2,17 = 18.36, P = 0.00006), DR (F2,17 = 18.86, P = 0.00005) and median raphe (MR) (F2,17 = 15.05, P = 0.0002). Statistical tests: two-tailed paired Student’s t-test (ad); one-way ANOVA with Tukey’s post hoc test, Kruskal–Wallis test was used for NDB and vCA1 (f). NS, not significant; *P < 0.05, **P < 0.01, ***P < 0.001. Data are mean ± s.e.m. Scale bars, 200 μm (c,d). HC, home cage. Brain image: Jonas Töle/Wikimedia (CC0 1.0). Source data
Fig. 2
Fig. 2. Bi-directional social valence regulation by DR and PVT inputs into the vCA1.
a, Schematic of injection and representative image of AAV-DIO-hM4Di-mCh expression in the DR. b, Left, duration in chamber with familiar mouse (fm) or novel mouse (nm). Right, discrimination (d) scores (F3,36 = 0.04147, P = 0.9886, n = 13). c, Left, duration in chamber containing non-aggressor with previous neutral encounter or aggressor with previous negative encounter. Right, d scores (F3,36 = 0.3357, P = 0.7996, n = 13). d, Left, duration in chamber containing partner with previous ntrl encounter or potential mate with previous pos encounter. Right, d scores (F3,36 = 3.992, P = 0.0149, n = 13). e, Schematic of injection and representative image of AAV-DIO-hM4Di expression in the aPVT. fh, Left, duration that subjects spent in chamber containing fm or nm and d scores (F3,26 = 0.2621, P = 0.852, hM4Di n = 11; mCh n = 9) (f), non-aggressor with previous ntrl encounter or aggressor with previous neg encounter and d scores (F3,25 = 3.556, P = 0.0286, hM4Di n = 10; mCh n = 9) (g) and a partner with previous ntrl encounter or potential mate with previous positive encounter and d scores (hM4Di F3,26 = 0.7687, P = 0.522, n = 11; mCh n = 9) (h). Statistical tests: duration, two-tailed paired Student’s t-test. d score, two-way ANOVA with Šidák’s post hoc test. Wilcoxin rank test was only used for mCh saline (d) and hM4Di saline duration (h). Data are mean ± s.e.m. Scale bars, 200 μm (a,e). Brain image: Jonas Töle/Wikimedia (CC0 1.0). Source data
Fig. 3
Fig. 3. Opposing social valence regulation by DR 5-HT neurons and PVT NT neurons converging in the vCA1.
a,d,j, Schematic and representative image of virus injection in the DR (a,j) and PVT (d). b,e, Left, duration in chamber with ntrl partner or chamber with neg valenced partner (Sert-Cre (b); NT-Cre (e)). Right, d scores (b, F3,36 = 0.0446, P = 0.9873, NpHR3.0 n = 12; eYFP off n = 16, on n = 15; e, F3,35 = 6.717, P = 0.0011, NpHR3.0 n = 14; eYFP: n = 12). c,f, Left, duration in chamber with ntrl partner or chamber with positive valenced partner. Right, d scores (c, F3,39 = 7.304, P = 0.0005, NpHR3.0 n = 13; eYFP P = 0.553, off n = 17, on n = 16; f, P = 0.512, NpHR3.0 n = 14. eYFP off n = 11, on n = 12). g, Schematic of experiment. h,i, Left, time courses of average GRAB sensor transient z scores event-locked to direct interactions. Right, quantification of peak z score during interaction (h, F2,23 = 9.181, P = 0.0012, ntrl, n = 8; neg, pos, n = 9; i, F2,27 = 13.87, P = 0.000072, n = 10). k, Left, duration in chamber with neutral partner or chamber with negative valenced partner and d scores (t16 = 1.1, P = 0.2874, Tph2: n = 10; NTC: n = 8). Right, duration in chamber with neutral partner or chamber with positive valenced partner and d scores (t16 = 3.335, P = 0.0042, Tph2 n = 10; NTC n = 8). l, Representative images of virus expression in the vCA1 with TPH2 immunohistochemistry shown in magenta. Quantification of the percentage of the TPH2 area (t16 = 3.752, P = 0.0017, Tph2: n = 10; NTC: n = 8). Statistical tests: duration (b,c,e,f,k); two-tailed paired Student’s t-test, Wilcoxin rank test was only used for YFP off duration (b,f); d score (b,c,e), two-way ANOVA with Šidák’s post hoc test; d score (f), Kruskal–Wallis test with Dunn’s post hoc test; one-way ANOVA with Tukey’s post hoc test (h,i); d score (k,l), unpaired Student’s t-test. Data are mean ± s.e.m. Scale bars, 200 μm (a,d,j), 100 μm (l). Brain image: Jonas Töle/Wikimedia (CC0 1.0). Source data
Fig. 4
Fig. 4. Regulation of opposing social valence by vCA1 5-HT1BRs and NTR1s.
a, Schematic and representative image. bd, Left, duration in chamber with ntrl or neg valenced partner (b, saline t11 = 2.98, P = 0.0125; NTR1-A t11 = 0.1196, P = 0.9070; NTR2-A t11 = 2.853, P = 0.0157; 5-HT1BR-A t11 = 3.035, P = 0.0113, n = 12), ntrl or pos valenced partner (c, saline t12 = 2.447, P = 0.0308; NTR1-A t12 = 2.295, P = 0.0405; 5-HTR-A t12 = 0.4592, P = 0.6543; 5-HT1BR-A t12 = 0.8693, P = 0.4017; 5-HT1AR-A P = 0.071, n = 13), or fm or nm (d, saline P = 0.0002, n = 14; NTR1-A t11 = 2.918, P = 0.014, n = 12; 5-HT1BR-A t12 = 2.307, P = 0.03967, n = 13). eg, Time courses of GCaMP6f transient z scores event-locked to direct interactions. Right, peak z score quantification (e, F3,32 = 6.938, P = 0.001, n = 9; f, F3,32 = 17.1, P = 8.32 × 10−7, n = 9; g, F3,20 = 14.47, P = 3.94 × 10−6, n = 9). e, Left, schematic and representative image. h,i, Schematic of experiment and pie charts of cell responses (h, n = 10, i, n = 11) with representative traces. j, Left, sample traces of vCA1 pyramidal neuron spiking in response to drug. Right, quantification of spiking (P = 3 × 10−21, predrug n = 14, PD n = 11, CP n = 8). CP versus baseline results have an extra * at 60, 100–140 pA. k,l, Left, summary time course of EPSCs and IPSCs. Right, average PSC (percentage of control) with sample traces at time points 1 and 2 (k, t11 = 2.92, P = 0.0139, EPSC n = 6, IPSC n = 7; l, t14 = 3.076, P = 0.0082, EPSC, IPSC n = 8). Scale bars: 200 μm (a,e); 20 ms (x axis), 25 pA (y axis) (k,l); 100 ms (x axis), 10 mV (y axis) (h,i). Statistical tests: two-tailed paired Student’s t-test (bd); one-way ANOVA with Tukey’s post hoc test (eg); two-way ANOVA mixed-effects with Tukey’s post hoc test (j); two-tailed unpaired Student’s t-test (k,l); Wilcoxon rank test was only used for NAD299 (b) and saline (c). Data are mean ± s.e.m. Brain image: Jonas Töle/Wikimedia (CC0 1.0). Source data
Fig. 5
Fig. 5. DR 5-HT and PVT NT released into the vCA1 induce opposing social valence.
a, Top, schematic of experiment. Bottom left, schematic and representative image of injection site. Bottom right, duration in chamber with ntrl or neg valenced partner and discrimination scores (F2,24 = 3.253, P = 0.0483, n = 11). b, Top, schematic of experiment. Bottom left, schematic and representative image of injection site. Bottom right, duration in chamber with ntrl or pos valenced partner and discrimination scores (F2,21 = 11.11, P = 0.0004, n = 10). c, Schematic of experiment. dg, Left, duration in chamber containing mouse (m) 1 or object (o) 1 without previous light pairing, or in chamber containing m2 or o2, with previous light stimulation during the 10-min social interaction phase. Right, discrimination scores (d,f) mouse (d, t11 = 3.733, P = 0.0039, off n = 12, on n = 11; f, t9 = 2.483, P = 0.0348, n = 10), (e,g) object (e, t11 = 1.432, P = 0.1801, n = 12; g, t9 = 0.9567, P = 0.3637, n = 10). m1/o1 and m2/o2 are the same mice and objects in the same experiment, but not between experiments. h, Schematic of experiment. i, Left, duration in chamber with ntrl or pos valenced partner. Right, discrimination scores (F2,25 = 5.504, P = 0.0105, saline n = 10, CP, WT, n = 9). j, Left, sample traces of vCA1 pyramidal neuron spiking. Right, quantification of spiking (P = 2 × 10−15), saline, CP n = 15, WT n = 14). Asterisks are depicted for CP versus pre-CP. Wild-type (WT) versus pre-CP **40 pA, ***80–160 pA. Scale bars: 200 μm (a,b,h); 100 ms (x axis), 20 mV (y axis) (j). Statistical tests: duration (a,b,d,f,g,i), d scores; two-tailed paired Student’s t-test (dg); one-way ANOVA with Tukey’s post hoc test (a,b,i); two-way ANOVA mixed-effects with Tukey’s post hoc test (j); Wilcoxin rank test was used for NTR1-A off duration (a) and duration (e). Data are mean ± s.e.m. Brain image: Jonas Töle/Wikimedia (CC0 1.0). Source data
Extended Data Fig. 1
Extended Data Fig. 1. Without prior interaction mice do not show preference in the 3-chamber test.
a, Left, schematic of social memory test. Right, duration C57BL/6J test mice spent in chamber with familiar mouse (fm) or novel mouse (nm), which are both aggressive CD-1s under a cup with which the subjects had no prior direct interaction (t9 = 2.343, P = 0.0438, n = 10). b, Schematic of experiment and duration C57BL/6J test mice spent in chamber containing an aggressive and non-aggressive CD-1 under a cup without prior direct interaction (t7 = 0.6644, P = 0.5277, n = 8). c, Left, same data as Fig. 1a, but divided into males and females. Right, discrimination (d) scores (t16 = 0.2009, P = 0.8433, males n = 10, females n = 8). d, Schematic of experiment and duration C57BL/6J male mice spent in chamber containing C57BL/6J female in pro/estrus cycles and not in those cycles without prior direct interaction (t9 = 0.1644, P = 0.8731, n = 10). e, Left, same data as Fig. 1b, but divided into males and females. Right, d scores (t24 = 0.5349, P = 0.5976, n = 13). Statistical tests: duration (ae): two-tailed paired Student’s t-test. d scores (c, e): two-tailed unpaired Student’s t-test. NS, not significant; *P < 0.05, **P < 0.01, ***P < 0.001. Mean values are depicted. Error bars denote s.e.m. Source data
Extended Data Fig. 2
Extended Data Fig. 2. Inhibition of the vCA1 does not influence sociability and sexual behaviours.
a, b, social memory: duration subjects spent in chamber with familiar mouse (fm) or novel mouse (nm) and discrimination (d) scores (a: F3,34 = 6.693, P = 0.0011, hM4Di n = 17, mCh n = 10; b: F3,35 = 6.257, P = 0.0016, hM4Di n = 12, mCh n = 14). Negative social valence (sv): duration in chamber containing the non-aggressor with a previous ntrl encounter or in chamber containing the aggressor with a previous neg encounter and d scores (a: F3,34 = 8.018, P = 0.0004, hM4Di n = 17, mCh n = 10; b: F3,34 = 5.437, P = 0.0037, hM4Di n = 12, mCh n = 13). Positive sv: duration in chamber containing the partner with a previous ntrl encounter or in chamber containing the potential mate with a previous pos encounter and d scores (a: F3,35 = 4.622, P = 0.0079, hM4Di n = 17, mCh n = 10; b: F3,34 = 6.909, P = 0.0009, hM4Di n = 12, mCh n = 13). c, d, duration in chamber with a novel object (no) or nm and d scores (c: F3,34 = 0.8793, P = 0.4615, hM4Di n = 17, mCh n = 10; d: F3,37 = 3.258, P = 0.0323, hM4Di n = 13, mCh n = 14). e, Left, Schematic of experiment and duration subjects spent in chamber containing a conspecific male or female. Right, d scores (t9 = 0.3229, P = 0.7541, n = 10). f, Schematic of experiment and the number of times female test mice escaped from males into the separate compartment of the cage within 5 min (t4 = 0.3203, P = 0.7648, n = 5). Statistical tests, duration (af) and d scores (e, f): two-tailed paired Student’s t-test. d scores (ad): two-way ANOVA with Šidák’s post-hoc test. NS, not significant; *P < 0.05, **P < 0.01, ***P < 0.001. Mean values are depicted. Error bars denote s.e.m. Source data
Extended Data Fig. 3
Extended Data Fig. 3. Monosynaptic rabies tracing reveals multiple vCA1 and dCA2 input regions.
a, Schematic of experimental set-up. b, c, Representative images (1 of 3 mice) of injection sites in the (b) vCA1 and (c) dCA2 and respective presynaptic labelling with GFP in the Medial septum (MS), nucleus of the diagonal band (NDB), the anterodorsal (AD), anteroventral (AV) and paraventricular (PVT) thamalamic nuclei, supramammillary nucleus (SUM), nucleus reuniens (RE), dorsal (DR) and median raphe (MR). Scale bar, 200 μm. n = 3. Brain image: Jonas Töle/Wikimedia (CC0 1.0).
Extended Data Fig. 4
Extended Data Fig. 4. Inhibition of MR to dCA2 projection perturbs social memory and inhibition of RE to vCA1 projection has no effect on social memory and valence.
a, Duration that subjects spent in chamber with a novel object (no) or nm and discrimination (d) scores (F3,36 = 0.617, P = 0.6083, n = 13). b, Duration spent on previously CNO or saline paired surfaces (F3,34 = 1.948, P = 0.1404, hM4Di: n = 13; mCh: n = 12). c, Duration that subjects spent in chamber with a nm or familiar mouse (fm) and d-scores (t14 = 4.034, P = 0.0012, n = 15). d, Duration that subjects spent in chamber with a novel object (no) or nm and d scores (t14 = 1.346, P = 0.1996, n = 15). eg, Left, Duration that subjects spent in chamber with (e) fm or nm, (f) non-aggressor with previous ntrl encounter or aggressor with previous neg encounter and d scores, (g) partner with previous ntrl encounter or potential mate with previous pos encounter and d scores (e: t12 = 0.2963, P = 0.772, n = 13; f: t12 = 0.2874, P = 0.7787, saline n = 14, CNO n = 13; g: t13 = 0.9073, P = 0.3807, n = 14). h, Duration that subjects spent in chamber with a no or nm and d scores (t12 = 0.4988, P = 0.627, saline n = 14, CNO n = 13). i, Duration that subjects spent in chamber with a no or nm and d scores (F3,26 = 2.552, P = 0.0774, hM4Di: n = 11; mCh: n = 9). j, Duration spent on previously CNO or saline paired surfaces (F3,29 = 0.8432, P = 0.4814, hM4Di: n = 14; mCh: n = 9). k, l, Left, Sample traces of DR (k) and PVT (l) neuron spiking in response to CNO. Right, quantification of spiking (k: uninfected control t5 = 1.581, P = 0.1747, infected t5 = 4.583, P = 0.0059, n = 6; l: uninfected control P = 0.75, n = 6, infected P = 0.0156, n = 7). Scale bars, x-axis = 100 ms, y-axis = 10 mV. Statistical tests, duration (a, ci) and d scores (dh, k): two-tailed paired Student’s t-test. d scores (a, b, i, j): two-way ANOVA with Šidák’s post-hoc test. l, Wilcoxon rank test. NS, not significant; *P < 0.05, **P < 0.01, ***P < 0.001. Mean values are depicted. Error bars denote s.e.m. Source data
Extended Data Fig. 5
Extended Data Fig. 5. Inhibition of DR 5-HT and PVT NT inputs into the vCA1 do not influence social memory, sociability, and real time place preference (RTPP).
a, Schematic of experiment and representative images of injection site (1 of 3 mice) in the DR of Sert-Cre animals and axon innervation in the vCA1, n = 3. b, Schematic of experiment and representative images of injection site (1 of 3 mice) in the aPVT of NT-Cre animals and axon innervation in the vCA1, n = 3. c, Left, duration mice spent in chamber with familiar mouse (fm) or novel mouse (nm). Right, discrimination (d) scores (P = 0.1833, NpHR3.0: n = 13; eYFP: on n = 15, on n = 16). d, Duration that subjects spent in chamber with a novel object (no) or nm and d) scores (P = 0.4517, NpHR3.0: n = 13; eYFP: on n = 14). e, Average time spent in light paired or unpaired chambers in initial and reversal trials (F3,22 = 1.602, P = 0.2174, NpHR3.0: n = 13; eYFP: n = 6). f, Left, Duration that subjects spent in chamber with fm or nm encounter and d scores (F3,34 = 0.8096, P = 0.4974, NpHR3.0: n = 14; eYFP: off n = 12, on n = 11). g, Duration that subjects spent in chamber with a novel object (no) or nm and d scores (F3,34 = 0.1939, P = 0.8998, NpHR3.0: n = 14; eYFP: off n = 12, on n = 11). h, Average time spent in light paired or unpaired chambers in initial and reversal trials (F3,28 = 1.649, P = 0.2005, NpHR3.0: n = 10; eYFP: n = 11). i, Time courses of average RCaMP2 transient z scores event-locked to direct interactions and quantification of peak z score during interaction (Top: t2 = 30.31, P = 0.021, n = 2; Bottom: t2 = 24.95, P = 0.0016, n = 3). j, Left, time courses of average EGFP-CAAX transient z scores event-locked to direct interactions. Right, quantification of peak z score during interaction (F2,9 = 0.2688, P = 0.7702, n = 4). k, Left, representative images of AAV-sgRNA-EGFP expression in the DR with Tph2 IHC. Top right, schematic of virus injection. Bottom right, quantification of Tph2 fluorescence intensity (P = 0.0286, n = 4). l, Schematic of qPCR experiment. Fold change of Tph2 mRNA level in DR primary cultured neurons infected with AAV-Cre and AAV-sgTph2 or AAV-sgNTC, t4 = 5.027, P = 0.0073, n = 3, biological replicates. m, Left, duration that subjects spent in chamber with a novel object (no) or nm and d scores (t16 = 0.6332, P = 0.5355, Tph2: n = 10; NTC: n = 8). Right, Duration that subjects spent in chamber with a nm or familiar mouse (fm) and d scores (t16 = 1.171, P = 0.2587, Tph2: n = 10; NTC: n = 8). Statistical tests, duration (c, d, f, g, i, m): two-tailed paired Student’s t-test. (c, f, g) d scores and e, h: two-way ANOVA with Šidák’s post-hoc test. (d) d scores: Kruskal-Wallis test with Dunn’s post-hoc test. j, one-way ANOVA with Tukey’s post-hoc test. k, Mann-Whitney test. l, (m) d score: two-tailed unpaired Student’s t-test. NS, not significant; *P < 0.05, **P < 0.01, ***P < 0.001. Mean values are depicted. Error bars denote s.e.m. Scale bars, 200 μm. Brain image: Jonas Töle/Wikimedia (CC0 1.0). Source data
Extended Data Fig. 6
Extended Data Fig. 6. NTR1 agonist increases sEPSC amplitude, while 5-HT1BR agonist enhances sIPSC frequency.
a, Discrimination scores between different drug infusions into the vCA1 from Fig. 4b,c where negative social valence (sv) and positive sv were tested (negative sv: F2,26 = 3.353, P = 0.0436, n = 12; negative sv: F2,32 = 1.567, P = 0.2196, n = 13). b, c, Percentage of cells from Fig. 4k,l which showed a change or no change in their evoked EPSC/IPSC amplitudes after bath-application of PD149163 (PD) or CP93129 (CP). d, Left, recordings of spontaneous EPSCs (sEPSCs) before and after bath-application of PD and cumulative probability plot of sEPSC amplitudes with representative traces (1 of 10 cells) above (t9 = 2.628, P = 0.0274, n = 10). Scale bars, x-axis = 50 ms, y-axis = 10 pA. Right, cumulative probability plot of sEPSC inter-event intervals with representative traces (1 of 10 cells) above (t9 = 1.333, P = 0.2154, n = 10). Scale bars, x-axis = 0.50 s, y-axis=10 pA. e, Left, recordings of sIPSCs before and after bath-application of PD and cumulative probability plot of sIPSC amplitudes with representative traces (1 of 8 cells) above (t7 = 0.6492, P = 0.5369, n = 8). Right, cumulative probability plot of sIPSC inter-event intervals with representative traces (1 of 8 cells) above (t7 = 1.823, P = 0.111, n = 8). f, Left, recordings of spontaneous IPSCs (sIPSCs) before and after bath-application of CP and cumulative probability plot of sIPSC amplitudes with representative traces (1 of 9 cells) above (t8 = 0.1498, P = 0.8846, n = 9). Scale bars, x-axis = 50 ms, y-axis = 10 pA. Right, Cumulative probability plot of sIPSC inter-event intervals with representative traces (1 of 9 cells) above (t8 = 2.94, P = 0.0187, n = 9). Scale bars, x-axis = 0.50 s, y-axis = 10 pA. Scale bars, x-axis = 50 ms, y-axis = 10 pA. g, Left, recordings of sEPSCs before and after bath-application of CP and cumulative probability plot of sEPSC amplitudes with representative traces (1 of 10 cells) above (t9 = 0.4582, P = 0.6577, n = 10). Right, Cumulative probability plot of sEPSC inter-event intervals with representative traces (1 of 10 cells) above (t9 = 0.2687, P = 0.7942, n = 10). Scale bars, x-axis = 50 ms, y-axis = 10 pA. h, Left, Schematic and representative images (1 of 4 mice) of in-situ hybridization in the vCA1. Right, pie chart of cells positive and negative for Gad2 and Htr1b along with a smaller pie chart and bar graph showing the proportion of Gad2+ cells positive and negative for Htr1b. n = 4. Scale bar, 50 μm. Statistical tests: a, one-way ANOVA with Dunnett’s post-hoc test, dg, two-tailed paired Student’s t-test. NS, not significant; *P < 0.05, **P < 0.01, ***P < 0.001. Mean values are depicted. Error bars denote s.e.m. Source data
Extended Data Fig. 7
Extended Data Fig. 7. DR and PVT axon innervation as well as 5-HT1BR and NT1R expression in the vCA1 are not homogenous.
a, Schematic of one experimental condition and representative images (1 of 2 for neg-neg; 1 of 3 for neg, neg-pos, pos) displayed as merge with DAPI, tdTomato and cFos (Alexa 488). neg: t3 = 11.84, P = 0.0013, neg-neg: n = 2, neg-pos: n = 3, pos: t4 = 4.546, P = 0.0104, n = 3. Scale bars, 100 μm. b, percentage of tdTomato (tdT) and cFos double positive cells. F3,7 = 26.29, P = 0.0003, neg-neg: n = 2, neg-pos, pos-pos, pos-neg: n = 3. c, Left, schematic of experiment and representative images (1 of 2 mice) of dual injection sites in the DR and aPVT. Right, representative images of axon innervation in the vCA1. n = 2. Scale bars, 200 μm. d, Schematic of experiment. e, Left, representative images of in situ hybridization in the vCA1 (1 of 3 mice). Right, quantification of triple (above) and double (below) positive cells (F3,8 = 34.723, P = 0.00006, n = 3). Scale bars, 100 μm. Statistical test, one-way ANOVA with Tukey’s post-hoc test. NS, not significant; *P < 0.05, **P < 0.01, ***P < 0.001. Mean values are depicted. Error bars denote s.e.m. Brain image: Jonas Töle/Wikimedia (CC0 1.0). Source data
Extended Data Fig. 8
Extended Data Fig. 8. Excitation of DR 5-HT and PVT NT inputs in the vCA1 does not alter social memory nor innate valence.
a, Duration that subjects spent in chamber with a novel object (no) or novel mouse (nm) and discrimination (d) scores (t11 = 0.1971, P = 0.8474, n = 12). b, Duration that subjects spent in chamber with a nm or familiar mouse (fm) and d scores (t11 = 0.7047, P = 0.4956, n = 12). c, Average time spent in light paired or unpaired chambers in initial and reversal trials (t11 = 0.7037, P = 0.4963, n = 12). d, Number of times male subjects attempted to mount females in 5 min (t5 = 0.3492, P = 0.7412, n = 6). e, Female subjects interacted with male partners in their home cage. d score of duration female subjects spent in the compartment with male partners or in the empty compartment (t5 = 0.2499, P = 0.8126, n = 6). f, g, Duration that subjects spent in chamber with (f) no or nm (t9 = 0.5448, P = 0.5991, n = 10) and (g) fm or nm (t9 = 0.1835, P = 0.8584, n = 10) and d scores. h, Average time spent in light paired or unpaired chambers in initial and reversal trials (t9 = 0.7234, P = 0.4878, n = 10). i, Time subjects spent in open and closed arms of the elevated plus maze (F1.3,12.1 = 159.5, P = 8 × 10−9, n = 10). j, Schematic of experiment. Scale bar, 200 μm. k, l, Duration in chamber with (k) no or nm (F2,24 = 0.607, P = 0.5531, n = 9) and (l) with nm or fm (F2,24 = 2.207, P = 0.1319, n = 9) and d scores. Statistical tests: ah, two-tailed paired Student’s t-test. i, (k, l) d scores, one-way ANOVA with Tukey’s post-hoc test. NS, not significant; *P < 0.05, **P < 0.01, ***P < 0.001. Mean values are depicted. Error bars denote s.e.m. Brain image: Jonas Töle/Wikimedia (CC0 1.0). Source data
Extended Data Fig. 9
Extended Data Fig. 9. Model illustrating physiological changes in the vCA1 in response to NT and 5-HT.
DR 5-HT and PVT NT neurons innervate overlapping but not identical areas within the vCA1. During an aversive social interaction NT is released from PVT neurons into the vCA1 and binds to NTR1 receptors on vCA1 pyramidal neurons, which increases excitability. During an appetitive social interaction 5-HT is released from DR neurons into the vCA1 and binds onto 5-HT1BRs on GABAergic interneurons and inhibits their activity. By releasing the local inhibition onto vCA1 pyramidal neurons, the net excitatory drive (likely from the dCA24) onto the pyramidal neurons is increased. As there is heterogeneity in the vCA1 cell population, a subset of cells can be preferentially potentiated by NT due to higher expression of NTR1s or preferentially potentiated by 5-HT as they receive inputs from interneurons with higher expression of 5-HT1BRs. Overall, the increase in excitability in vCA1 pyramidal neurons in response to either NT or 5-HT balances social valence. The right insert highlights the converging circuitries from the PVT and DR to the vCA1, which mediates the plasticity. Credit: SciStories.

Similar articles

Cited by

References

    1. Padilla-Coreano, N., Tye, K. M. & Zelikowsky, M. Dynamic influences on the neural encoding of social valence. Nat. Rev. Neurosci.23, 535–550 (2022). - PMC - PubMed
    1. Hitti, F. L. & Siegelbaum, S. A. The hippocampal CA2 region is essential for social memory. Nature508, 88–92 (2014). - PMC - PubMed
    1. Okuyama, T., Kitamura, T., Roy, D. S., Itohara, S. & Tonegawa, S. Ventral CA1 neurons store social memory. Science353, 1536–1541 (2016). - PMC - PubMed
    1. Meira, T. et al. A hippocampal circuit linking dorsal CA2 to ventral CA1 critical for social memory dynamics. Nat. Commun.9, 4163 (2018). - PMC - PubMed
    1. Phillips, M. L., Robinson, H. A. & Pozzo-Miller, L. Ventral hippocampal projections to the medial prefrontal cortex regulate social memory. eLife8, e44182 (2019). - PMC - PubMed

MeSH terms

LinkOut - more resources