. 2025 May;57(5):1017-1031.
doi: 10.1038/s12276-025-01450-z. Epub 2025 May 1.

Microglia-driven inflammation induces progressive tauopathies and synucleinopathies

Affiliations

Microglia-driven inflammation induces progressive tauopathies and synucleinopathies

Sang Hwan Lee et al. Exp Mol Med. 2025 May.

Abstract

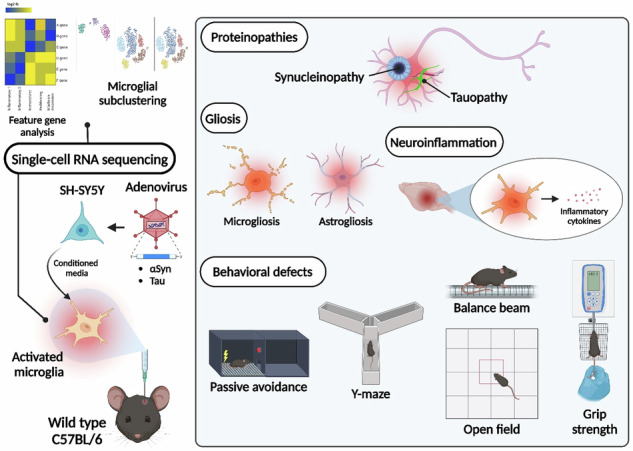
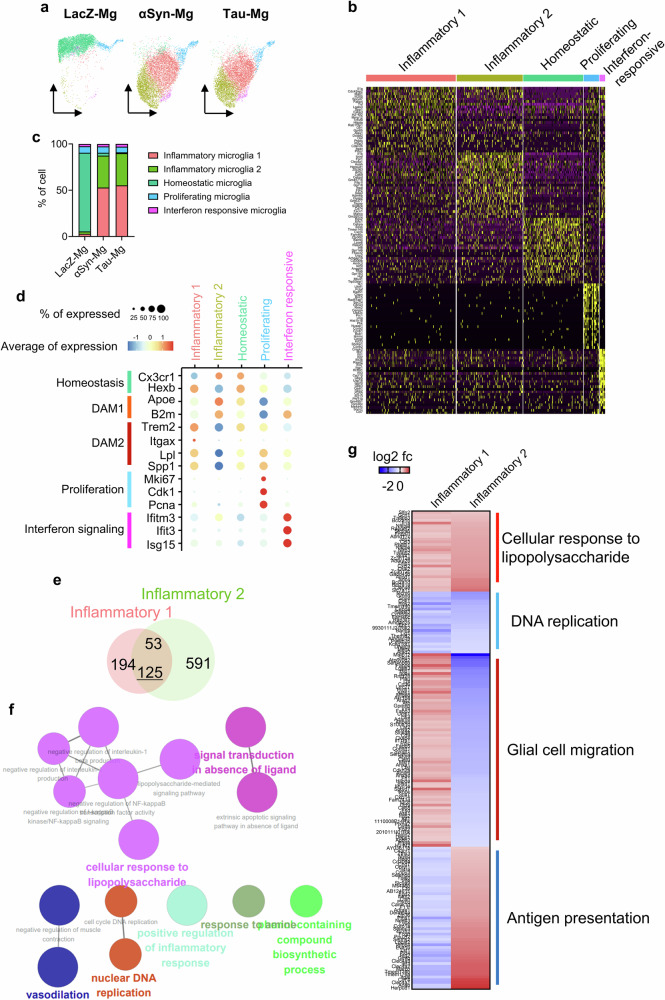
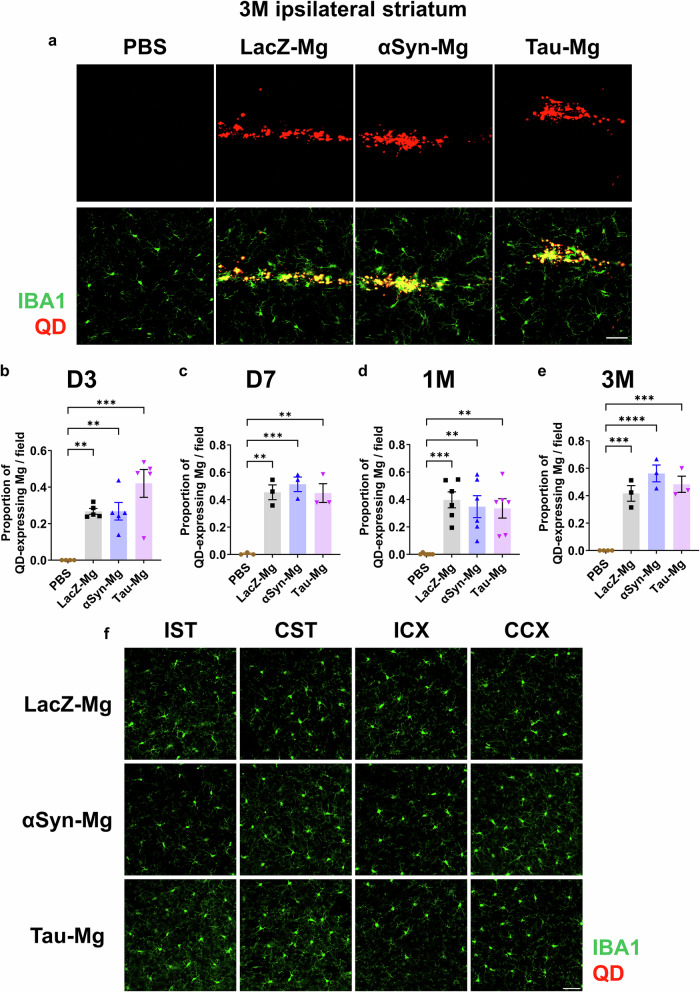
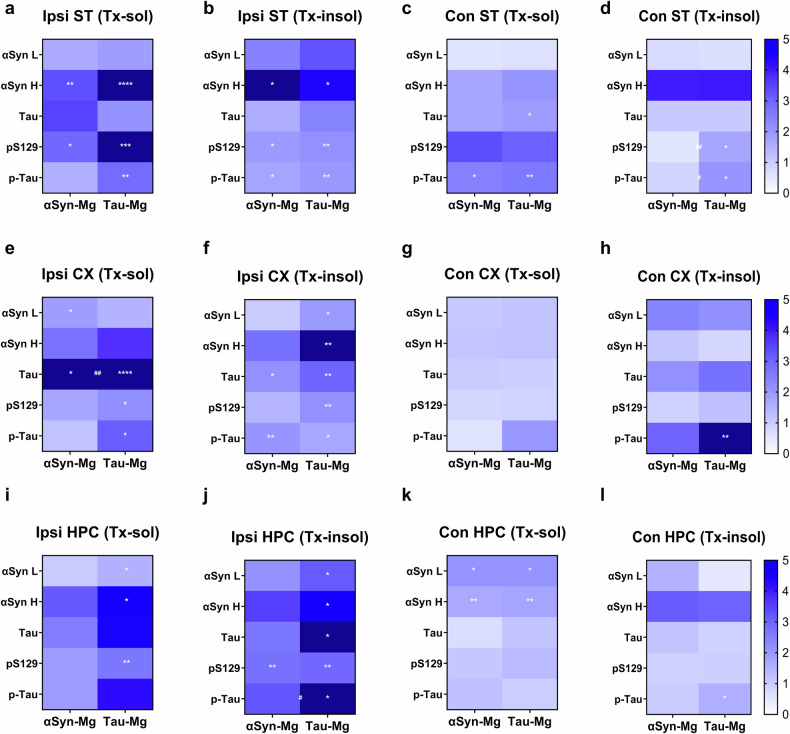
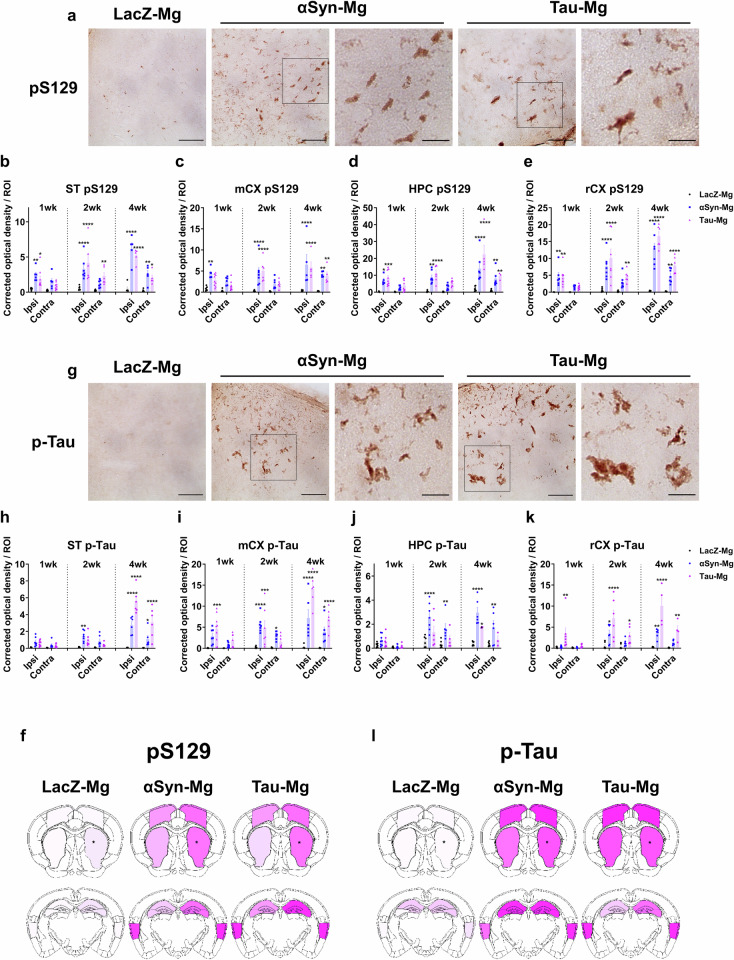
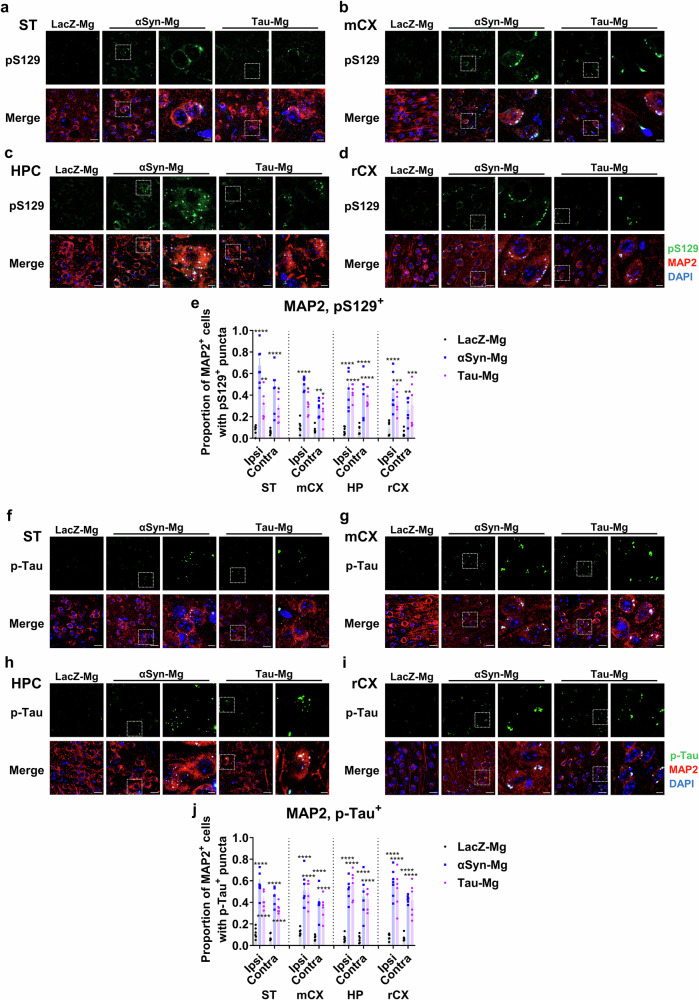
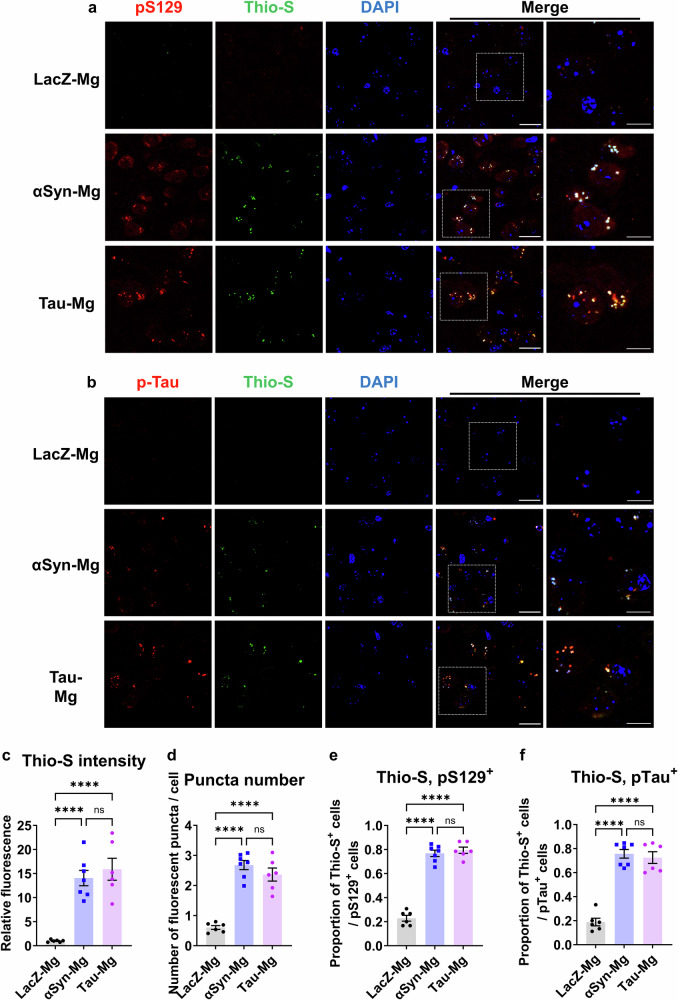
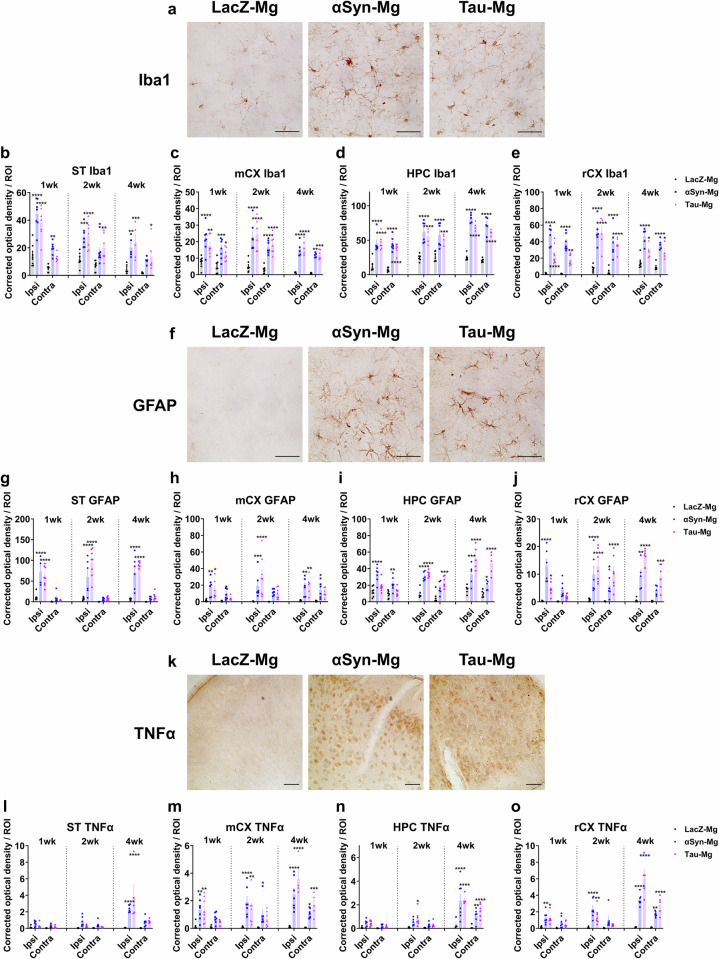
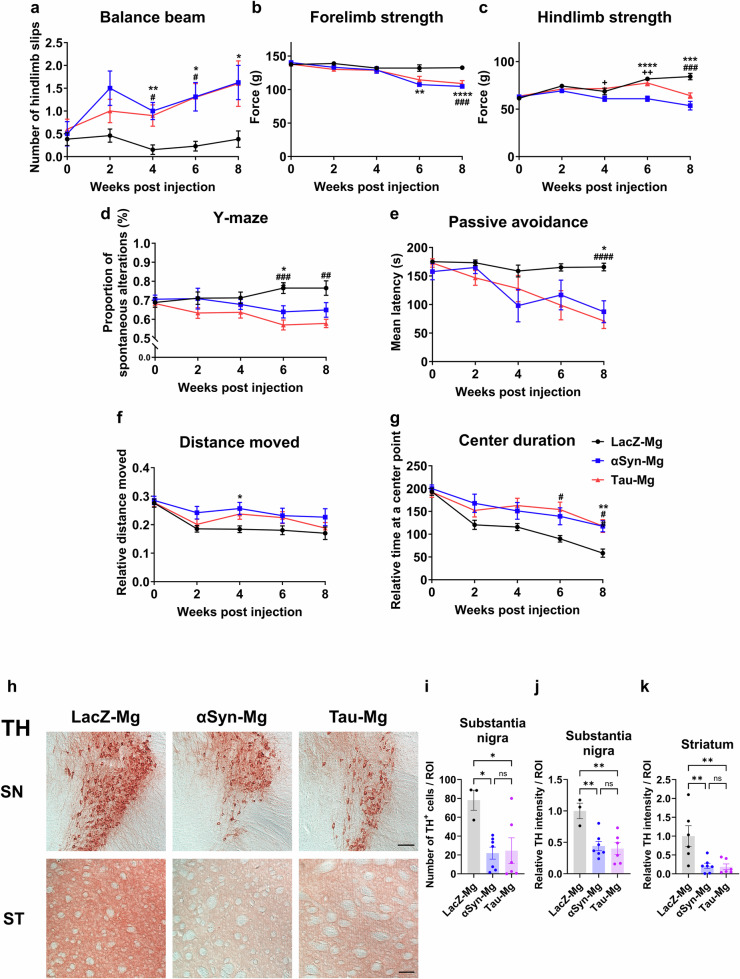
Alzheimer's disease and Parkinson's disease are characterized by distinct types of abnormal protein aggregates within neurons. These aggregates are known as neurofibrillary tangles and Lewy bodies, which consist of tau and α-synuclein, respectively. As the diseases progress, these aggregates spread from one cell to another, causing protein pathology to affect broader regions of the brain. Another notable characteristic of these diseases is neuroinflammation, which occurs when microglia become activated. Recent studies have suggested that inflammation may contribute to the formation and propagation of protein aggregates. However, it remains unclear whether microglia-driven inflammation can initiate and propagate different proteinopathies and associated neuropathology in neurodegenerative diseases. Here, using single-cell RNA sequencing, we observed that microglia exposed to α-synuclein or tau underwent changes in their characteristics and displayed distinct types of inflammatory response. The naive mice that received these microglial cell transplants developed both tauopathy and synucleinopathy, along with gliosis and inflammation. Importantly, these pathological features were not limited to the injection sites but also spread to other regions of the brain, including the opposite hemisphere. In conjunction with these pathological changes, the mice experienced progressive motor and cognitive deficits. These findings conclusively demonstrate that microglia-driven inflammation alone can trigger the full range of pathological features observed in neurodegenerative diseases, and that inflammation-induced local neuropathology can spread to larger brain regions. Consequently, these results suggest that microglia-driven inflammation plays an early and pivotal role in the development of neurodegenerative diseases. The transplantation of microglia activated by αSyn or tau proteins into the brains of naive mice resulted in the formation of synucleinopathy, tauopathy, gliosis, neuroinflammation and behavioral abnormalities. Activated microglia displayed alterations in subclusters as well as the corresponding feature genes.


Conflict of interest statement

Competing interests: S.-J.L. is a co-founder and CEO of Neuramedy Co., Ltd. The other authors declare no competing interests.

Figures

None
The transplantation of microglia activated by αSyn or tau proteins into the brains of naive mice resulted in the formation of synucleinopathy, tauopathy, gliosis, neuroinflammation and behavioral abnormalities. Activated microglia displayed alterations in subclusters as well as the corresponding feature genes.
Fig. 1
Fig. 1. The expression profiles and subtype clustering of microglia change in response to protein aggregates.
a The UMAP representation of 22,680 cells, showing the separation into five clusters. b Heatmaps of the top 100 feature genes from each subcluster shown in a. Based on these feature genes, the microglial clusters were defined as inflammatory microglia 1, inflammatory microglia 2, homeostatic microglia, proliferating microglia and interferon-responsive microglia. c A stacking bar graph displaying the percentage of cells in each cluster. Treatment of pathogenic protein aggregates reduces the resting and homeostatic populations while increasing the inflammatory microglia. d A dot plot showing the expression of relevant marker genes among each microglia cluster from the scRNA-seq dataset shown in a. In the dot plot, microglial clusters are visualized in columns and rows represent key functional genes that are differentially expressed in certain clusters. The size of each dot represents the fraction of cells in a given cluster in which the gene was detected, and the color of the dot represents the mean expression z score for the cells belonging to that cluster. e A Venn diagram comparing the feature genes in inflammatory microglia 1 and 2. The numerical values indicate the number of featured genes, with those showing reversed expression between the groups underlined. f The simplified networks of significantly enriched GO terms using 178 overlapping feature genes depicted in e. Each term in the network is statistically significant (Benjamini–Hochberg correction <0.05). The nodes (colored circles) represent significantly enriched parent GO terms, and the edges (lines between the nodes) show overlapping genes within terms. The different sizes of the nodes represent the number of enriched genes. g Heatmaps of common feature genes in inflammatory microglia 1 and 2. Enriched GO terms were identified by GO enrichment analysis.
Fig. 2
Fig. 2. QD-expressing microglia exhibit local distribution near the injection sites.
a Representative IF images of the ipsilateral striatum labeled with an antibody specific for Iba1 3 months after injection of activated microglia pretreated with QDs. Scale bar, 30 μm. be The proportion of QD-expressing microglia in the ipsilateral striatum 3 days (b), 7 days (c), 1 month (d) and 3 months (e) after injection. All data are presented as the mean ± s.e.m. Statistical significance was determined by one-way ANOVA with Tukey’s post hoc test. f Representative IF images of the brain regions labeled with an antibody specific for Iba1 3 months after injection of activated microglia pretreated with QDs. Scale bar, 50 μm. IST, ipsilateral striatum distal to injection area; CST, contralateral striatum; ICX, ipsilateral motor cortex; CCX, contralateral motor cortex.
Fig. 3
Fig. 3. Activated microglia induce phosphorylation and propagation of the αSyn and tau proteins.
al, Heatmaps showing the expression patterns of the αSyn, tau, p-αSyn (pS129) and p-tau proteins in the striatum (ad respectively), cerebral cortex (eh, respectively) and hippocampus (il, respectively). For each value, the relative expression levels of the αSyn-Mg and tau-Mg groups were colored as shown on the right after normalizing to the LacZ-Mg group. For statistical analysis, one-way ANOVA with Tukey’s post hoc test was performed as shown in Supplementary Figs. 6–17. Statistical significance is indicated with white asterisks. *LacZ-Mg versus αSyn-Mg or tau-Mg; #αSyn-Mg versus tau-Mg. αSyn L indicates 19 kDa, and αSyn H indicates molecular weights higher than 19 kDa. CX, cerebral cortex; HPC, hippocampus.
Fig. 4
Fig. 4. Synucleinopathy and tauopathy are found in the extensive brain regions after microglial transplantation.
a Representative IHC images of the motor cortex labeled with an antibody specific for pS129 4 weeks after injection. The region of interest (ROI) shown in the black box is magnified. Scale bars, 50 μm and 20 μm (for magnified images). be The relative optical density of pS129 in the striatum (b), motor cortex (c), hippocampus (d) and rhinal cortex (e) 1, 2 and 4 weeks after injection. All data are presented as the mean ± s.e.m. For statistical analysis, two-way ANOVA followed by Tukey’s post hoc test was performed. f, Heatmaps depicting the expression patterns of pS129. Asterisks mark the injection sites. g Representative IHC images of the motor cortex labeled with an antibody specific for p-tau 4 weeks after injection. The ROI shown in the black box is magnified. Scale bars, 50 μm and 20 μm (for magnified images). hk The relative optical density of p-tau in the striatum (h), motor cortex (i), hippocampus (j) and rhinal cortex (k) 1, 2 and 4 weeks after injection. All data are presented as the mean ± s.e.m. For statistical analysis, two-way ANOVA followed by Tukey’s post hoc test was performed. l Heatmaps depicting the expression patterns of p-tau. Asterisks mark the injection sites.
Fig. 5
Fig. 5. pS129 and p-tau inclusions are enriched in neuronal cells.
ad Representative IF images of the ipsilateral striatum (a), motor cortex (b), hippocampus (c) and rhinal cortex (d) costained with antibodies specific for MAP2 and pS129 1 month after injection. The ROI shown in the white box is magnified. Scale bars, 20 μm and 10 μm (for magnified images). e The proportion of MAP2+ cells with pS129+ inclusions. All data are presented as the mean ± s.e.m. For statistical analysis, two-way ANOVA followed by Tukey’s post hoc test was performed. fi Representative IF images of the ipsilateral striatum (f), motor cortex (g), hippocampus (h) and rhinal cortex (i) costained with antibodies specific for MAP2 and p-tau 1 month after injection. The ROI shown in the white box is magnified. Scale bars, 20 μm and 10 μm (for magnified images). j The proportion of MAP2+ cells with p-tau+ inclusions. All data are presented as the mean ± s.e.m. For statistical analysis, two-way ANOVA followed by Tukey’s post hoc test was performed.
Fig. 6
Fig. 6. pS129 and p-tau inclusions are Thio-S positive.
a, b Representative IF images of the ipsilateral motor cortex costained with Thio-S/pS129 (a) and Thio-S/p-tau (b) 1 month after injection. The ROI shown in the white box is magnified. Scale bars, 20 μm and 10 μm (for magnified images). cf The relative intensity of Thio-S fluorescence (c), the number of fluorescent puncta per cell (d), the proportion of pS129+ cells immunoreactive with Thio-S (e) and the proportion of p-tau+ cells immunoreactive with Thio-S (f). All data are presented as the mean ± s.e.m. For statistical analysis, one-way ANOVA with Tukey’s post hoc test was performed.
Fig. 7
Fig. 7. Gliosis and neuroinflammation are induced by transplantation of activated microglia.
a Representative IHC images labeled with an antibody specific for Iba1 in the ipsilateral motor cortex 1 month after injection. Scale bar, 50 μm. be The relative optical density of Iba1 in the striatum (b), motor cortex (c), hippocampus (d) and rhinal cortex (e) 1, 2 and 4 weeks after injection. All data are presented as the mean ± s.e.m. For statistical analysis, two-way ANOVA followed by Tukey’s post hoc test was performed. f Representative IHC images labeled with an antibody specific for GFAP in the ipsilateral rhinal cortex 1 month after injection. Scale bar, 50 μm. gj The relative optical density of GFAP in the striatum (g), motor cortex (h), hippocampus (i) and rhinal cortex (j) 1, 2 and 4 weeks after injection. All data are presented as the mean ± s.e.m. For statistical analysis, two-way ANOVA followed by Tukey’s post hoc test was performed. k Representative IHC images labeled with an antibody specific for TNFα in the ipsilateral rhinal cortex 1 month after injection. Scale bar, 100 μm. lo The relative optical density of TNFα in the striatum (l), motor cortex (m), hippocampus (n) and rhinal cortex (o) 1, 2 and 4 weeks after injection. All data are presented as the mean ± s.e.m. For statistical analysis, two-way ANOVA followed by Tukey’s post hoc test was performed.
Fig. 8
Fig. 8. Motor and cognitive defects are shown in the mice injected with activated microglia.
ac, The number of hindlimb slips on a beam (a), and forelimb (b) and hindlimb (c) strength measured to evaluate motor functions of mice. d, e The proportion of spontaneous alternations in a Y-shaped apparatus (d) and the latency to enter a dark compartment where mice had experienced a foot shock (e) measured to evaluate cognitive functions of mice. f, g The relative distance moved (f) and relative time spent at a center point (g) in an open field. All data are presented as the mean ± s.e.m. For statistical analysis, two-way repeated measures ANOVA followed by Šidák’s post hoc test was performed. *LacZ-Mg versus αSyn-Mg; #LacZ-Mg versus tau-Mg; +αSyn-Mg versus tau-Mg. hk, Representative IHC images of the SN and striatum (ST) labeled with an antibody specific for TH (h), quantifications of TH-positive cells in the SN (i) and relative TH levels in the SN (j) and ST (k). For j and k, values were normalized to the LacZ-Mg group. All data are presented as the mean ± s.e.m. For statistical analysis, one-way ANOVA with Tukey’s post hoc test was performed. Scale bar, 50 μm.

Similar articles

Cited by

References

    1. Nussbaum, R. L. & Ellis, C. E. Alzheimer’s disease and Parkinson’s disease. N. Engl. J. Med348, 1356–1364 (2003). - PubMed
    1. Binder, L. I., Guillozet-Bongaarts, A. L., Garcia-Sierra, F. & Berry, R. W. Tau, tangles, and Alzheimer’s disease. Biochim Biophys. Acta1739, 216–223 (2005). - PubMed
    1. Stefanis, L. α-Synuclein in Parkinson’s disease. Cold Spring Harb. Perspect. Med.2, a009399 (2012). - PMC - PubMed
    1. Goedert, M. Alzheimer’s and Parkinson’s diseases: the prion concept in relation to assembled Aβ, tau, and α-synuclein. Science349, 1255555 (2015). - PubMed
    1. Irwin, D. J., Lee, V. M. & Trojanowski, J. Q. Parkinson’s disease dementia: convergence of α-synuclein, tau and amyloid-β pathologies. Nat. Rev. Neurosci.14, 626–636 (2013). - PMC - PubMed

MeSH terms

LinkOut - more resources