. 2025 Jun;26(12):3075-3105.
doi: 10.1038/s44319-025-00460-2. Epub 2025 Apr 30.

mTOR controls ependymal cell differentiation by targeting the alternative cell cycle and centrosomal proteins

Affiliations

mTOR controls ependymal cell differentiation by targeting the alternative cell cycle and centrosomal proteins

Alexia Bankolé et al. EMBO Rep. 2025 Jun.

Abstract

Ependymal cells are multiciliated glial cells lining the ventricles of the mammalian brain. Their differentiation from progenitor cells involves cell enlargement and progresses through centriole amplification phases and ciliogenesis. These phases are accompanied by the sharp up-regulation of mTOR Complex 1 activity (mTORC1), a master regulator of macromolecule biosynthesis and cell growth, whose function in ependymal cell differentiation is unknown. We demonstrate that mTORC1 inhibition by rapamycin preserves the progenitor pool by reinforcing quiescence and preventing alternative cell cycle progression for centriole amplification. Overexpressing E2F4 and MCIDAS circumvents mTORC1-regulated processes, enabling centriole amplification despite rapamycin, and enhancing mTORC1 activity through positive feedback. Acute rapamycin treatment in multicentriolar cells during the late phases of differentiation causes centriole regrouping, indicating a direct role of mTORC1 in centriole dynamics. By phosphoproteomic and phosphomutant analysis, we reveal that the mTORC1-mediated phosphorylation of GAS2L1, a centrosomal protein that links actin and microtubule cytoskeletons, participates in centriole disengagement. This multilayered and sequential control of ependymal development by mTORC1, from the progenitor pool to centriolar function, has implications for pathophysiological conditions like aging and hydrocephalus-prone genetic diseases.

Keywords: Cell Cycle; Ciliogenesis; Cytoskeleton; Differentiation; mTOR.


Conflict of interest statement

Disclosure and competing interests statement. The authors declare no competing interests.

Figures
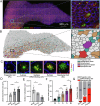
Figure 1
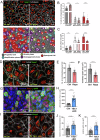
Figure 1. Ependymal cells grow apically with multiciliation.
(A) The complete lateral ventricular wall is labeled at P1 with SAS6 (deuterosomes), CENTRIN (centrioles), and ß-Catenin (cell junctions). (B) Segmented lateral ventricular wall color-coded as white cells- progenitor cells, turquoise cells- A-phase, fawn cells- G-phase, purple cells- D-phase, red cells- ependymal cells. Insets of ‘A’ and ‘B’ show acquired image and segmentation in higher magnification. (C) Cells in their respective phases of differentiation are characterized by their labeling of FOP (centrioles), DEUP1 (deuterosomes), and ß-catenin (cell junctions). (D) The area of the lateral wall is calculated by measuring the size of dissected tissue for each age group (each dot represents one wall of the lateral ventricle, n > 9; **P = 0.0031; *P = 0.0197). (E) The total number of cells on the lateral wall is calculated by extrapolating data from segmented images for each age group (each dot represents one wall of the lateral ventricle, n > 4; *P = 0.03; *P = 0.0159). (F) The apical surface area of cells in different phases of differentiation is calculated by segmentation based on cell junction markers (each dot represents one cell, n > 3; ****P < 0.0001; ***P = 0.0001; **P = 0.001; *P = 0.0266). (G) The proportion of cells is based on their differentiation status and age. Cells from A-phase, G-phase & D-phase are combined under “differentiating cells”. Data information: In (DF), data are presented as mean ± SD. ****P < 0.0001, ***P < 0.001, **P < 0.01, *P ≤ 0.05 (Student’s t test). Source data are available online for this figure.
Figure 2
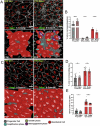
Figure 2. mTORC1 activity controls ependymal apical cell size and centriole number.
(A) P4 lateral walls from control and rapamycin-treated pups and their segmentation. Cells are color-coded based on their stage of differentiation. Scale bar: 10 μm. (B, C) Percentage (B) and size of the apical surface (C) of progenitor, differentiating and mature ependymal cells in rapamycin and control conditions; *P = 0.0429 in (B) and 0.0135 in (C); **P = 0.0024 in (C) and ****P < 0.0001 in (B, C). (D) P4 ventricular wall in control and rapamycin-treated pups, showing centrioles with FOP, deuterosomes with Deup1, and cell junctions with ß-catenin. (E, F) Number of centrioles (E) and area occupied by centriolar patch in differentiated cells at P4 (F). (G) En face view showing expression of p-rpS6 and Foxj1 in Control and Tsc1 cKO. (H) pS6 mean gray intensity in Foxj1+ cells in control and Tsc1 cKO. (I) P0 brain lateral ventricular en face labeled with Fop (centrioles, red), b-Catenin (cell junction, white), and deup (deuterosome, green) of control and Tsc1ko/lox; Nestin-cre (Tsc1 cKO) mice. (J, K) Number of centrioles and size of the centriolar patch in differentiated cells in Tsc1 cKO and controls at P0. Each dot in the quantifications corresponds to one cell (n > 3); ****P < 0.0001 in (E, F, H, J, K). Data information: In (B, C, E, F, H, J, K), data are presented as mean ± SD. ****P < 0.0001, ***P < 0.001, **P < 0.01, *P ≤ 0.05 (Student’s t test). Source data are available online for this figure.
Figure 3
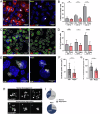
Figure 3. mTOR inhibition by rapamycin inhibits ependymal cell differentiation.
(A) Representative images of primary cells at div 4 immunolabeled with FOP (centrioles) and pS6 antibodies in control and rapamycin conditions. (B) Percentage of multicentriolar cells at different time points in the indicated conditions; ns P = 0.3684; ****P < 0.0001. (C) Representative segmented images of primary cells at div 4 immunolabeled with FOP and FoxJ1. Each cell mentions its mean gray intensity of the Foxj1 signal. (D) The percentage of Foxj1+ cells is calculated by setting a threshold and relying on automated intensities; ns P = 0.4150; *P = 0.027; ****P < 0.0001. (E) Representative images of primary cells at div 8 immunolabeled with FOP in control and rapamycin conditions. Turquoise boundaries show manual demarcation of the centriolar patch area. (F) The size of the centriole patch area at div 8 in control and rapamycin conditions; ****P < 0.0001. (G) Number of centrioles per differentiated cells at div 8 in control and rapamycin condition; one dot corresponds to one replicate; ****P < 0.0001. (H) Single-cell monitoring of centriole amplification dynamics in differentiating Cen2GFP+ progenitors between div 4 and 6 in control or the presence of rapamycin. Representative images from three time points showing normal disengagement of centrioles in control (top) and deuterosomes regrouping (bottom) in rapamycin-treated cells. (I) Percentage of cells with regrouped centrioles after the disengagement phase; each dot is one cell. Data information: In (B, D, F, G), data are presented as mean ± SD. ****P < 0.0001, *P ≤ 0.05, ns not significant (Student’s t test). Source data are available online for this figure.
Figure 4
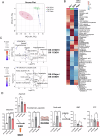
Figure 4. mTORC1 controls metabolic rewiring during ependymal cell differentiation.
(A) Metabolome-based principal component analysis (PCA) of the indicated cellular settings. (B) Heatmap showing modules of metabolites in progenitors undergoing differentiation in the presence or the absence of rapamycin using a hierarchical clustering approach. (C) Volcano plots of metabolites differentially modulated in ependymal cells compared to progenitors (top panel) or ependymal cells treated or not with Rapamycin (bottom panel). P value was calculated using Student’s t test, n = 3. (D) Summary of the metabolic profiling of the pyrimidine synthesis pathway in ependymal cells at Dif 1 and Dif 4 treated or not with Rapamycin. Data information: The bars represent the mean +/− SEM, each dot is one replicate, n = 3. **P < 0.01, *P ≤ 0.05 (Student’s t test).
Figure 5
Figure 5. Expression of cell cycle genes after rapamycin treatment.
(A) Cells at dif 3 were treated 25 h with vehicle (EtOH) or with Rapamycin at 20 nM, then proteins were extracted for western blot analysis, and extracts were probed with the indicated antibodies. (B) Fold change of EtOH-treated cells over Rapamycin-treated cells of the indicated proteins relative to the indicated loading control. Data information: The bars represent the mean +/− SEM, n = 3. P values were determined using a two-sided Student’s t test. *P = 0.0380, **P = 0.0077, ***P = 0.0009. Source data are available online for this figure.
Figure 6
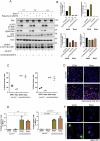
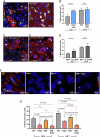
Figure 6. MCIDAS and E2F4 overexpression upregulates mTORC1 and drive rapamycin-insensitive multiciliogenesis in both ependymal cells and fibroblasts.
(A) Immunoblot analysis of ependymal cells at Dif 4 after adenoviral transduction with MCIDAS/E2F4 or GFP control virus. (B) Fold change of MCIDAS/E2F4 or rapamycin-treated cells over control ependymal cells of the indicated proteins relative to the indicated loading control. The bars represent the mean +/− SEM, n = 3. (C) Percentage of multicentriolar and multiciliated ependymal cells in the indicated conditions. The bars represent the mean +/− SEM, n = 2. (D) Representative images of ependymal cells at dif 4 immunolabeled with FOP (centrioles) and GT335 (cilia) in adenoviral GFP or MCIDAS/E2F4 or rapamycin conditions. (E) Percentage of multicentriolar and multiciliated mouse embryonic fibroblasts in the indicated conditions. The bars represent the mean +/− SEM, n = 3. P values were determined using a two-sided Student’s t test. *P < 0.05 and **P < 0.01. (F) Representative images of mouse embryonic fibroblasts immunolabeled with FOP (centrioles) and GT335 (cilia) in adenoviral GFP or MCIDAS/E2F4 or rapamycin conditions. Source data are available online for this figure.
Figure 7
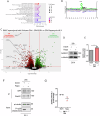
Figure 7. Phosphoproteomic screening of div 4 ependymal cells treated 25 h EtOH versus div 4 ependymal cells treated 25 h Rapamycin.
(A) Gene ontology analysis, using ShinyGo, shows statistically significant gene set enrichments by comparing the IMAC statistically significant differentially phosphorylated proteins versus the entire IMAC enrichment set. (B) Consensus motif generated from all the statistically significant differentially phosphorylated proteins. (C) Volcano plots of IMAC enrichment. The x axis shows the log2-ratio for phosphopeptides between samples and the y axis shows the −log10 P value. The horizontal red bar represents the statistical cut-off of significance (P value of 0.05) using Student’s t test, n = 2. Red dots represent downregulated phosphopeptides in the 25 h Rapamycin-treated cells and green dots represent upregulated phosphopeptides. Representative peptides are shown. (D) Cells at dif 3 were treated 25 h with vehicle (EtOH) or with Rapamycin at 20 nM then proteins were extracted for Western Blot analysis, and these extracts were probed with GAS2L1 antibodies. (E) Densitometry quantification of the immunoblot analysis. The bars represent the mean +/− SEM, n = 3. P values were determined using a two-sided Student’s t test. *P < 0.05. (F) In vivo labeling, less radioactive phosphates are incorporated when cells are treated 25 h with rapamycin. (G) Scatter plot of the two experiments of in vivo labeling. Source data are available online for this figure.
Figure 8
Figure 8. GAS2L1 phosphorylation promotes centriolar disengagement.
(A) Immunoblot analysis of ependymal cells at dif 4 after adenoviral transduction with the indicated vectors. (B) Representative images of ependymal cells at dif 4 immunolabeled with FOP (centrioles) and GAS2L1 after adenoviral transduction as indicated. (C, D) Percentage of ependymal cells according to the centriole number in the indicated conditions. ****P ≤ 0.0001/***P ≤ 0.001/**P ≤ 0.01/*P ≤ 0.05 (Student’s t test). (E) Average centriole number in multiciliated cells of the indicated conditions. (F) Number of centrioles per ependymal surface. The bars represent the mean +/− SEM, n > 5 of independent experiments in which at least 200 cells were counted. P values were determined using a two-sided Student’s t test. *P < 0.05 and **P < 0.01. (G) Schematic representation of the proposed model for mTORC1 regulation of ependymal cell differentiation. Source data are available online for this figure.
Figure EV1
Figure EV1. mTORC1 signaling pathway is active during centriole amplification.
(A, B) P4 brain lateral ventricular en face, labeling Centrin (centrioles, white), p-rpS6 (red) and GT335 (cilia, green) or p21 (green) in (A, B), respectively. (C) Ependymal cells in respective phases of differentiation characterized by their staining of Centrin (centrioles, white) and GT335 (cilia, green), and p-rpS6 (red). It is worth noting that the expression of p-rpS6 is during the intermediate stages of differentiation. (D) Regression plot testing the correlation between apical area and centriole number in mature ependymal cells in Tsc1 cKO at P0, rapamycin injected pups at P4 and their respective controls, R2 is the correlation coefficient; ns P = 0.0542; **P = 0.0023; ***P = 0.0001; ****P < 0,0001. Data information: In (D), **P < 0.01, ***P < 0.001, ****P < 0.0001 (Pearson’s correlation test). n = number of cells >50. Scale bars: 10 μm.
Figure EV2
Figure EV2. Long-term effect of rapamycin treatment.
(A) Lateral ventricular wall of mice at P10 injected with rapamycin every day between P0 and P4 and labeled with Fop (centrioles, red), Deup (deuterosomes, green) and β-Catenin (cell junction, white). Corresponding segmented images are shown below. (B) Percentage of cells at each stage of differentiation at P10; **P = 0.0022; ****P < 0.0001. (C) Lateral ventricular wall of mice at P30 injected with rapamycin every day between P0 and P4 and labeled with Fop (centrioles, red), Deup (deuterosomes, green) and β-Catenin (cell junction, white). Corresponding segmented images are shown below. (D) Percentage of cells at each stage of differentiation at P30; ns P = 0.9039. (E) Quantification of the size of the apical surface of progenitor and mature ependymal cells in rapamycin and control conditions at P30; * P = 0.0470; ***P = 0.0005. Scale bars: 8.5 μm. Data information: In (B, D, E), data are presented as mean ± SD. ****P < 0.0001, ***P < 0.001, **P < 0.01, *P ≤ 0.05, ns not significant (Student’s t test).
Figure EV3
Figure EV3. In vitro stages of ependymal differentiation.
(A) Representative images of Cen2GFP+ cells at different stages of basal body formation during ependymal cell differentiation in vitro. (B) Representative images of primary cells at div 4 immunolabeled with FOP and α-Tubulin (DM1a) or Phalloidin and GT335 in control and rapamycin conditions. (C) Representative images of primary cells at dif 4 in control and Torin conditions. Control is the same as in Fig. EV4D, as the experiments were carried out in parallel. (D) Percentage of multicentriolar cells at different time points in the indicated conditions; **P = 0.0022. Data information: (D) presents data as mean ± SEM. **P < 0.01 (Mann–Whitney test); n = 3. Scale bars: 10 μm (A, B), 20 μm (C).
Figure EV4
Figure EV4. Inactivation of Tsc1 in Nestin progenitor cells leads to increased ependymal cell differentiation, while S6K inactivation does not abolish rapamycin sensitivity.
(A) Representative images of primary cells from control and Tsc1 cKO mice at div 4 immunolabeled with FOP (centrioles), GT335, and pS6 antibodies. (B) Percentage of multicentriolar cells at div 4 and div 8; ****P < 0.0001; ns P = 0.8182. (C, D) Representative images of primary cells from Tsc1fl/fl mice infected with GFP (C) or Cre-GFP Adenovirus. Cells are immunolabeled with FOP and pS6 antibodies. Control is the same as in Fig. EV3C, as the experiments were carried out in parallel. (E) Percentage of multicentriolar cells at div 4 and div 8 in all conditions; *P = 0.043; ns P = 0.6991. (F) Representative pictures of wild-type or S6K−/− primary cells at 4 days in vitro, immunolabelled with pS6 as a marker of mTORC1 and FOP to detect multibasal bodies (MBB) cells in differentiated cells. The top panels are cells treated with vehicle (EtOH), and the bottom panels are cells treated with 20 nM Rapamycin. The arrows show examples of MBB cells. div differentiation in vitro, WT wild type. (G) Fold changes of differentiated ependymal cell number by counting cells with multibasal bodies. The bars represent the mean +/− SEM; each dot is one replicate, n = 6. P values were determined using a two-sided Student’s t test. **P < 0.01 and ***P < 0.001. Data information: In (B, E), data are presented as mean ± SD. ****P < 0.0001, *P ≤ 0.05, ns not significant (Student’s t test). In (G), the bars represent the mean +/− SEM; each dot is one replicate, n = 6. P values were determined using a two-sided Student’s t test. **P < 0.01 and ***P < 0.001. Ctrl Control.
Figure EV5
Figure EV5. Metabolic rewiring by mTORC1.
(A) KEGG-based pathway enrichment analyses of the metabolomes of progenitors and ependymal cells (left panel), or ependymal cells treated or not with Rapamycin. (B) Summary of the metabolic profiling of the aspartate metabolism in progenitors and ependymal cells treated or not with Rapamycin. (C) Levels of the indicated metabolites involved in glutamine metabolism in progenitors and ependymal cells treated or not with Rapamycin. (D) Levels of UDP in progenitors and ependymal cells treated or not with Rapamycin. (E) Scheme depicting the phospholipids biosynthesis pathways and highlighting the requirement of CTP and DAG for the second and third steps, respectively. (F) Ratios of the indicated metabolites and levels of G3P in progenitors and ependymal cells treated or not with Rapamycin. Data information: For (B, C, D, F), the bars represent the mean +/− SEM, each dot is one replicate, n = 3. Data are presented as mean ± SD. ****P < 0.0001, ***P < 0.001, **P < 0.01, *P ≤ 0.05 (Student’s t test).

References

    1. Al Jord A, Shihavuddin A, Servignat d’Aout R, Faucourt M, Genovesio A, Karaiskou A, Sobczak-Thepot J, Spassky N, Meunier A (2017) Calibrated mitotic oscillator drives motile ciliogenesis. Science 358:803–806 - PubMed
    1. Al Jord A, Spassky N, Meunier A (2019) Motile ciliogenesis and the mitotic prism. Biol Cell 111:199–212 - PubMed
    1. Atkin J, Halova L, Ferguson J, Hitchin JR, Lichawska-Cieslar A, Jordan AM, Pines J, Wellbrock C, Petersen J (2014) Torin1-mediated TOR kinase inhibition reduces Wee1 levels and advances mitotic commitment in fission yeast and HeLa cells. J cell Sci 127:1346–1356 - PMC - PubMed
    1. Au FK, Jia Y, Jiang K, Grigoriev I, Hau BK, Shen Y, Du S, Akhmanova A, Qi RZ (2017) GAS2L1 is a centriole-associated protein required for centrosome dynamics and disjunction. Dev Cell 40:81–94 - PubMed
    1. Au FKC, Hau BKT, Qi RZ (2020) Nek2-mediated GAS2L1 phosphorylation and centrosome-linker disassembly induce centrosome disjunction. J Cell Biol 219:e201909094 - PMC - PubMed

Substances

LinkOut - more resources