. 2025 Apr 30;23(1):494.
doi: 10.1186/s12967-024-05907-z.

Inhibition of VEGF signaling prevents exhaustion and enhances anti-leukemia efficacy of CAR-T cells via Wnt/β-catenin pathway

Affiliations

Inhibition of VEGF signaling prevents exhaustion and enhances anti-leukemia efficacy of CAR-T cells via Wnt/β-catenin pathway

Suwan Wu et al. J Transl Med. .

Abstract

Background: Current challenges in Chimeric Antigen Receptor (CAR) -T cell therapy for hematological cancers include T cell exhaustion and limited persistence, which contribute to cancer relapse.

Methods: The effects of Axitinib, a VEGFR inhibitor, on the biological functions of CAR-T cells in vitro and in vivo were investigated by comparing CAR-T cells pre-treated ex vivo with Axitinib, as well as utilizing a B-ALL mouse model. Real-time quantitative PCR and Western blotting were employed to detect the expression of molecules related to differentiation, exhaustion, and the Wnt pathway in CAR-T cells. Flow cytometry was used to assess changes in CAR-T cell differentiation, exhaustion, activation, apoptosis, proliferation, and cytokine secretion. Western blotting and flow cytometry were used to assess changes in VEGFR expression. Bioluminescence imaging, flow cytometry, and immunohistochemistry (IHC) analysis were used to evaluate changes in tumor burden in mice receiving different treatments, while hematoxylin and eosin (H&E) staining were used to monitor histological changes in the liver and spleen of mice.

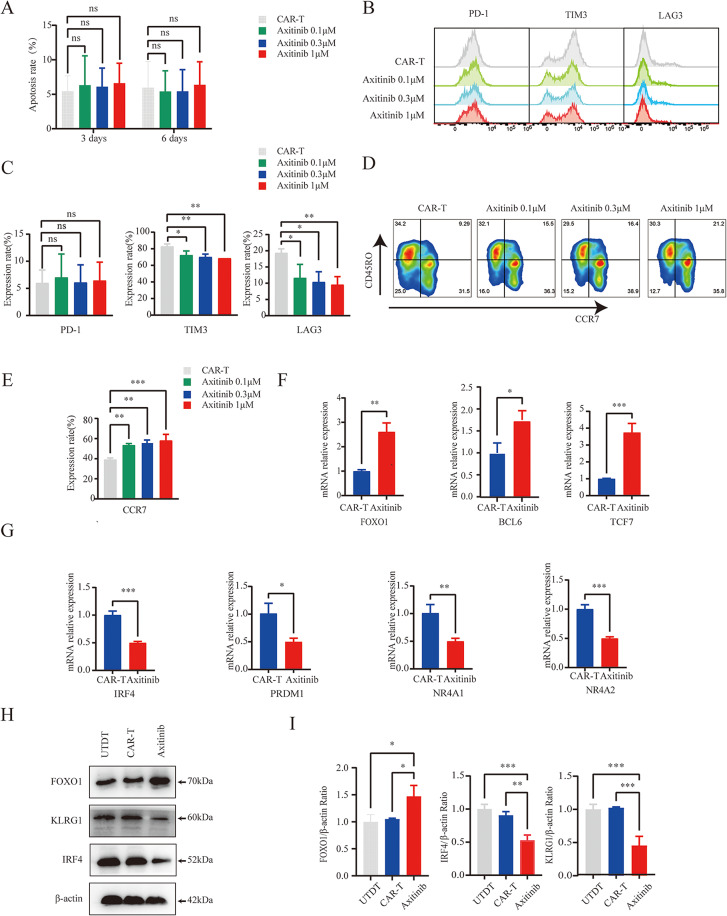
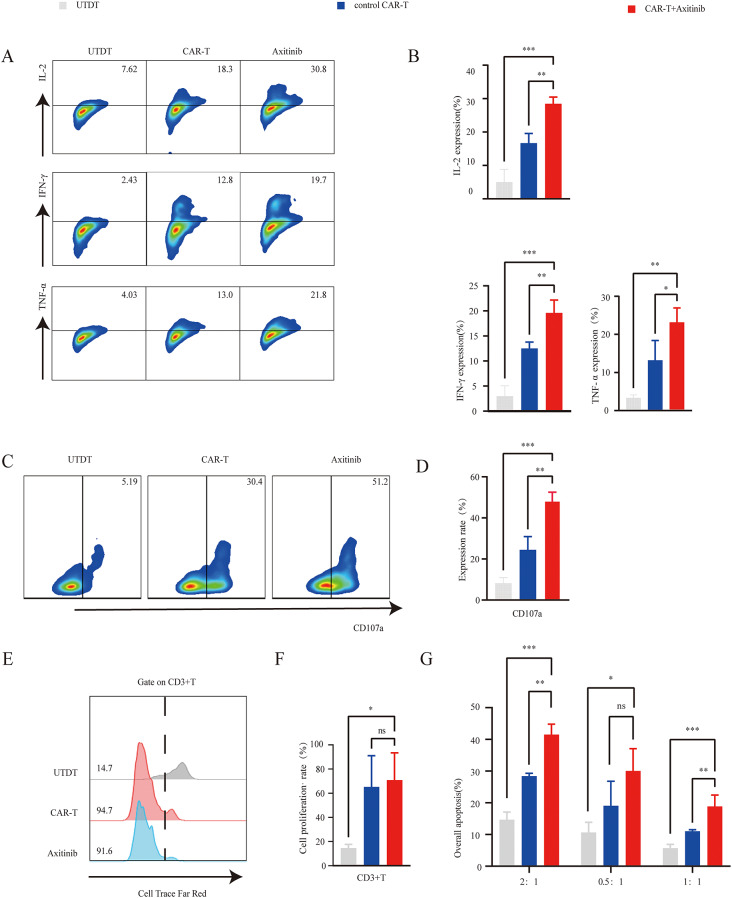
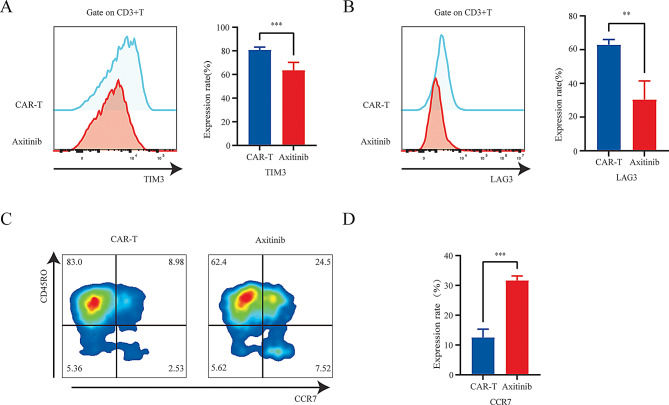
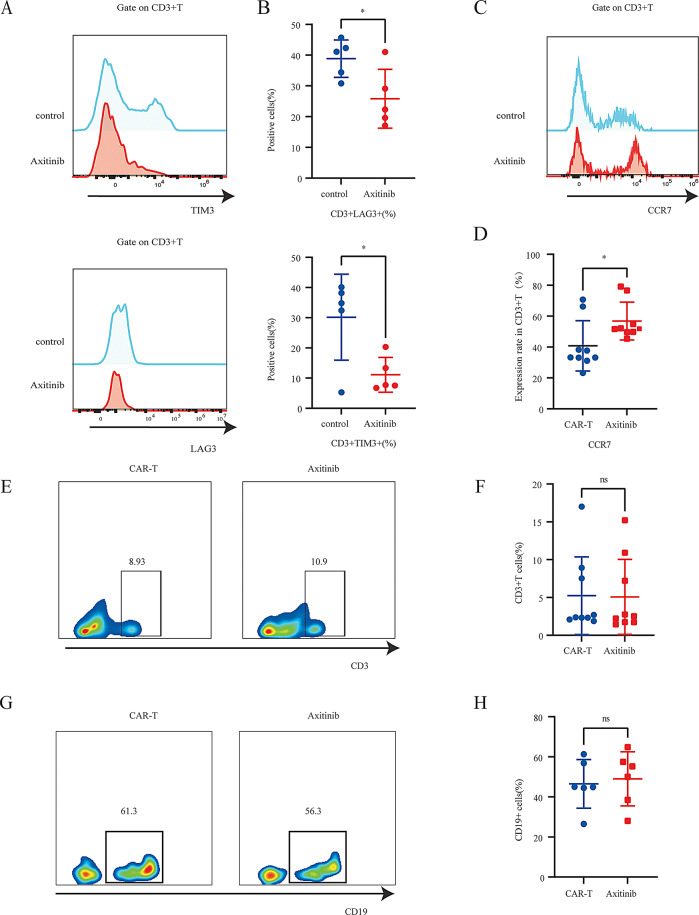
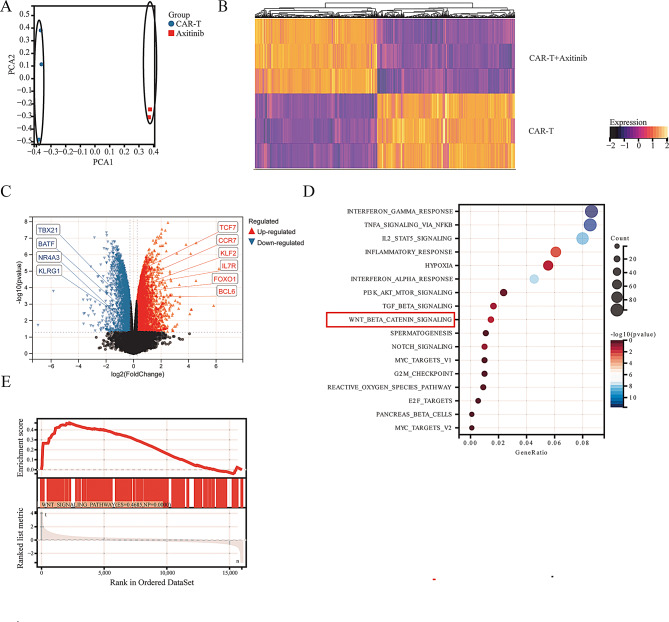
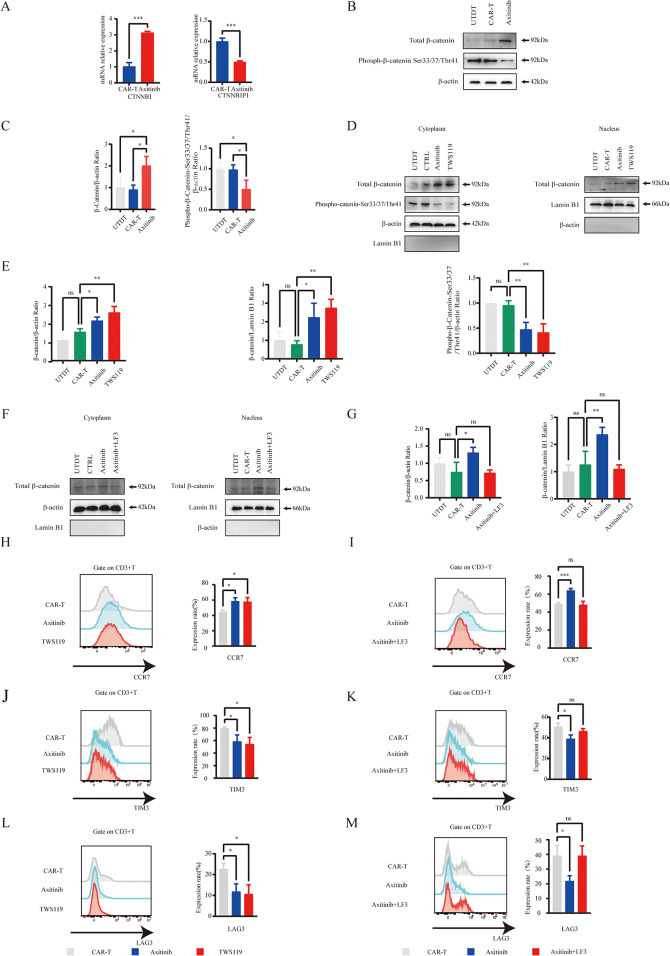
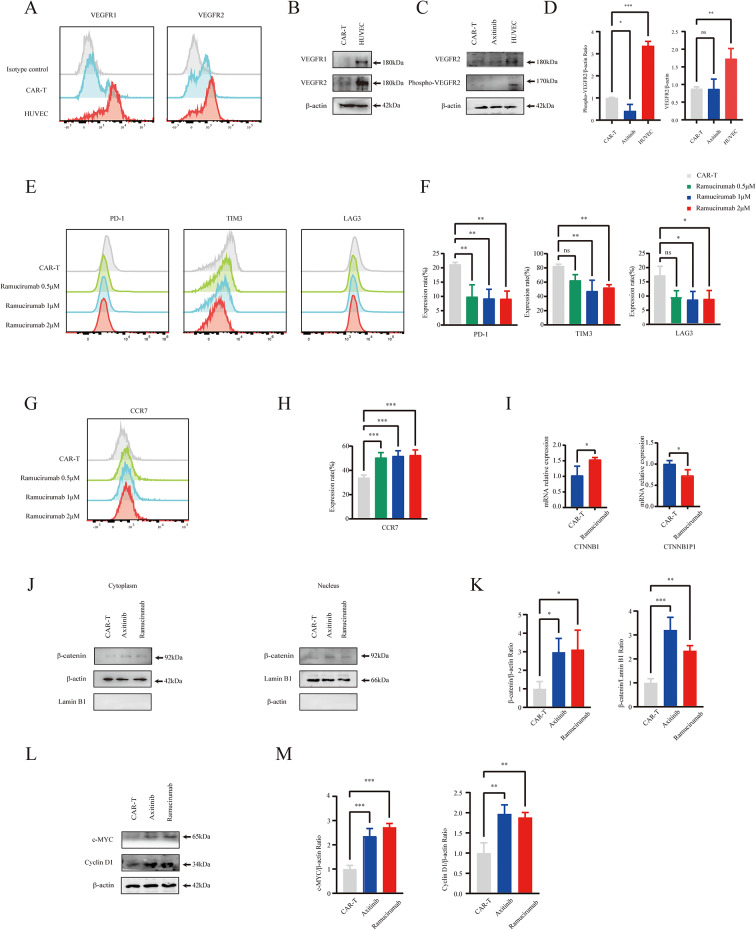
Results: Axitinib treatment notably reduced CAR-T cell exhaustion and terminal differentiation both under tonic signaling and tumor antigen exposure scenarios. Furthermore, CAR-T cells pretreated with Axitinib demonstrated enhanced anti-tumor efficacy and prolonged survival in vivo. Mechanistically, Axitinib treatment upregulated the Wnt/β-catenin signaling pathway in CAR-T cells. Using agonists/inhibitors of the Wnt/β-catenin pathway could respectively mimic or counteract the effects of Axitinib on CAR-T cell exhaustion and differentiation. CAR-T cells treated with Axitinib can inhibit the VEGFR2 pathway. CAR-T cells treated with anti-VEGFR2 antibody can activate the Wnt/β-catenin pathway and prevent CAR-T cell exhaustion.

Conclusion: Axitinib confers resistance to exhaustion in CAR-T cells by modulating the Wnt/β-catenin signaling pathway.

Keywords: Acute lymphoblastic leukemia; Chimeric antigen receptor T cells; Differentiation; Exhaustion; Vascular endothelial growth factor receptor.


Conflict of interest statement

Declarations. Ethical approval: This study was authorized and supervised by the Ethics Committee of the Zhujiang Hospital of Southern Medical University. All participants provided written informed consent before enrollment. Animal experiments were conducted in line with the Guide for the Care and Use of Laboratory Animals. Consent for publication: Not applicable. Competing interests: The authors declare that they have no competing interests.

Figures

Fig. 1
Fig. 1
In vitro, Axitinib treatment suppresses the terminal differentiation and exhaustion of CAR-T cells. (A) CD19 CAR-T cells were treated with increasing concentrations of Axitinib for 3 days or 6 days and apoptosis was determined by flow cytometry (n = 3). (B-E) Flow cytometry analysis of exhaustion markers (PD-1, TIM3 and LAG3) and memory markers (CCR7 and CD45RO) on CD3 + T cells (n = 3). (F) qPCR analysis of memory-associated genes (FOXO1, TCF7, and BCL6) in both control vs. 1 μM Axitinib treated CAR-T cells (6 days; n = 3). (G) qPCR analysis of genes associated with terminal differentiation (IRF4, PRDM1, NR4A1, and NR4A2) under the same conditions. (H, I) Western blot analysis to assess the expression levels of FOXO1, KLRG1, and IRF4 in control and Axitinib treated CAR-T cells (1µM, 6 days, n = 3). β-actin was used as a loading control. Statistical plots showed the ratio of protein intensity (IntDen) to β-actin from triplicate experiments. All experimental data were presented as the mean ± SD. * P < 0.05, ** P < 0.01, *** P < 0.001, ns (not significant)
Fig. 2
Fig. 2
Assessment of the immune response of CAR-T cells to specific antigens. (A, B) Flow cytometry analyses were performed on T cells cultured with Nalm6 cells for 5h to assess the cytokine production (IL-2, IFN-γ, and TNF-α, n = 3). (C-D) Degranulation (CD107a expression) was examined under the same conditions (n = 3).Representative flow cytometry visuals gating on CD3 + cells (left) and statistical graphs (right) are presented. (E, F) Proliferation rates of T cells were investigated after antigen-specific stimulation using a 48-hour Cell Trace Far Red dilution assay. (G) Different T cells were co-incubated with luciferase/GFP/Nalm6 cells at various E:T ratios for 5 h. Apoptosis rates of luciferase/GFP/Nalm6 cells were detected by flow cytometry (n = 3). The apoptotic cells were defined as Annexin+. All experimental data were presented as the mean ± SD. * P < 0.05, ** P < 0.01, *** P < 0.001, ns (not significant)
Fig. 3
Fig. 3
Axitinib enhances the antitumor activity of CAR-T cells in vivo. (A) Treatment schedule and experimental setup: B-NDG mice were administered 5 × l05 Nalm6 cells on day 0. 1 × l06 untransduced T cells or 4-1BB CD19-CAR-T cells were adoptively transferred via intravenous infusion on day 6. (B) D5-32 bioluminescence imaging of tumor growth (n = 5). (C) Bioluminescent signal in the dorsal region was represented for individual mice in each group. Bioluminescent imaging data were depicted as photons s–1 cm–2 sr–1 in regions of interest over the whole body of each mouse. P values were provided for Axitinib treated CAR-T cells group compared to control CAR-T cell group (Unpaired Student’s test). (D) Kaplan-Meier survival curves showed that the survival of mice was significantly improved in the Axitinib treated CAR-T cells group. (E) Scatter plots exhibited the frequency of tumor blasts (GFP+) in the spleen, and BM at the experimental endpoint (day 24, n = 5). (F) Representative photomicrographs of IHC staining for human CD19, showing tumor infiltration in the kidney, liver and spleen in different treatment conditions. Scale bar: 20 μm. All experimental data were presented as the mean ± SD. For D, statistical significance was calculated by two-sided log-rank Mantel–Cox tests. * P < 0.05, ** P < 0.01, *** P < 0.001, ns (not significant)
Fig. 4
Fig. 4
Axitinib mitigates the terminal differentiation and exhaustion of CAR-T cells induced by exposure to tumor antigens. CAR-T cells were co-cultured with Nalm6 cells at a 1:1 ratio for 2 days. The residual CAR-T cells were harvested and treated with DMSO or Axitinib (1µM) for 6 days. Flow cytometric analysis was performed to assess the expression of (A-B) inhibitory receptor (TIM-3, and LAG-3) and (C-D) differentiation markers (CCR7and CD45RO) on CD3 + T cells. All data were presented as the mean ± SD. * P < 0.05, ** P < 0.01, *** P < 0.001, ns (not significant)
Fig. 5
Fig. 5
Axitinib reverses T cell differentiation and exhaustion in BMMCs from B-ALL patients. After isolation from B-ALL patients, BMMCs were co-cultured with DMSO or Axitinib. Flow cytometry was employed to assess (A, B) the expression of exhaustion markers (TIM3, LAG3, n = 5) and (C, D) differentiation marker (CCR7, n = 9) on CD3 + T cells within patient-derived BMMCs. Flow cytometry was utilized to determine the proportions of (E, F) CD3 + T cells (n = 9) and (G, H) CD19 + tumor cells (n = 6) within patient-derived BMMCs. All data were presented as the mean ± SD. * P < 0.05, ** P < 0.01, *** P < 0.001, ns (not significant)
Fig. 6
Fig. 6
RNA-seq analysis of control and Axitinib-treated CAR-T groups. (A) PCA of CAR-T cells from the control and Axitinib-treated groups. (B) Heatmap displaying the Log2TPM values of 1,969 DEGs clustered by Z-score, comparing Axitinib-treated vs. control groups. (C) Volcano plot illustrating the significant DEGs in the Axitinib-treated group vs the control group. Red or blue dots represent genes with upregulated or downregulated expression, characterized by |log2 fold change| >1.2 and P < 0.05, respectively. (D) Gene enrichment analysis performed using the clusterProfiler package in R (version 3.14.3), presented as a bubble plot. (E) GSEA showing the activation of the Wnt pathway in CAR-T cells treated with Axitinib
Fig. 7
Fig. 7
Axitinib prevents CAR-T cell exhaustion by activating the Wnt/β-catenin pathway. (A) qPCR analysis of key regulatory factors (CTNNB1 and CTNNB1P1) of the Wnt pathway in groups (n = 3). (B, C) Western blot analysis of total β-catenin and phospho-β-catenin Ser33/37/Thr41 in groups (n = 3), with β-actin used as a loading control. The statistical analysis plot shows the ratio of the IntDen values of these proteins to β-actin from three independent experiments. (D, E) On day 6, CAR-T cells were collected and treated with Axitinib (1µM) or TWS119 (1µM) for 6 days respectively. Western blot analysis was explored to detect the expression of total β-Catenin, phospho-β-catenin Ser33/37/Thr41 in the cytoplasm, and the expression of total β-catenin in the nucleus. Cytoplasmic internal reference was β-actin, and nuclear internal reference was Lamin B1. Statistical analysis plots show the ratio of protein IntDen values to β-actin or Lamin B1 from three independent experiments. (F, G) After 3 days of Axitinib treatment, CAR-T cells from the control group were treated with Axitinib for an additional 3 days, while cells from the Axitinib + LF3 group were treated with both Axitinib (1μM) and LF3 (3μM) for an additional 3 days. Western blot analysis was used to detect the protein levels of total β-catenin in the cytoplasm and nucleus with β-actin and Lamin B1 as internal controls. The statistical analysis plot presented the ratio of protein IntDen values to β-actin or Lamin B1 in triplicate experiments. (H) Flow cytometry analysis to detect the effects of Axitinib or TWS119 on CAR-T cell differentiation status (cultured as D, n = 3). (I) Flow cytometry was used to detect the effects of Axitinib or Axitinib + LF3 on CAR-T cell differentiation status (cultured as F, n = 3). (J, L) After being cultured as D, flow cytometry was conducted to detect the effects of Axitinib or TWS119 on exhaustion markers (TIM3 and LAG3) in CAR-T cells (n = 3). (K, M) After being cultured as F, flow cytometry was used to detect the effects of Axitinib or Axitinib + LF3 on exhaustion markers (TIM3 and LAG3) in CAR-T cells (n = 3). All data are presented as the mean ± SD. * P < 0.05, ** P < 0.01, *** P < 0.001, ns (not significant)
Fig. 8
Fig. 8
Inhibition of VEGFR2 signaling in CAR-T cells activates the Wnt/β-catenin pathway and prevents CAR-T cell exhaustion. (A) Flow cytometry was used to detect VEGFR1 and VEGFR2 on CAR-T cells on day 6 (n = 3). (B) Western blot analysis of VEGFR1 and VEGFR2 protein expression in CAR-T cells (n = 3). (C-D) After 6-day 1 μM Axitinib treatment, Western blot was used to analyze phospho-VEGFR2 in control and treated CAR-T cells, with HUVECs serving as positive controls (n=3). (E-H) CAR-T cells were treated with either DMSO or Ramucirumab (1 μM) for 6 days starting on day 6. Exhaustion markers (PD-1, TIM3, and LAG3) and memory marker (CCR7) were determined by flow cytometry (n=3). (I) qPCR analysis was performed to evaluate the expression levels of key Wnt pathway regulators (CTNNB1, CTNNB1P1) in CAR-T cells treated with Ramucirumab (1 μM, 6 days) vs. control (n=3). (J-K)CAR-T cells were treated with either 1 μM Ramucirumab or 1 μM Axitinib for 6 days starting on day 6. Total β-catenin levels in the cytoplasm (β-actin reference) and nucleus (Lamin B1 reference) were analyzed by Western blot. Data represent protein IntDen ratios to reference proteins from triplicates. (L-M) c-MYC and cyclin D1 expression in treatment groups (cultured as in J, n=3) was analyzed by Western blot. All experimental data are presented as mean ± SD. * P < 0.05, ** P < 0.01, *** P < 0.001, ns (not significant)

Similar articles

References

    1. Lu J, Jiang G. The journey of CAR-T therapy in hematological malignancies. Mol Cancer. 2022;21(1):194. - PMC - PubMed
    1. Schuster SJ, Bishop MR, Tam CS, et al. Tisagenlecleucel in adult relapsed or refractory diffuse large B-Cell lymphoma. N Engl J Med. 2019;380(1):45–56. - PubMed
    1. Park JH, Rivière I, Gonen M, et al. Long-term follow-up of CD19 CAR therapy in Acute Lymphoblastic leukemia. N Engl J Med. 2018;378(5):449–59. - PMC - PubMed
    1. Maude SL, Laetsch TW, Buechner J, et al. Tisagenlecleucel in Children and Young adults with B-Cell lymphoblastic leukemia. N Engl J Med. 2018;378(5):439–48. - PMC - PubMed
    1. Lee DW, Kochenderfer JN, Stetler-Stevenson M, et al. T cells expressing CD19 chimeric antigen receptors for acute lymphoblastic leukaemia in children and young adults: a phase 1 dose-escalation trial. Lancet (London England). 2015;385(9967):517–28. - PMC - PubMed

MeSH terms

Substances

LinkOut - more resources