. 2025 Apr 30;22(1):126.
doi: 10.1186/s12974-025-03453-z.

Ubiquitination-mediated upregulation of glycolytic enzyme MCT4 in promoting astrocyte reactivity during neuroinflammation

Affiliations

Ubiquitination-mediated upregulation of glycolytic enzyme MCT4 in promoting astrocyte reactivity during neuroinflammation

Luting Yang et al. J Neuroinflammation. .

Abstract

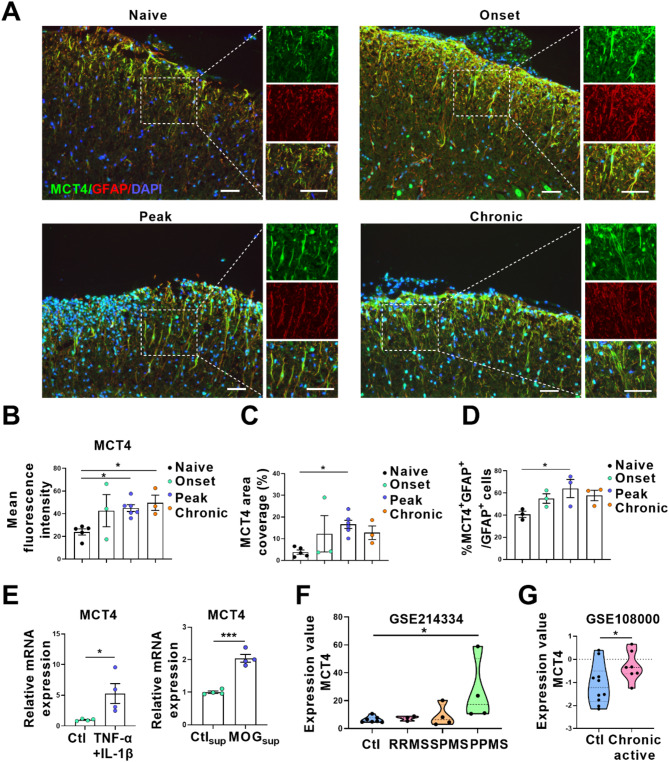
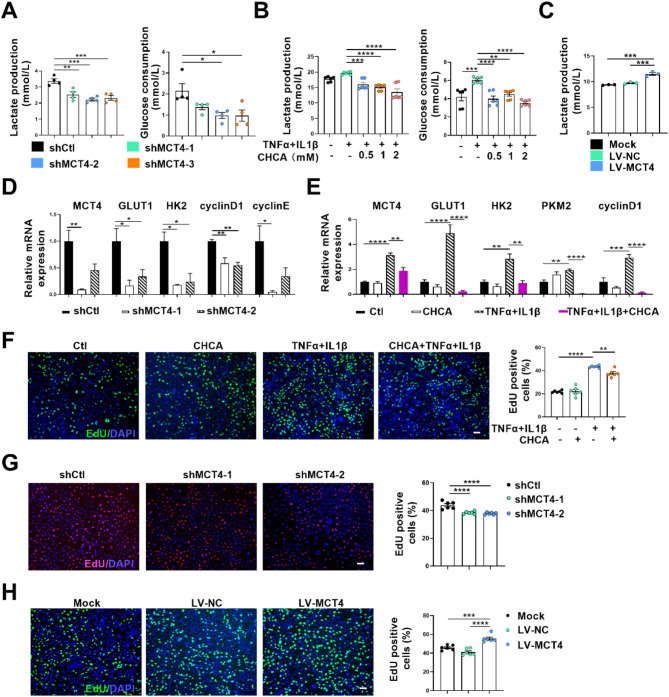
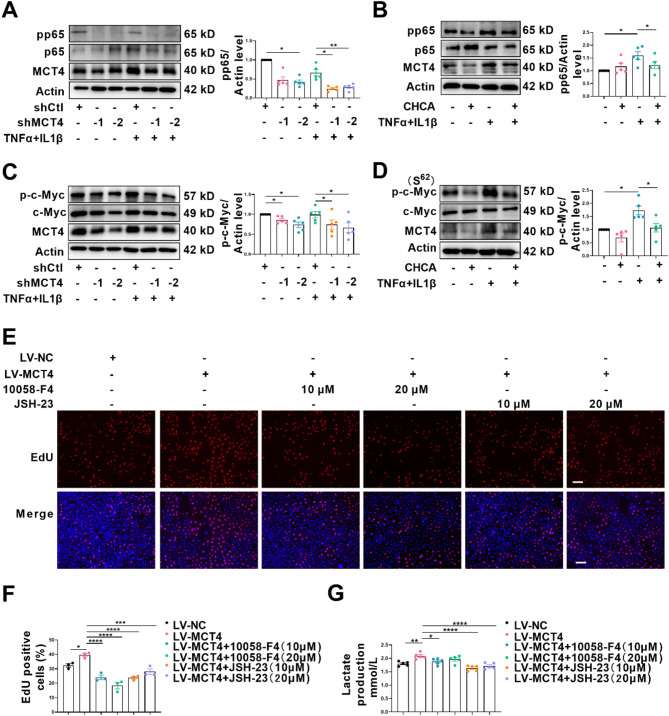
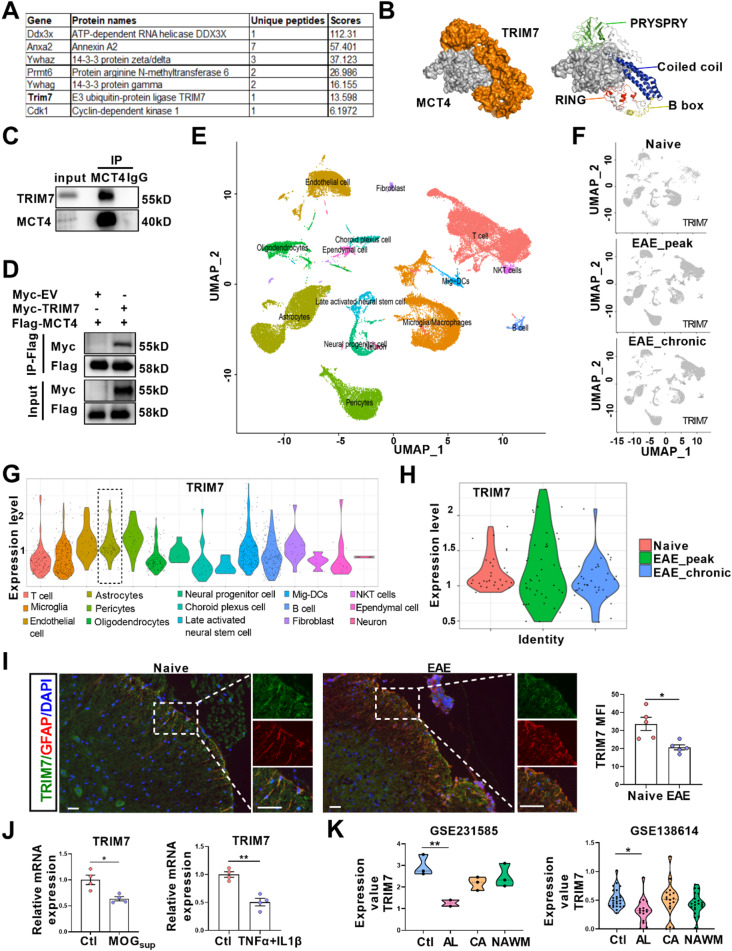
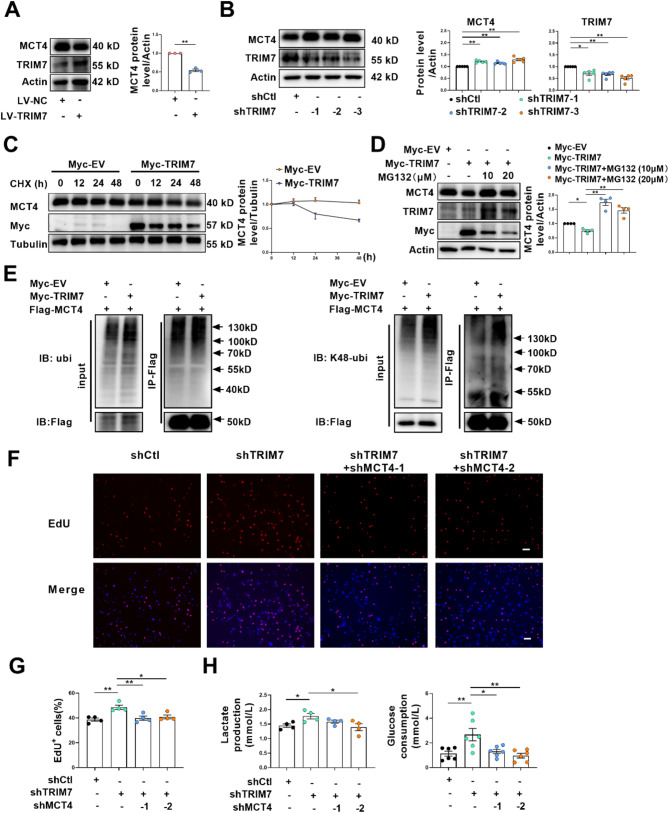
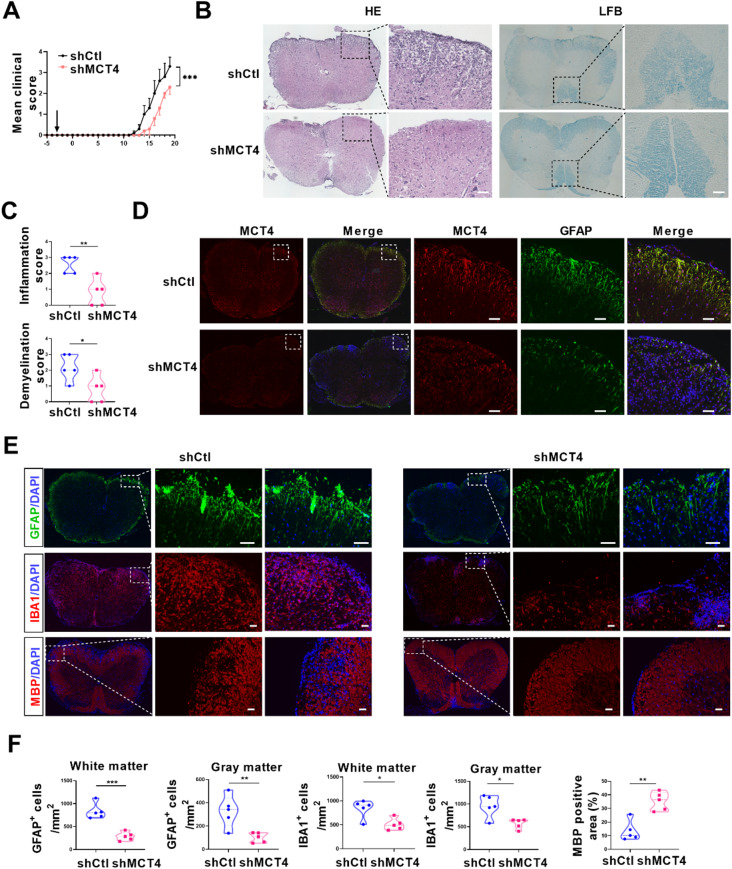
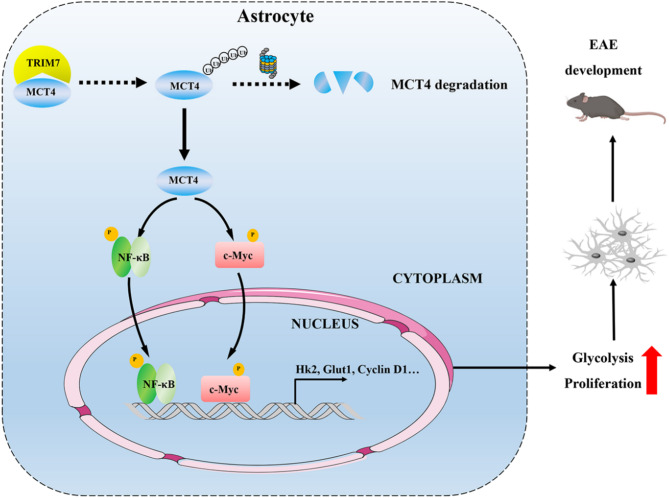
One of the histopathological hallmarks of neuroinflammatory diseases such as multiple sclerosis (MS) is the emergence of astrocyte reactivity. Accumulating evidence suggests that excessive glycolysis may lead to astrocyte reactivity and contribute to neuroinflammatory responses. However, the intricate mechanisms underlying astrocyte metabolic reprogramming towards glycolysis remain largely unknown. Here, we conducted in vitro experiments using primary astrocytes and in vivo studies in an experimental autoimmune encephalomyelitis (EAE) mouse model of multiple sclerosis (MS). We observed increased astrocytic expression of MCT4, a key glycolytic regulator, in EAE mice. MCT4 enhanced astrocyte reactivity through promoting glycolysis and proliferation, mediated primarily by activation of the NF-κB and c-Myc signaling pathways. Notably, we report a novel regulatory mechanism in which the E3 ubiquitin ligase TRIM7 regulates MCT4 levels via ubiquitination. In mice, blockade of astrocyte MCT4 expression by intracerebroventricular injection of lentivirus alleviated disease severity of EAE mice. The results suggest that targeting glycolysis, specifically through the inhibition of MCT4 expression, might be effective in reducing astrocyte reactivity, neuroinflammation and demyelination occurring in MS and relating neuroinflammatory diseases.

Keywords: Astrocyte; Experimental autoimmune encephalomyelitis; Glycolysis; Proliferation; Ubiquitination.


Conflict of interest statement

Declarations. Ethical approval: The study was conducted in accordance with the Declaration of Helsinki, and approved by the Institutional Review Board of Shaanxi Normal university (Permit Number: 2024 − 179). Consent for publication: Not applicable. Competing interests: The authors declare no competing interests.

Figures

Fig. 1
Fig. 1
MCT4 expression is upregulated in astrocytes of EAE mice. (A) Representative images (low and high magnification) showing immunofluorescence staining of MCT4 in the astrocytes (GFAP) in the spinal cords from naive, EAE onset (score 1; Day 7–17 p.i.), peak (score ≥ 3; Day 14–24 p.i.), and chronic (score ≥ 2; Day 21–26 p.i.) mice. (B) Quantification of mean fluorescence intensity of MCT4 in the spinal cord of EAE onset (n = 3), peak (n = 6), chronic (n = 3) and naive (n = 5) mice. (C) Quantification of MCT4 positive area coverage in spinal cord in different groups of mice. EAE onset (n = 3), peak (n = 6), chronic (n = 3) and naive (n = 5). (D) Quantification of MCT4+GFAP+ cells in the total number of GFAP+ cells in EAE onset (n = 3), peak (n = 3), chronic (n = 3) and naive (n = 3) mice. (E) qRT-PCR analysis of MCT4 in primary astrocytes treated alone or with TNF-α and IL-1β (left), or treated with splenocytes supernatants of control mice (Ctlsup) or with splenocytes supernatants of MOG35–55-induced EAE mice (MOGsup) for 24 h. (F) Analysis of MCT4 mRNA expression in normal-appearing white matter from relapse-remitting multiple sclerosis (RRMS), primary progressive MS (PPMS), secondary progressive MS (SPMS) and non-MS control tissue from GEO dataset GSE214334. (G) Analysis of MCT4 mRNA expression in control tissue and rim of chronic active MS lesions from GSE108000. Scale bar: 50 μm. Data are represented as mean ± SEM. *P < 0.05, ***P < 0.001, using one-way ANOVA with Dunnett’s multiple comparison test (B, C, D and F), using unpaired t test (E and G)
Fig. 2
Fig. 2
MCT4 promotes astrocyte glycolysis and proliferation. (A) Analysis of glucose consumption and lactate production levels in MCT4-knockdown astrocytes (shMCT4) and control astrocytes (shCtl). (B) Primary astrocytes were treated with MCT4 inhibitor CHCA for 24 h, followed by stimulation with 50 ng/mL TNF-α and IL-1β for 24 h. Glucose consumption and lactate production levels were measured. (C) Analysis of lactate production levels in MCT4-overexpressed astrocytes (LV-MCT4), control astrocytes (LV-NC), and non-treated astrocytes (mock). (D) qRT-PCR analysis of MCT4, GLUT1, HK2, Cyclin D1 and Cyclin E in MCT4-knockdown astrocytes and control astrocytes. (E) Effect of MCT4 inhibitor CHCA (1 mM) on the mRNA expression of MCT4, GLUT1, HK2, PKM2 and Cyclin D1 in TNF-α and IL-1β-stimulated astrocytes. (F) Effect of MCT4 inhibitor CHCA on the proliferation of TNF-α and IL-1β stimulated astrocytes was measured by EdU assay. For quantification of EdU, 6 fields were included for each group. (G) Cell proliferation was measured in MCT4 knockdown and control astrocytes. EdU+ cells were quantified. (H) Cell proliferation was measured in mock, control-lentivirus and MCT4-overexpressed astrocytes by EdU incorporation assay. EdU+ cells were quantified by Image-Pro Plus. Scale bar: 100 μm. Data are represented as mean ± SEM. *P < 0.05, **P < 0.01, ***P < 0.001, ****P < 0.0001 using one-way ANOVA with Dunnett’s multiple comparison test
Fig. 3
Fig. 3
MCT4 promotes cell proliferation and glycolysis via activation of NF-κB and c-Myc pathway. (A) Western blotting analysis of NF-κB pathway activation in MCT4-knockdown and control astrocytes, cultured alone, or with 50 ng/mL TNF-α and IL-1β for 24 h. The protein level of phospho-p65 is normalized to β-actin. (B) Effect of MCT4 inhibitor CHCA on the expression of phosphorylated p65 in NF-κB pathway was measured by western blotting. Primary astrocytes were pretreated with 1 mM CHCA for 24 h, followed by stimulation with TNF-α and IL-1β for 24 h. The protein level of phospho-p65 is normalized to β-actin. (C) Western blotting analysis of phosphorylated c-Myc and total c-Myc in MCT4-knockdown and control astrocytes. The protein level of phospho-c-Myc is normalized to β-actin. (D) Effect of MCT4 inhibitor CHCA on activation of c-Myc signaling was measured by western blotting. The protein level of phospho-c-Myc is normalized to β-actin. (E) Effect of c-Myc inhibitor and NF-κB inhibitor on the proliferation of astrocytes was measured by EdU assays. Cells were treated with NF-κB inhibitor JSH-23 for 2 h, or with c-Myc inhibitor 10,058-F4 for 24 h at indicated concentration. (F) EdU+ cells were quantified in each group indicated. (G) Effect of c-Myc inhibitor and NF-κB inhibitor on lactate production of astrocytes were measured. Scale bar: 100 μm. Data are from at least 3 independent experiments (A-D). Data are represented as mean ± SEM. *P < 0.05, **P < 0.01, ***P < 0.001, ****P < 0.0001 using one-way ANOVA with Dunnett’s multiple comparison test
Fig. 4
Fig. 4
E3 ubiquitin ligase TRIM7 interacts with MCT4 and its expression is downregulated in astrocytes of EAE mice. (A) List of MCT4 binding proteins identified by mass spectrometry. Primary astrocytes overexpressed with MCT4-GFP were immunoprecipitated with GFP. (B) Molecular docking of TRIM7 and MCT4 performed by ZDOCK. Different domains of TRIM7, including RING (red), Coiled coil (blue) and PRY-SPRY (green) were predicted to interact with MCT4. Pymol software was used to display the docking results. (C) Immunoprecipitation with anti-MCT4 showed endogenous binding between TRIM7 and MCT4 in primary astrocytes. (D) Astrocytes were transfected with Myc-tagged TRIM7 and Flag-tagged MCT4, or with Myc-tagged empty vector and Flag-tagged MCT4. Immunoprecipitation with anti-Flag showed exogenous binding between TRIM7 and MCT4. (E-H) Single-cell RNA-seq profiles from control and EAE mice (peak and chronic phase) CNS tissues. (E) UMAP of CNS cells colored by cell types from mice with EAE. (F) Expression of TRIM7 in different cell types from naive and EAE mice. (G) Violin plots displaying the expression of TRIM7 across the cell types identified. (H) Violin plots displaying the expression of TRIM7 at peak, chronic phases from naive and EAE mice in astrocytes. (I) Representative images of immunofluorescence staining of TRIM7 (green) and GFAP (red) in spinal cords of naive and EAE mice. Quantification of mean fluorescence intensity of TRIM7 in the spinal cords of naive (n = 5) and EAE (n = 5) mice. (J) qRT-PCR analysis of TRIM7 mRNA expression in primary astrocytes treated with MOGsup (left) or 50 ng/mL TNF-α and IL-1β for 24 h. (K) RNA-seq analysis of TRIM7 expression in the white matter of MS patient (AL: active lesion, CA: chronic active, NAWM: normal-appearing white matter) and controls from GEO dataset GSE231585 and GSE138614. Scale bar: 50 μm. Data are represented as mean ± SEM. *P < 0.05, **P < 0.01 using unpaired t-test
Fig. 5
Fig. 5
TRIM7 restricts MCT4-mediated proliferation and glycolysis of astrocyte via ubiquitination. (A) Western blotting analysis and quantification of MCT4 protein level in TRIM7-overexpressed astrocytes and control astrocytes. (B) Western blotting analysis and quantification of MCT4 and TRIM7 protein level in TRIM7-knockdown and control astrocytes. (C) MCT4 protein stability was measured in control (Myc-EV) and TRIM7-overexpressed (Myc-TRIM7) astrocytes by cycloheximide (CHX) assays. Cells were treated with 20 µM CHX for the time indicated. (D) Astrocytes overexpressed with TRIM7 were treated with MG132 for 12 h. Protein level of MCT4, TRIM7 were analyzed by western blotting. (E) Immunoprecipitation assay showed that TRIM7 promoted the K48-linked ubiquitination of MCT4. Cells were transfected with Myc-EV and Flag-MCT4, or Myc-TRIM7 and Flag-MCT4, immunoblot analysis of total ubiquitination, K48-linked ubiquitination of Flag-tagged MCT4. (F) EdU assay evaluate the proliferation in control astrocytes, astrocytes knocked down with TRIM7, or astrocytes knocked down with TRIM7 and MCT4. (G) EdU positive cells were counted in each group in (F). (H) Lactate production and glucose consumption were detected in control astrocytes, astrocytes knocked down with TRIM7, or astrocytes knocked down with TRIM7 and MCT4. Scale bar: 100 μm. Data are from at least 3 independent experiments (A-D). Data are represented as mean ± SEM. *P < 0.05, **P < 0.01, ***P < 0.001, using one-way ANOVA with Dunnett’s multiple comparison test (B, D, G and H) or paired t test (A)
Fig. 6
Fig. 6
Intracerebroventricular injection of shMCT4 decreases disease severity during EAE. C57BL/6 mice were injected i.c.v with 1 × 107 IU shMCT4 or control lentivirus (shCtl) 3 days before immunization. Mice were sacrificed at day 19 p.i. and spinal cords were harvested. (A) Disease was scored daily on a 0 to 5 scale. n = 5 for each group. (B) Representative images (low and high magnification) of hematoxylin and eosin (H&E) and Luxol fast blue (LFB) staining, respectively. (C) Scoring of inflammation (H&E) and demyelination (LFB) on a 0–3 scale. (D) Verification of in vivo MCT4 knockdown efficiency by immunofluorescence in shCtl and shMCT4-treated EAE mice. (E) Immunostaining of GFAP, IBA1 and MBP in spinal cord sections of shCtl and shMCT4-treated EAE mice. (F) Quantification of GFAP positive cells/mm2, IBA1 positive cells/mm2 in both the white matter and gray matter. MBP positive area was measured in the white matter of the spinal cord using Image-Pro Plus. The measured areas included 3 to 5 fields per group. i.c.v., intracerebroventricular; p.i., postimmunization. Scale bar: 50 μm. Data are represented as mean ± SEM. *P < 0.05; **P < 0.01; ***P < 0.001, as determined by two-way ANOVA analysis (A) or unpaired Student’s t test (C and F)
Fig. 7
Fig. 7
Schematic representation of the proposed TRIM7-MCT4 axis in astrocyte reactivity during EAE. During MS and EAE, downregulated expression of E3 ubiquitin ligase TRIM7 reduced the ubiquitin-proteasome pathway dependent degradation of MCT4. Increased MCT4 interacted with NF-κB and c-Myc, promoting the phosphorylation and nuclear translocation of NF-κB and c-Myc. The activation of the aforementioned pathways further facilitated the activation of astrocytes via promoting astrocytic glycolysis and proliferation during EAE

Similar articles

References

    1. Verkhratsky A, Butt A, Li B, Illes P, Zorec R, Semyanov A, Tang Y, Sofroniew MV. Astrocytes in human central nervous system diseases: a frontier for new therapies. Signal Transduct Target Therapy. 2023;8:396. - PMC - PubMed
    1. Escartin C, Galea E, Lakatos A, O’Callaghan JP, Petzold GC, Serrano-Pozo A, Steinhäuser C, Volterra A, Carmignoto G, Agarwal A, et al. Reactive astrocyte nomenclature, definitions, and future directions. Nat Neurosci. 2021;24:312–25. - PMC - PubMed
    1. Lee H-G, Wheeler MA, Quintana FJ. Function and therapeutic value of astrocytes in neurological diseases. Nat Rev Drug Discovery. 2022;21:339–58. - PMC - PubMed
    1. Moulson AJ, Squair JW, Franklin RJM, Tetzlaff W, Assinck P. Diversity of reactive astrogliosis in CNS pathology: heterogeneity or plasticity?? Front Cell Neurosci. 2021;15:703810. - PMC - PubMed
    1. Theophanous S, Sargiannidou I, Kleopa KA. Glial cells as key regulators in neuroinflammatory mechanisms associated with multiple sclerosis. Int J Mol Sci. 2024;25:9588. - PMC - PubMed

MeSH terms

Substances

LinkOut - more resources